Most compliance programs run on a calendar. You assess in Q1, remediate through Q2, and hand the auditor a clean package in Q3 — a photograph of a single moment. But your control environment is a film, not a photo. The week after you certify, an admin loosens a firewall rule, an evidence document goes a quarter stale, a control that was Managed slips back to Developing. Nobody notices until the next assessment re-discovers it — often as an audit finding.
That gap has a name in the frameworks. SOC 2’s CC4.1 (COSO Principle 16) requires ongoing evaluations, not just periodic ones. NIST CSF’s DE.CM is a whole function — continuous monitoring. ISO 27001 clause 9.1 expects you to monitor control performance, not just design it once. Talarity’s Continuous Compliance turns that expectation into a running system: a baseline of your known-good state, automated daily drift detection against it, and an evidence-freshness clock — so the question “are we still compliant?” has a real-time answer.
Who’s involved
- Compliance lead — sets the baseline, tunes the detection cadence, triages drift events.
- Control owner — gets the alert when their control drifts and closes the gap.
- Auditor — wants proof the monitoring actually ran, continuously, with a history they can inspect.
What’s on the page
Open Continuous Compliance (under Compliance). It’s one monitoring surface with a tab strip — each tab a different cut of the same drift data:
- Dashboard — the headline posture: baseline version, active-drift count, the 30-day trend, the count of controls monitored, a Healthy/at-risk banner, and the Automated Monitoring schedule (the times drift detection, evidence monitoring, and alerts run).
- Baseline — your known-good snapshot: total controls and the compliant / partial / non-compliant / not-applicable split, plus a Coverage card naming the framework and org.
- By Framework — a card per framework (HIPAA, PCI-DSS, ISO 27001, SOC 2, CMMC, FedRAMP, NIST CSF, CIS…), each with its own drift count and severity breakdown — drift across every framework at once.
- History — the chronological log of detection runs, each stamped with when it ran and how many drift events it found.
- Control Testing — the design-and-effectiveness layer: design- and OE-coverage percentages, tests in progress, and a per-control table (number, name, type, design/effectiveness status, overall result, last-test time), filterable by type and status.
- Settings — the cadence and thresholds that drive it all: the drift-detection schedule, the evidence-freshness windows (warning / stale / critical), and the score thresholds.
The rest of this guide walks those tabs in the order you’d actually use them.
Step 1 — The Continuous Compliance dashboard
Open Continuous Compliance (/app/compliance/drift). The dashboard is your posture at a glance: a baseline status, active drift events broken out by severity, a 30-day trend, and the count of controls monitored. The four-step workflow strip across the top — Review Status → Investigate Drift → Update Baseline → Track Trends — is the loop the page is built around.
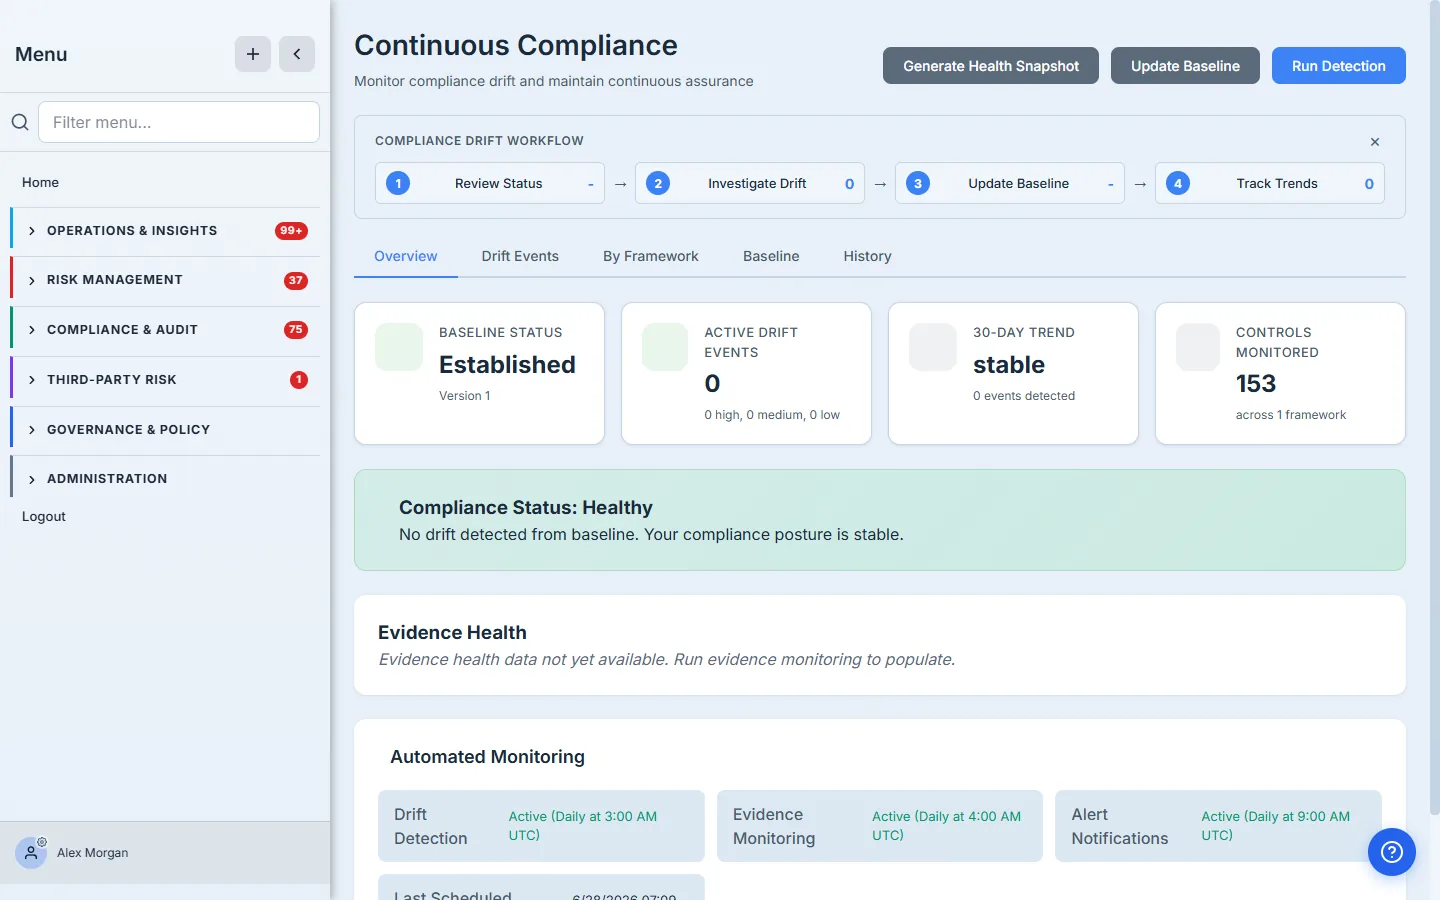
The part that makes it continuous rather than occasional is the Automated Monitoring panel at the bottom: drift detection, evidence monitoring, and alert notifications each run on their own daily schedule. You don’t push a button to check compliance — the platform checks it for you and surfaces the result. And when you do need a point-in-time artifact for an auditor or the board, Generate Health Snapshot (top right) drafts the whole posture — baseline, drift, cadence, evidence freshness — as a dated attestation into your Capstone Library.
Step 2 — The baseline: your known-good state
Continuous monitoring is meaningless without a reference point. The Baseline tab captures exactly that — the state of every control at the moment you declared “this is compliant.” Here the baseline covers 153 controls across CIS Controls v8.1, scored 79 compliant and 74 partial, for the linked account Talarity Retail Group.
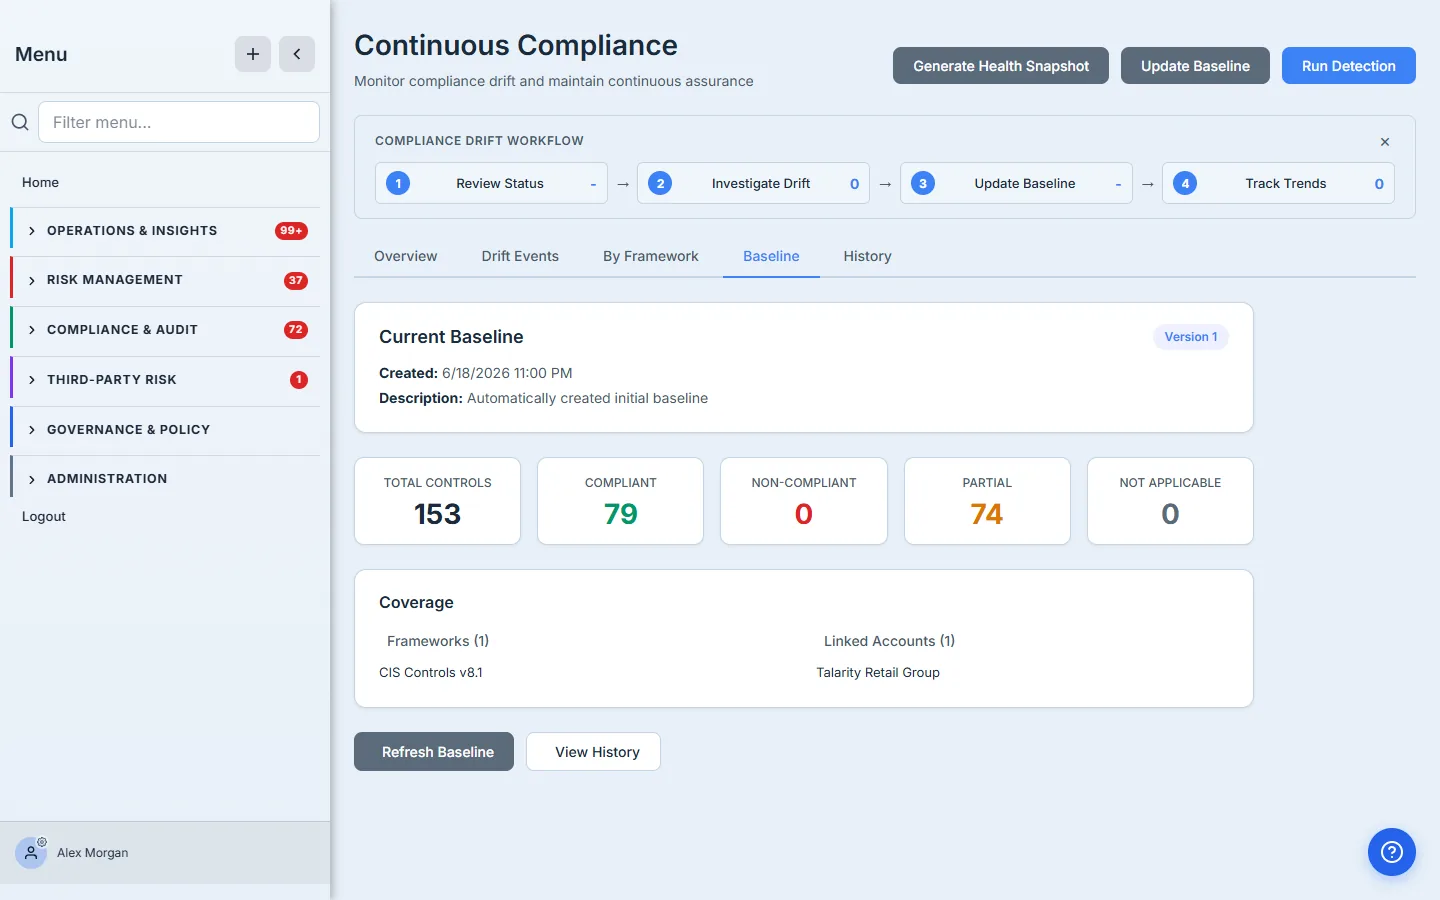
A subtle but important detail: these controls are scored on a maturity scale (None → Initial → Developing → Defined → Managed → Optimized), not a binary pass/fail. A control sitting at Defined or above counts as compliant; Initial or Developing is partial. Drift detection compares today’s maturity against this baseline — so a control sliding from Managed back to Developing is caught as a real regression, not lost in a pass/fail bucket.
Step 3 — Drift across every framework at once
Most organizations carry more than one framework. The By Framework tab runs detection across all of them side-by-side — one card per framework, each showing its drift-event count, severity breakdown, and the latest detection time. Click any card to drop into the drift events filtered to that framework.
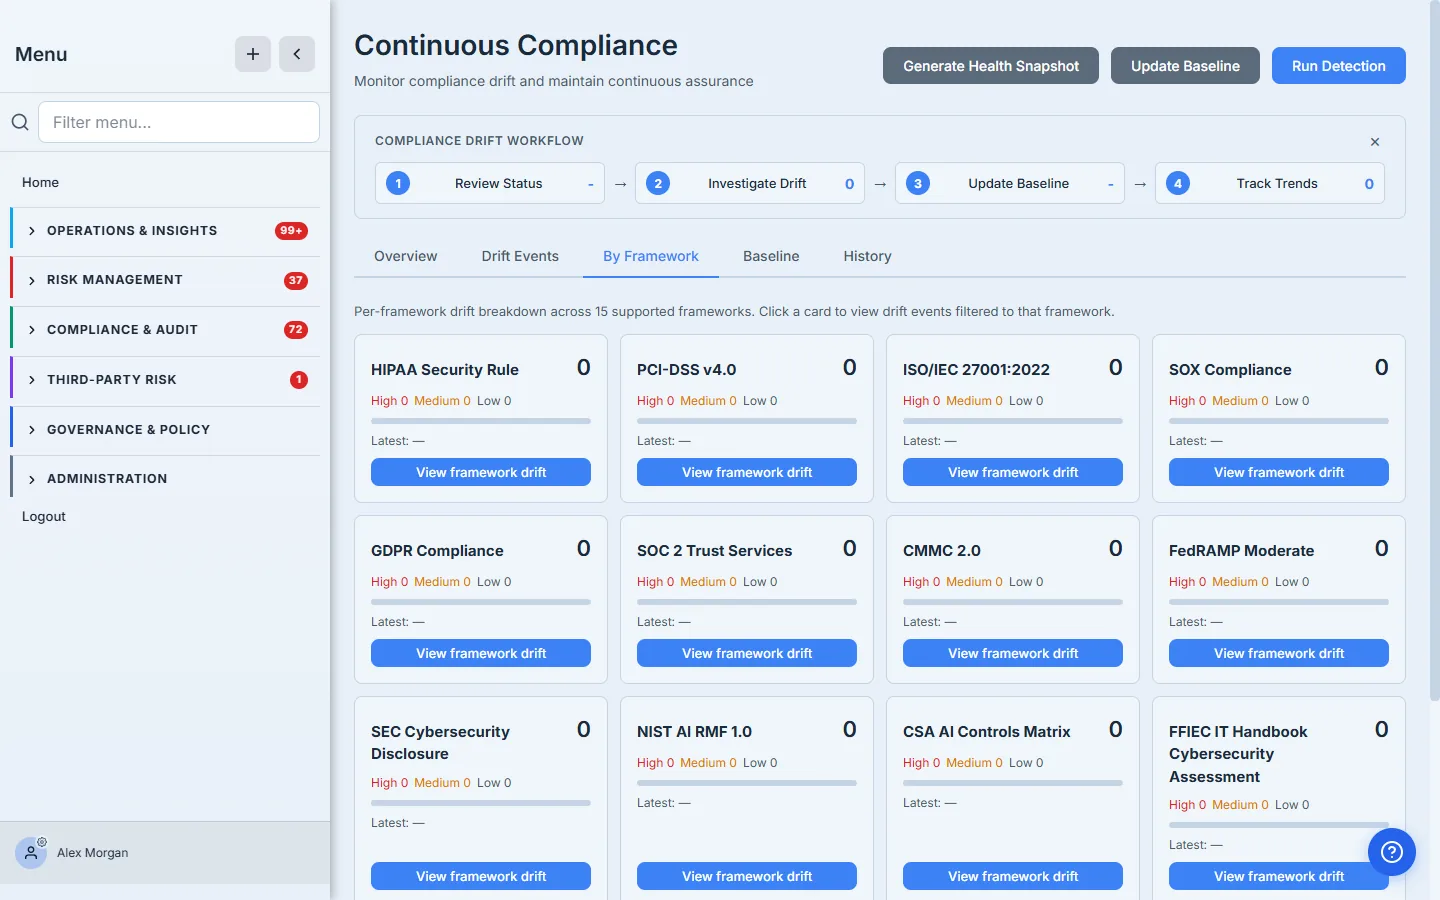
This is the view that answers a board-level question without a spreadsheet: “are we drifting anywhere?” One screen, every framework, ranked by where the movement is.
Step 4 — Tune the cadence and the thresholds
Continuous doesn’t mean one-size-fits-all. Continuous Compliance Settings (/app/settings/continuous-compliance) is where you set the rhythm and the sensitivity. The Drift Detection Schedule controls how often the system checks (here, daily at 3 AM UTC). The Evidence Freshness Thresholds put a clock on your evidence — warning at 60 days, stale at 90, critical at 180 — so a control that’s technically “compliant” but resting on year-old proof gets flagged before an auditor does. The Score Thresholds decide what severity a drop earns.
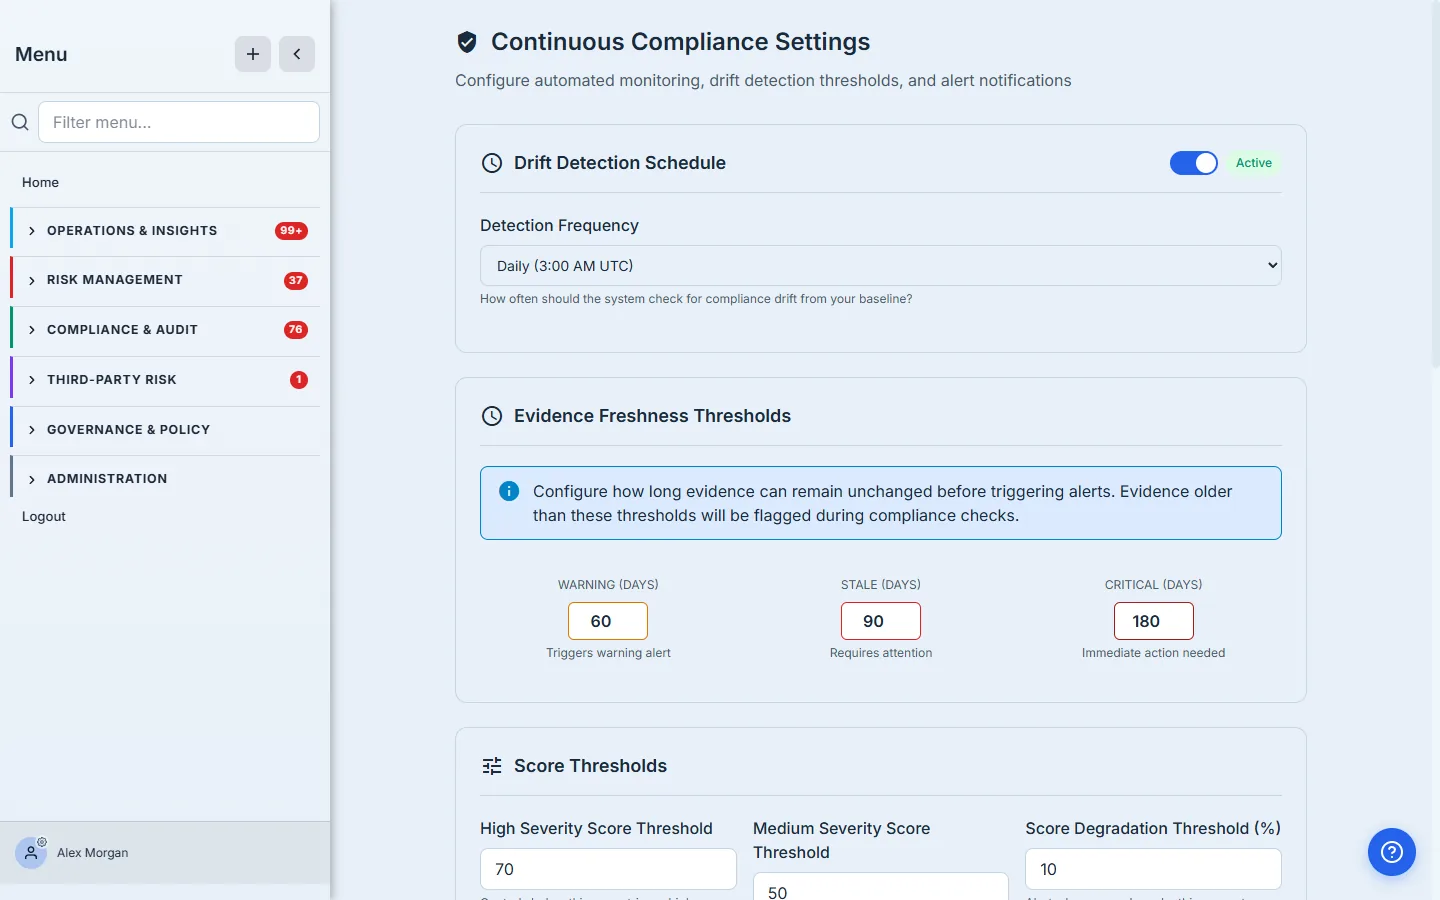
The evidence-freshness clock is the feature most teams don’t know they needed. Compliance doesn’t usually fail because a control was never implemented — it fails because the proof quietly aged out. A 90-day staleness threshold turns that silent decay into an alert.
Step 5 — The detection history: proof it actually ran
An auditor’s follow-up to “you monitor continuously” is “prove it.” The History tab is that proof — a timestamped log of every detection run and what it found. Each entry records when the run executed and how many drift events it detected.
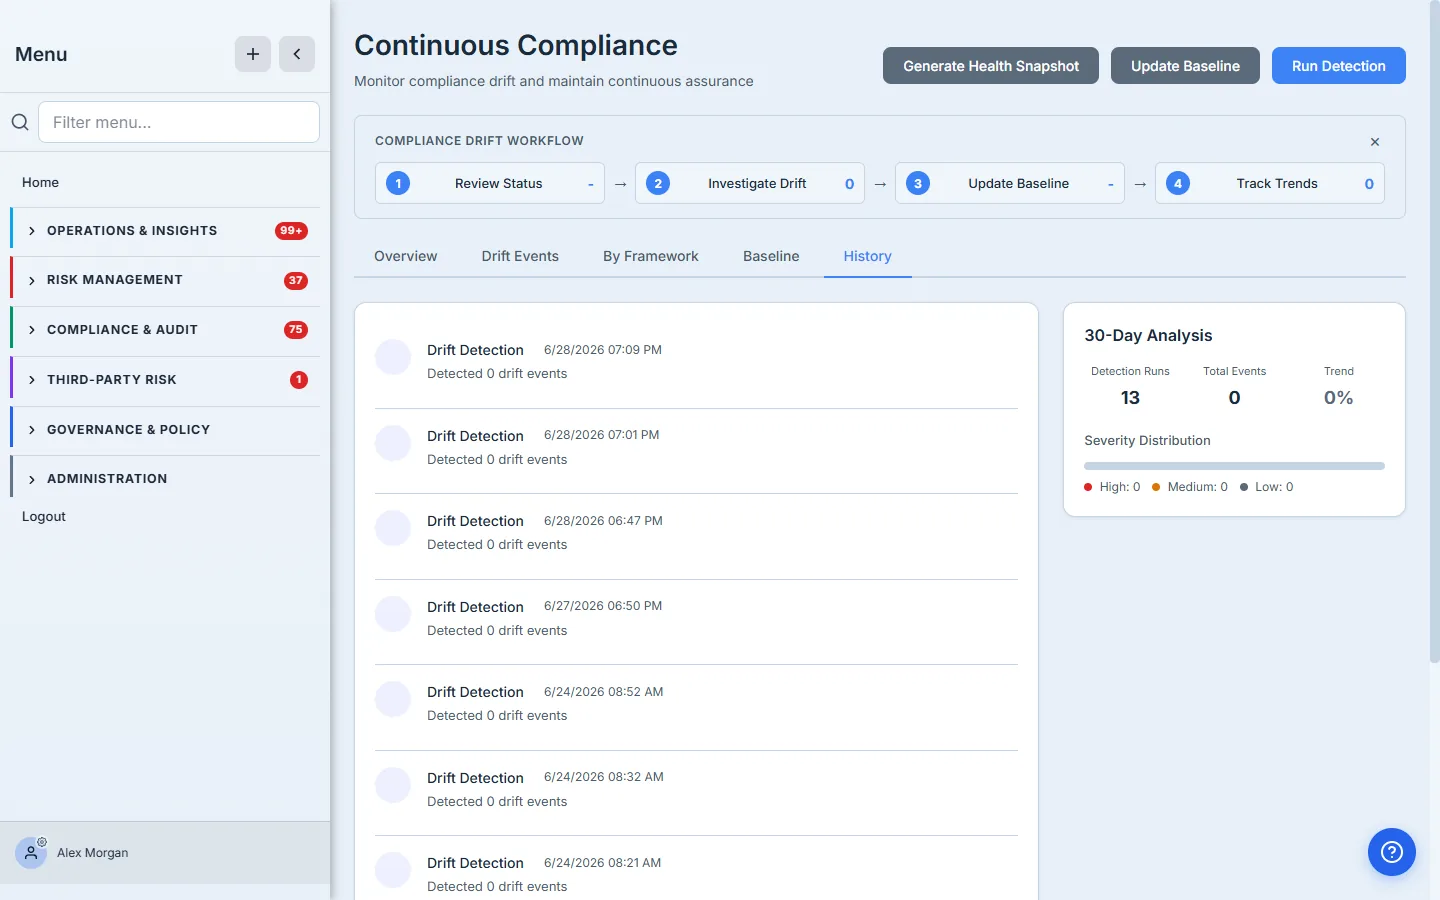
This is what separates a claim from evidence. The history shows the monitoring ran on schedule, every day, whether or not anything drifted — which is exactly the operating-effectiveness story CC4.1 is asking for.
Step 6 — Control testing: the design-and-effectiveness layer
Drift detection watches your scored posture; Control Testing (/app/control-testing) is where you prove individual controls actually work. It tracks Design and Operating Effectiveness (D&E) testing per control — design coverage, OE coverage, tests in progress — with a per-control table you can filter by type and status and run a test directly from.
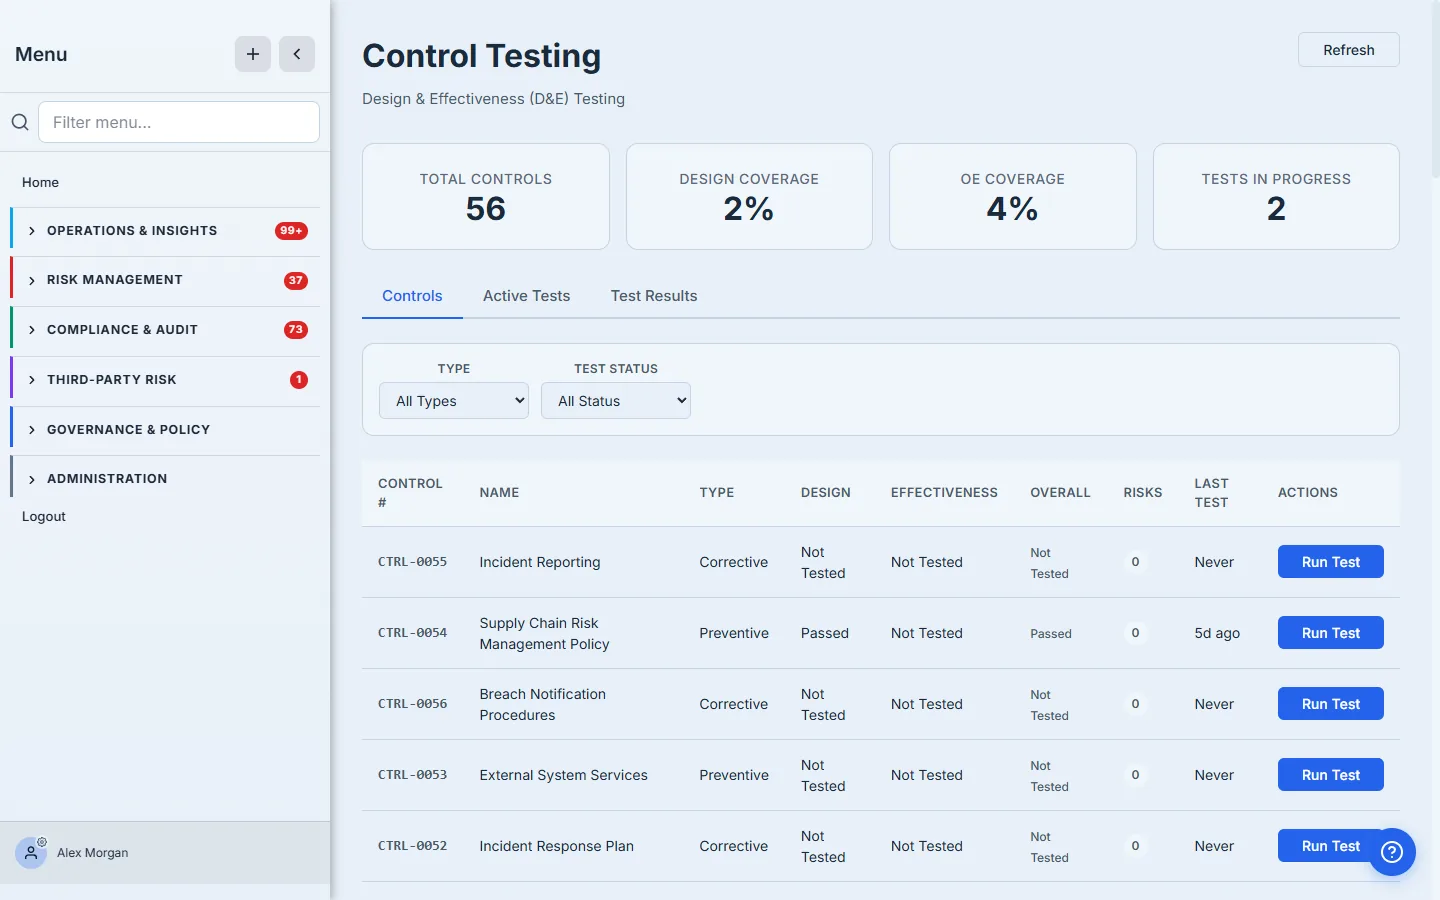
Where the baseline answers “is this control in place and mature?”, control testing answers “did we test it, and did it pass?” — the two halves of an SOC 2 control narrative.
What you walk away with
- A baseline of your known-good state — maturity-aware, per framework, per linked account — that drift is measured against.
- Automated daily detection — drift, evidence freshness, and alerts on their own schedules, so “are we still compliant?” has a real-time answer.
- An evidence-freshness clock — staleness thresholds that flag aging proof before it becomes an audit finding.
- A monitoring history — timestamped runs that prove the monitoring operated continuously, the way CC4.1 expects.
- A snapshot you can hand over — Generate Health Snapshot drafts the whole posture as a dated attestation into your Capstone Library.
Open Compliance → Framework Compliance, on the Continuous Compliance tab, set a baseline this afternoon, and let the first detection run overnight. Tomorrow morning, the question “did anything change?” stops being a quarterly scramble and becomes a line on a dashboard.