Every mature risk framework expects you to monitor risk continuously, not just assess it once a year. NIST CSF 2.0 puts continuous monitoring under DE.CM and GV.OV (oversight of the risk strategy); ISO 27001:2022 Clause 9.1 requires you to evaluate information-security performance against defined metrics; FFIEC’s management guidance expects key risk indicators wired to thresholds and escalation. The common thread: pick a number that moves before the loss event, set a line you don’t want it to cross, and watch it.
Most teams keep these numbers in a spreadsheet that nobody updates between audits. Talarity treats a Key Risk Indicator as a first-class object: a definition, a set of colored threshold bands, a measurement history, and a status that recolors itself the moment a reading crosses a line. This guide is the primer — how to define a KRI and feed it measurements. The downstream loop — what happens after a breach (alert review, acknowledge, open the linked risk, treat it) — is its own walkthrough; we hand off to it at the end.
Who’s involved
- Risk Manager — owns the KRI: picks the metric, sets the bands aligned to risk appetite, and reviews the trend.
- Control / metric owner — records the periodic measurement (or wires an automated source).
- Board / executive — reads the rolled-up health score and status mix, not the raw numbers.
- Auditor — pulls the measurement history to prove the control was monitored, with dates and notes, not just implemented.
What’s on the page
Open Key Risk Indicators (/app/grc/kri):
- Workflow strip — Define KRIs → Set Thresholds → Monitor Values → Review Alerts → Report to Board.
- Overview tab — the executive read: a KRI Health Score, the green/yellow/red status distribution, an alert summary, trend momentum, and gauge cards for the indicators that need attention.
- Indicators tab — the live KRI list with New KRI; each row shows the latest value against its bands.
- Detail panel — the per-indicator full readout: measurement history, thresholds, and linked risks.
Step 1 — Get oriented on the KRI workspace
Open Risk & Resilience → Key Risk Indicators (KRI) (/app/grc/kri). The Overview tab is the executive read: a KRI Health Score, the green/yellow/red status distribution, alert summary, and trend momentum, plus gauge cards for the indicators that need attention. The workflow strip across the top — Define KRIs → Set Thresholds → Monitor Values → Review Alerts → Report to Board — is the lifecycle this guide walks (we cover the first three; the last two are the breach-response loop).
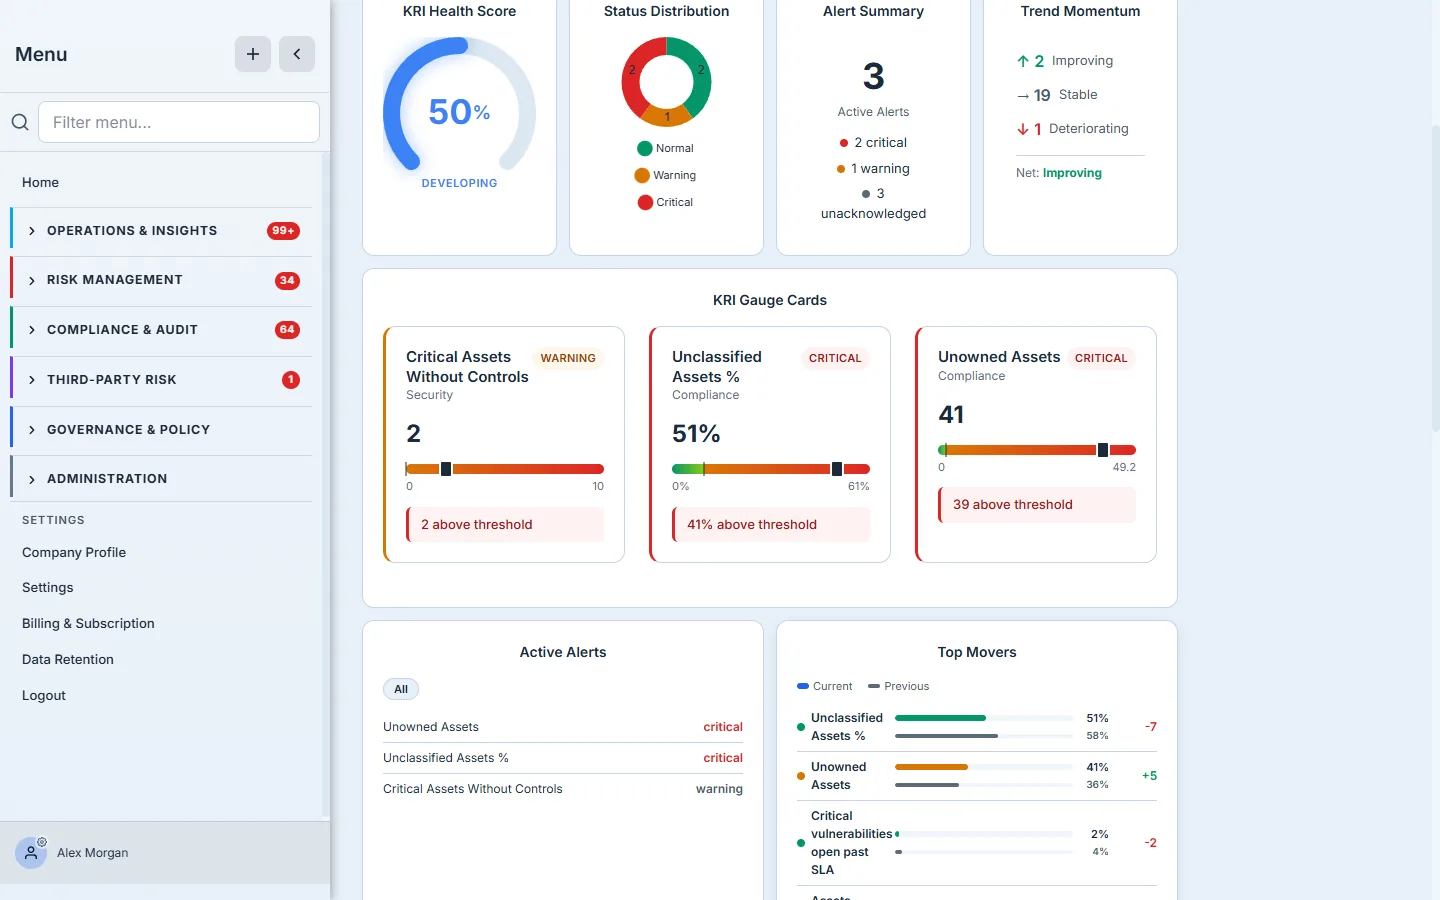
The five tabs split the work cleanly: Overview (read the program), Indicators (define and measure), Alerts (breaches), Analytics (correlation and forecasting once you have history), and Settings (auto-generate from your data).
Step 2 — Define a KRI
Switch to the Indicators tab and click New KRI. A good KRI is a leading number — something that climbs before the risk materializes. We’ll define one every security team knows: critical vulnerabilities still open past the 30-day remediation SLA.
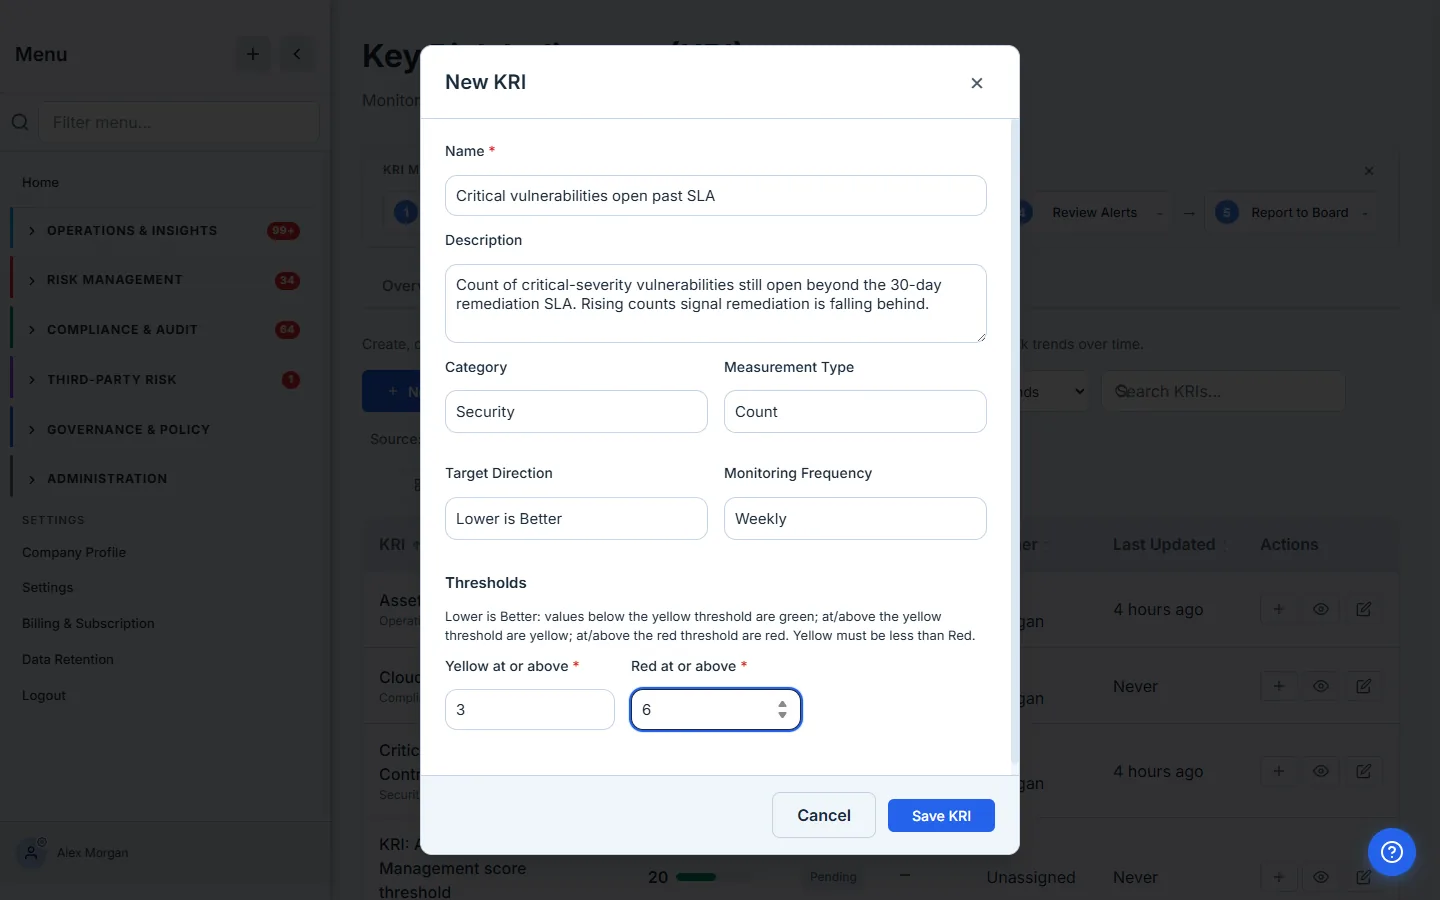
Each field changes how the indicator behaves:
- Measurement Type —
count,percentage,score,currency,days, orrate. It drives how the value is formatted everywhere it’s shown. Ours is a Count. - Target Direction — the single most important choice on this form. Lower is Better (fewer open vulnerabilities is good) flips the threshold logic so that rising values turn the indicator red. Pick the wrong direction and your bands invert.
- Monitoring Frequency — Daily / Weekly / Monthly / Quarterly. Talarity stamps a next-collection date from this so you can see what’s overdue. Match it to how often the number actually changes — Weekly for a vuln backlog.
Set the bands against your risk appetite, not by gut. The Yellow and Red boundaries are your tolerance, expressed as a number. For a lower-is-better KRI, Yellow at or above is where you want a heads-up and Red at or above is where it’s no longer acceptable. We set Yellow at 3 and Red at 6 — below 3 is green, 3–5 is yellow, 6-or-more is red. The modal restates the rule in plain language so the colors are never ambiguous.
Click Save KRI. Behind the scenes Talarity normalizes the bands to the target direction, stamps the next-collection date, and stores the indicator with a pending status — it stays pending until it has its first measurement.
Step 3 — Record a measurement
A KRI with no readings is just an intention. On the indicator’s row, click Record Value, enter this period’s number, and add a note that will live in the audit trail.
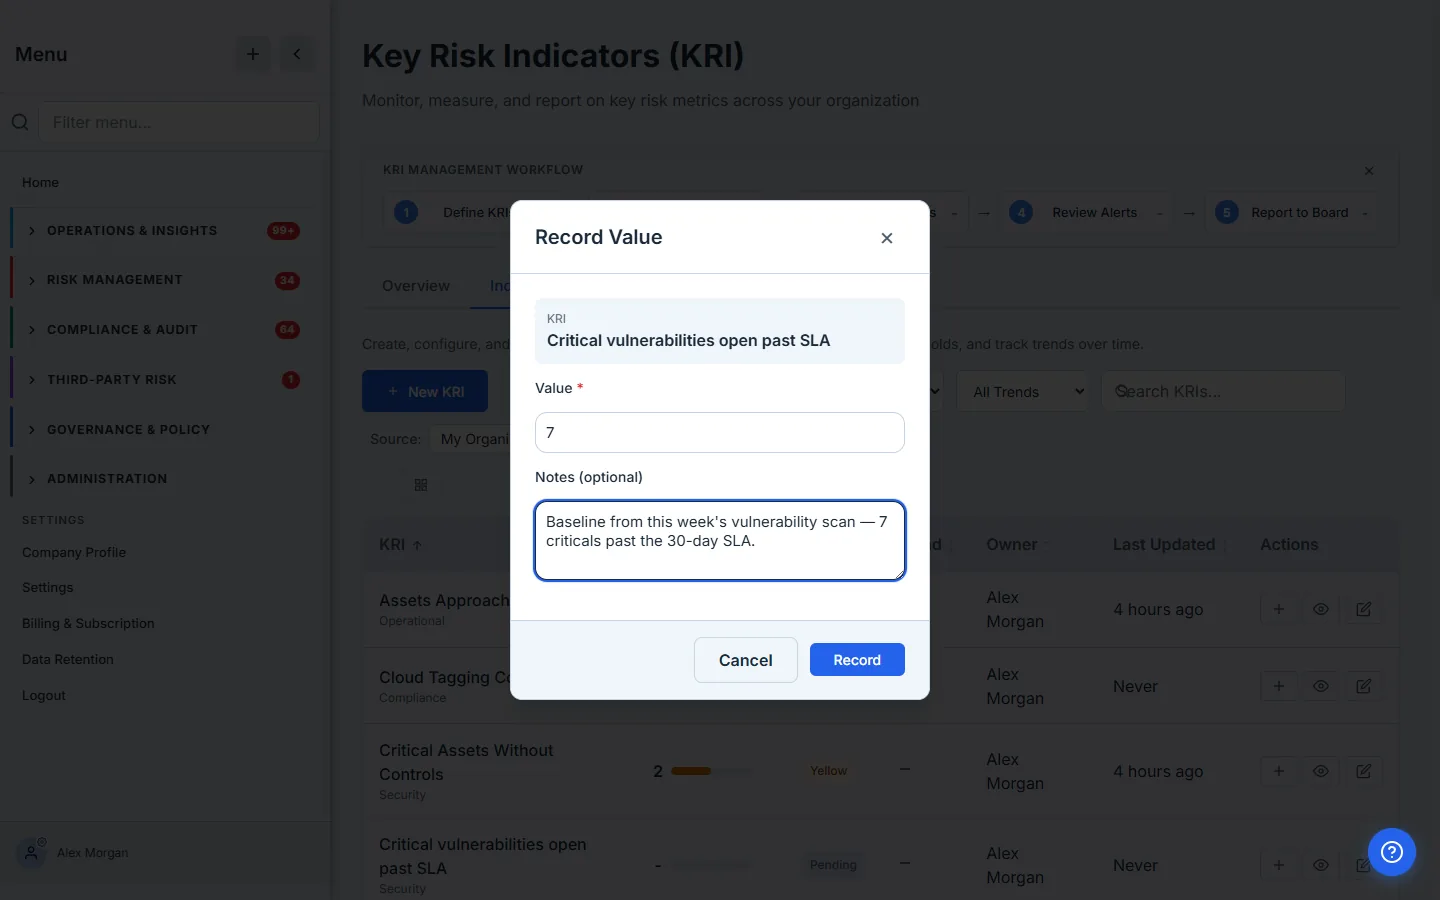
We record our baseline: 7 critical vulnerabilities past SLA, with the note “Baseline from this week’s vulnerability scan.” The moment you click Record, Talarity evaluates the value against the bands (7 ≥ 6 → red), computes the trend against the previous reading, appends the reading to the history (capped at the last 365 so the series never grows unbounded), and — because this crossed the red line — raises a breach alert.
Over the following weeks the team drives the backlog down — 5, then 4, then 2. Each reading is one Record Value click (or an automated sync, Step 5).
Step 4 — Read the indicator in the live list
Back on the Indicators tab, your KRI now carries a current value, a status chip, a trend arrow, and an inline sparkline of its recent readings. Sort by Last Updated to float the freshly-measured indicators to the top.
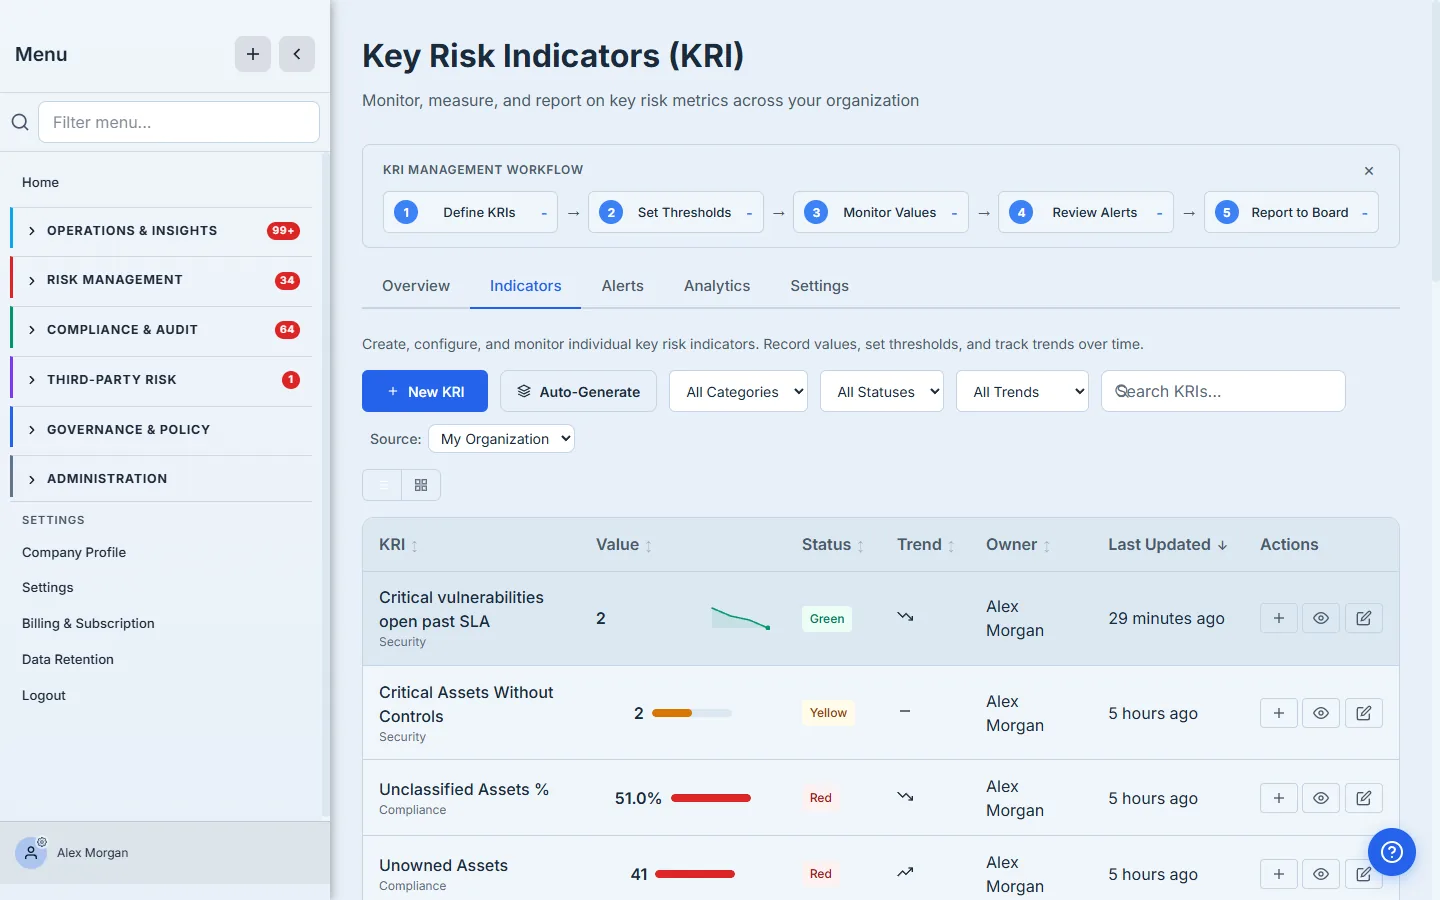
Our indicator reads 2 — green — improving, and the sparkline shows the 7→2 descent at a glance. The list mixes green, yellow, and red across the program so you can triage in one pass: a red Unclassified Assets % and Unowned Assets stand out next to the controls that are holding.
The trend arrow is worth a beat: it points in the numeric direction the value moved (down, here) but is colored by performance — green because, for a lower-is-better KRI, down is good. A lower-is-better KRI whose value rose would show an up arrow colored red. The arrow tells you which way the number went; the color tells you whether that’s good news.
Step 5 — Open the detail panel for the full readout
Click View Details on any indicator for the complete picture: ownership and cadence, the threshold bands, descriptive statistics (mean / min / max / standard deviation) computed across the history, a 90-day trend chart (it fills in as readings accumulate), and the full Recent Values log with every note.
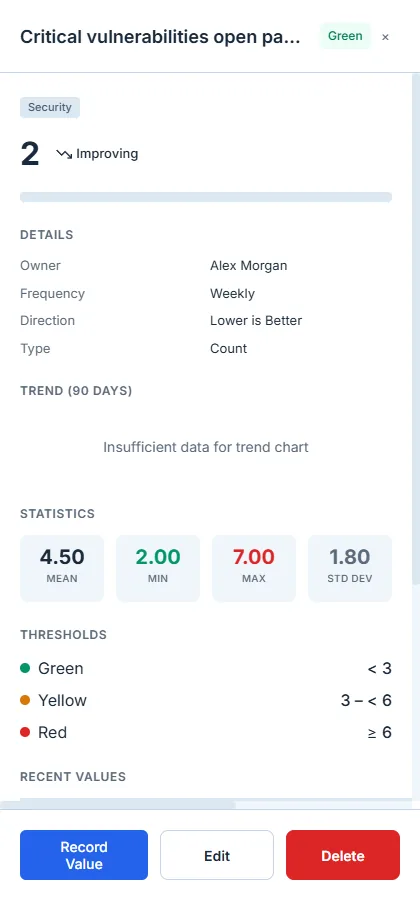
This panel is what an auditor wants: not “we track vulnerabilities,” but the dated series of measurements, the band they were judged against, and the note attached to each reading. It’s the evidence that the control was monitored, which is exactly what ISO 27001 Clause 9.1 and the maturity ladder’s top tier ask for.
Step 6 — Don’t hand-build them all: auto-generate from your data
Defining KRIs one at a time is right for the bespoke ones. For the obvious operational metrics, the Settings tab provisions them from data you already have in Talarity — your Risk Register, Assets, Assessments, Control Library, Vulnerabilities, and Vendors. Pick a source, choose the templates (each ships with sensible default bands), and provision; the metric then syncs on a schedule so the value updates itself.
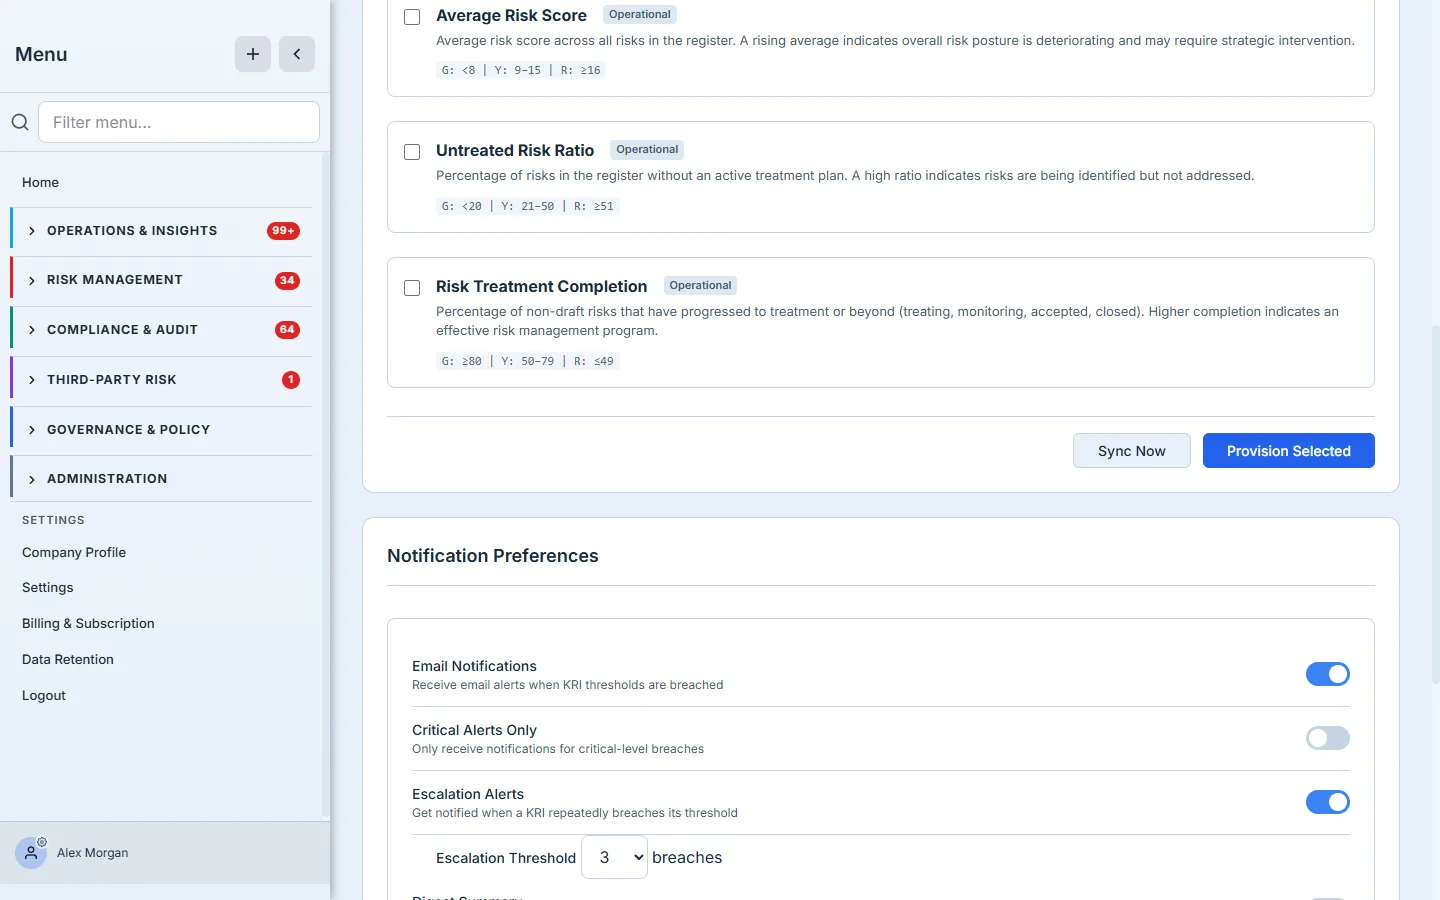
This is the fastest way to a populated, self-updating KRI program: provision the data-driven set in a few clicks, then hand-define the handful that are unique to your organization (like our vuln-SLA indicator).
Step 7 — When a band is crossed, an alert is waiting
The moment a reading lands in the red, Talarity raises a threshold-breach alert. The Alerts tab is the queue — critical and warning counts, response-time metrics, and one card per breach with its value, the band it crossed, and the actions to take.
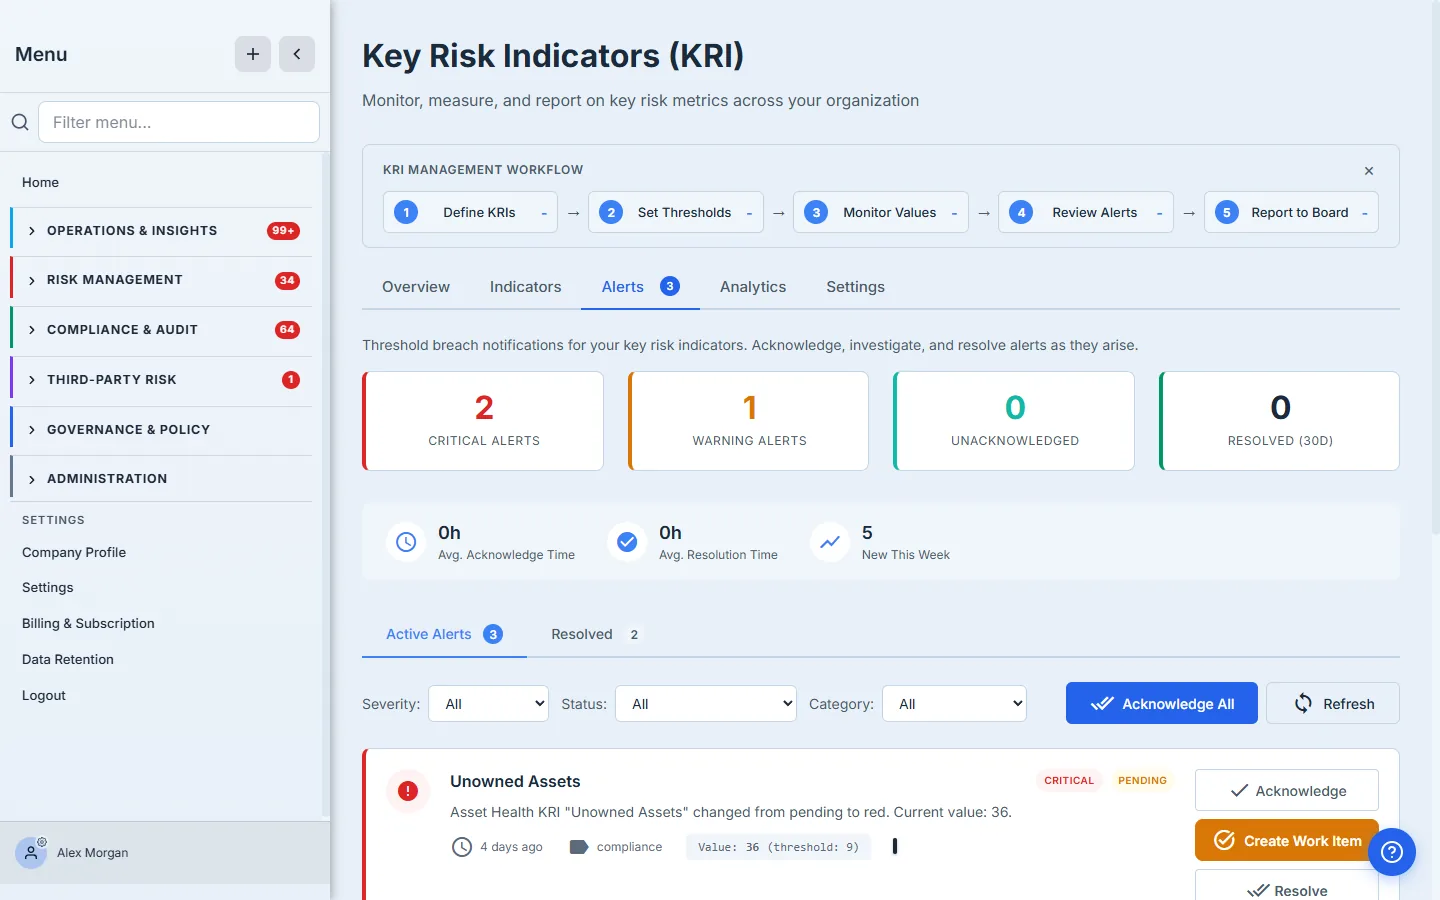
This is where the primer hands off. Defining and measuring a KRI gives you the early-warning signal; turning that signal into action — reviewing the alert, acknowledging it, opening the linked risk, and treating it — is the KRI breach → response workflow, a guide of its own. The point of everything above is to make sure that when the alert fires, it’s measuring the right thing against the right line.
What you walk away with
- A defined KRI with a measurement type, a target direction, and green/yellow/red bands set to your risk appetite.
- A measurement history — dated readings with notes — that recolors the status and draws the trend automatically.
- A detail readout (statistics + bands + the full log) that doubles as monitoring evidence for an auditor.
- A self-updating set of operational KRIs provisioned from your existing Risk Register, Assets, Assessments, Controls, Vulnerabilities, and Vendors.
- A breach alert waiting the instant a value crosses the red line — the on-ramp to the response workflow.
Define your first one this afternoon. Open /app/grc/kri, go to Indicators, click New KRI, and pick a number that moves before the loss does. The first one takes about three minutes; once the bands are set, every reading after that is a single click — or no clicks at all, if you let it sync.