When a security incident hits, the scramble is the easy part — everyone knows to contain it. The hard part is everything around it: tracking it through a defensible lifecycle, measuring how fast you actually detected and recovered, and — the step most teams skip — proving why it happened and that the fix is being done. Talarity’s Incident Management runs each incident from detection through closure and links it to its root-cause analysis, remediation plans, tasks, risks, and evidence, so an incident closes with a record, not just a sigh of relief.
Who’s involved
- Security / SOC — detect, triage, contain, and resolve; record the timeline as it happens.
- Incident commander — owns the lifecycle and the closure decision.
- Risk & compliance — care that every incident has a root cause and corrective actions, with evidence for the auditor.
What’s on the page
Open the Incident Management hub (/app/incidents):
- Program KPIs — Total Incidents, Open, Critical, Average MTTR across the top.
- Filters — status, severity, and category, over the incident register.
- Report Incident — opens a new case.
- Incident case file — the per-incident detail: status lifecycle (fixed-state machine), severity, timeline, 5-Whys root cause, and the remediation / risk / evidence links it spawns.
Step 1 — One queue for every incident
Open Incidents (/app/incidents). Every incident is tracked with a severity, a status across the response lifecycle (Open → Investigating → Contained → Remediation → Resolved → Closed), a priority/SLA, and a category — with portfolio metrics across the top: total, open, critical, and average MTTR.
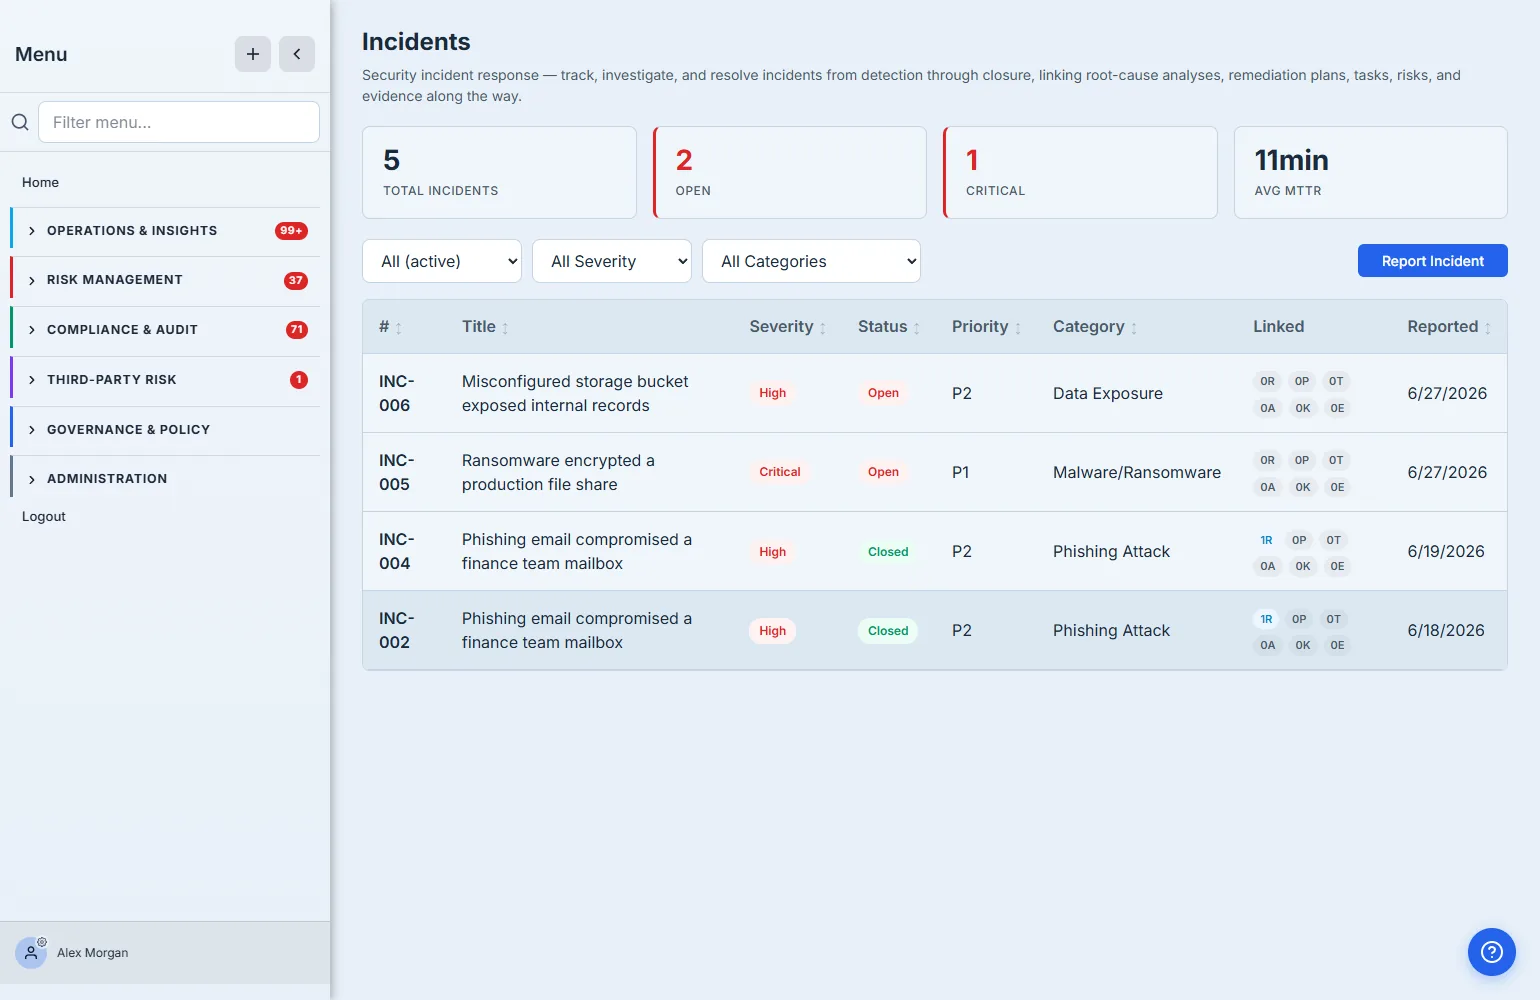
Each row carries little linked-entity badges — root-cause analyses, remediation plans, tasks, assets, risks, evidence — so you can see at a glance which incidents have their follow-through wired up and which are still just a headline.
Step 2 — An incident record, not a ticket
Open an incident and you get the full picture: the description, the lifecycle timeline (reported → detected → contained → resolved → closed), the response metrics (MTTD, MTTC, MTTR in minutes), who it’s assigned to, and a related-entity bar tying it to everything downstream.
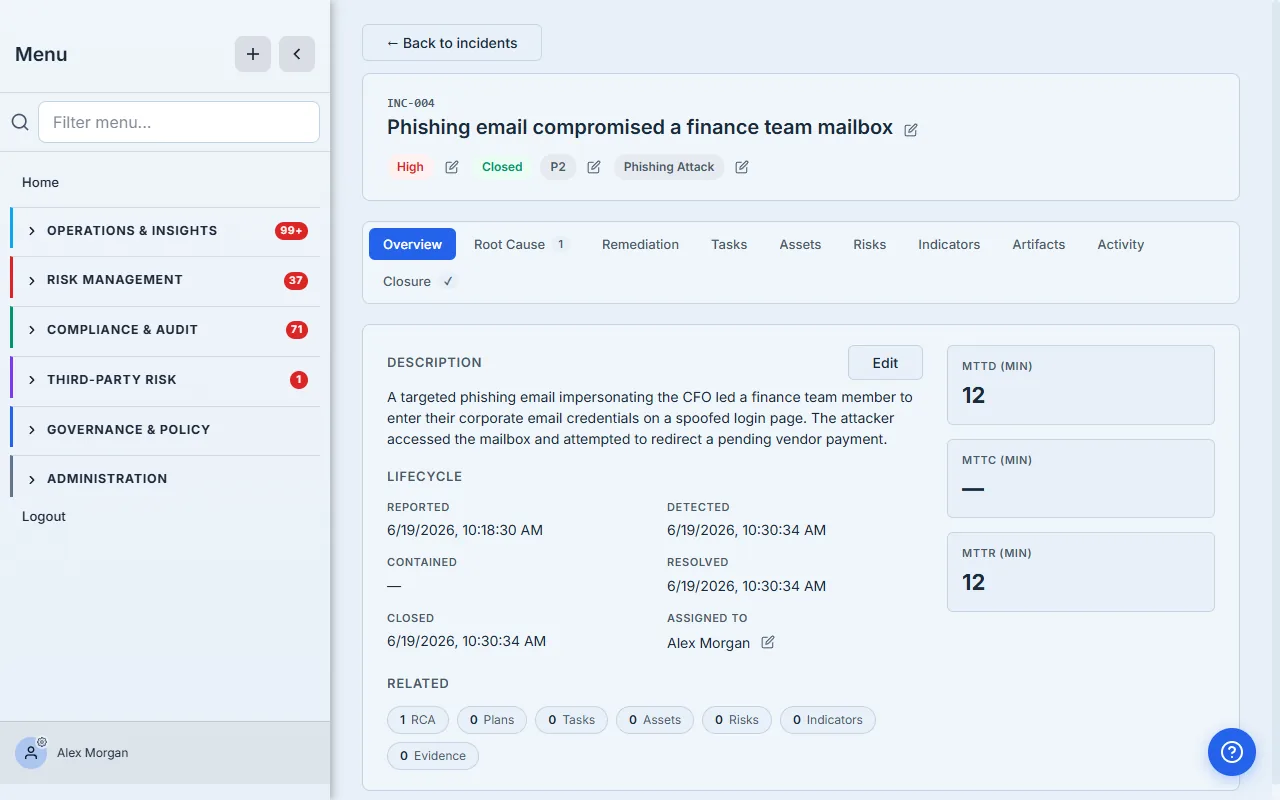
This is the difference between an incident ticket and an incident record. MTTD and MTTR aren’t vanity metrics — they’re how you prove your detection and recovery are improving. And the tabbed linkages (Root Cause, Remediation, Tasks, Assets, Risks, Indicators, Artifacts, Activity, Closure) mean the incident isn’t a dead end: it’s the hub the whole response hangs off.
Step 3 — The step most teams skip: root cause
The Root Cause tab is where an incident stops being a one-off. Each incident links to a structured root-cause analysis — here a 5 Whys analysis (5 of 5 answered), a clear root-cause statement, and the corrective and preventive actions that come out of it.
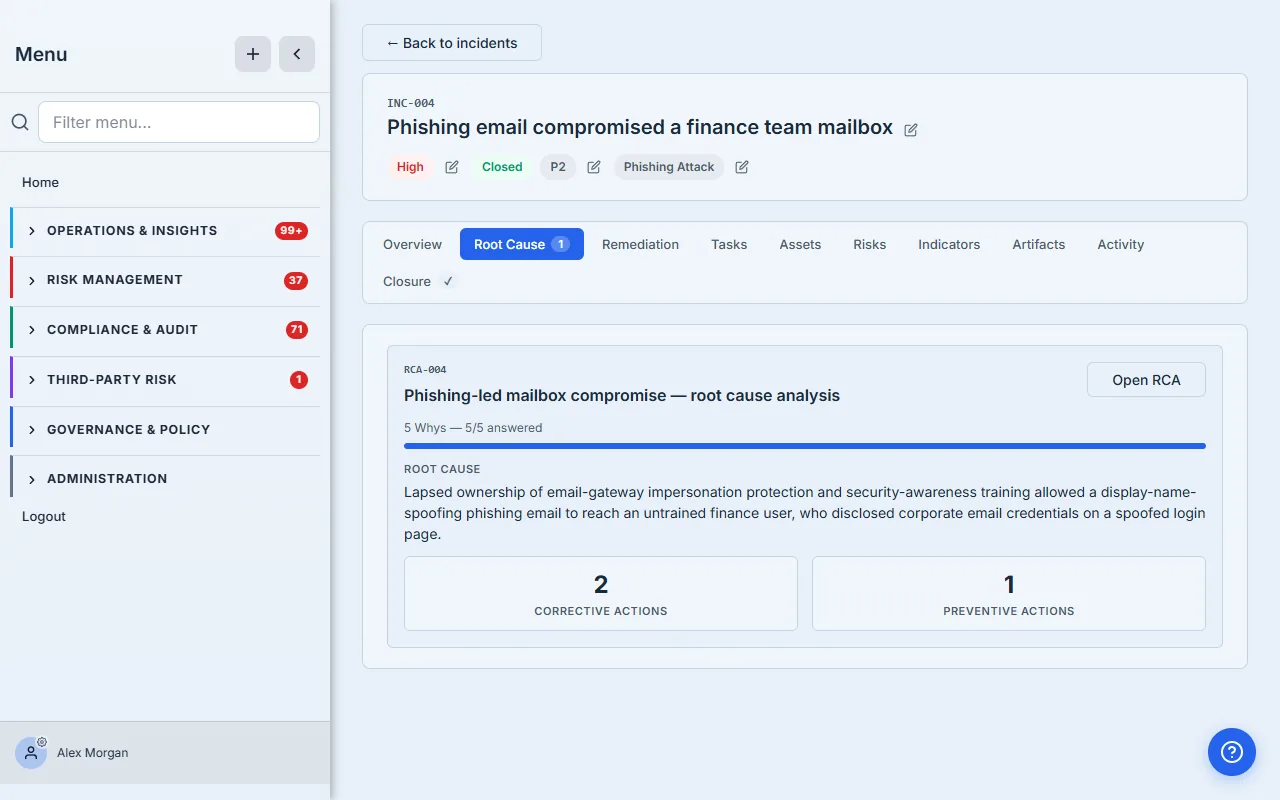
A root cause of “lapsed ownership of impersonation protection and security-awareness training” is actionable — it produces corrective actions (fix this incident’s gaps) and preventive actions (stop the next one). That’s the loop that turns an incident from a bad day into a control improvement, with the corrective actions tracked and the evidence on file.
How the page works
The numbers and the lifecycle aren’t free-form — a few mechanics are worth knowing:
- The lifecycle is a fixed state machine, not a free text field. Each status only offers the transitions that make sense next — Open can go to Investigating or straight to Closed; Investigating can move to Contained, Remediation, Resolved, or Closed. The detail page reads those valid next-states and renders exactly those buttons, so you can’t skip an incident into an impossible state.
- The metrics are stamped as you move, measured from when the incident was reported. When you advance an incident, Talarity records MTTD (at detection), MTTC (at containment), and MTTR (at resolution) as whole minutes elapsed since the Reported timestamp. They’re not typed in — they fall out of the timeline you’re already keeping, which is exactly why an auditor trusts them.
- Avg MTTR is a true portfolio mean. The stat card averages the MTTR of every incident that has one — so it moves as you actually resolve incidents, and it’s the one number that says whether your response is getting faster over time.
- Closing is gated on Resolved. The Close case action only lights up once an incident is Resolved — you can’t close an incident you haven’t actually recovered from. If MTTR was never stamped, closing back-fills it from the reported-to-now span so the record is never blank.
- The badges and the 5 Whys bar are live counts. A row’s linked-entity badges reflect the real attached RCAs / plans / tasks / risks / evidence; the Root Cause tab’s progress bar is answered ÷ total Whys. Both are reading the data, not a status someone set by hand.
How to run an incident end to end
- Report it. Click Report Incident, set the severity, category, and description. The incident lands in the queue as Open with its Reported timestamp set.
- Advance the lifecycle as you work. Use the status buttons on the detail page — Investigating → Contained → Remediation → Resolved — and each transition stamps the matching metric (MTTD / MTTC / MTTR) automatically.
- Wire up the follow-through. From the detail tabs, attach the Root Cause analysis (run the 5 Whys to a root-cause statement), open Remediation plans and Tasks, and link the affected Assets, Risks, Indicators, and Artifacts. The row badges fill in as you go.
- Close it with a reason. Once Resolved, open the Closure tab and close the case — the incident now carries a defensible record (timeline, metrics, root cause, corrective actions) instead of just an “all clear.”
What you walk away with
- A single incident queue — severity, lifecycle status, SLA/priority, and category, with total/open/critical/MTTR metrics across the top.
- A defensible record per incident — lifecycle timeline, MTTD/MTTC/MTTR, assignee, and a closure step.
- The whole chain linked — root-cause analysis, remediation, tasks, risks, and evidence hang off the incident, not in scattered docs.
- Root cause, not just recovery — a 5-Whys analysis with corrective and preventive actions, so each incident improves your controls.
Open /app/incidents, open a resolved one, and read its Root Cause tab. An incident you can answer “why did this happen, and what did we change?” for is an incident your auditor — and your board — will actually accept as closed.