Finding the problem is the easy half. An assessment surfaces a gap, a risk gets scored Critical, an auditor writes up a control deficiency — and then what? The honest answer at most organizations is “a spreadsheet, a couple of owners, and good intentions.” When the auditor comes back and asks “show me what you did about that finding from last quarter,” the scramble begins.
That artifact has a name: a Plan of Action & Milestones — a POA&M. NIST 800-53 control CA-5 requires one; SOC 2 and ISO 27001 both expect documented, tracked remediation. Talarity’s Remediation Planner is that POA&M as live data — every fix you’ve committed to, with an owner, milestones, evidence, a due date, and a closure sign-off, all in one portfolio you can hand to an auditor.
Who’s involved
- Risk / compliance manager — owns the portfolio, prioritises the work, reports progress.
- Plan owners — the people accountable for getting each plan to done.
- Verifier / approver — confirms the work actually closed the gap before the plan is marked complete.
- Auditor — wants the finding, the plan, the evidence, and the date it closed.
What’s on the page
Remediation Planner (/app/remediation) opens on the portfolio:
- Four headline cards — My Plans, Overdue, Active Plans, and the Score Projection Calculator (the estimated risk-posture improvement if a selected set of plans complete).
- Three views of the same plans — Table (triage by priority / status / owner / planned-end / progress / source), Kanban (drag plans across Draft → In Review → Active → Completed), and Timeline (a Gantt of due dates) — plus Priority Distribution and Owner Workload charts.
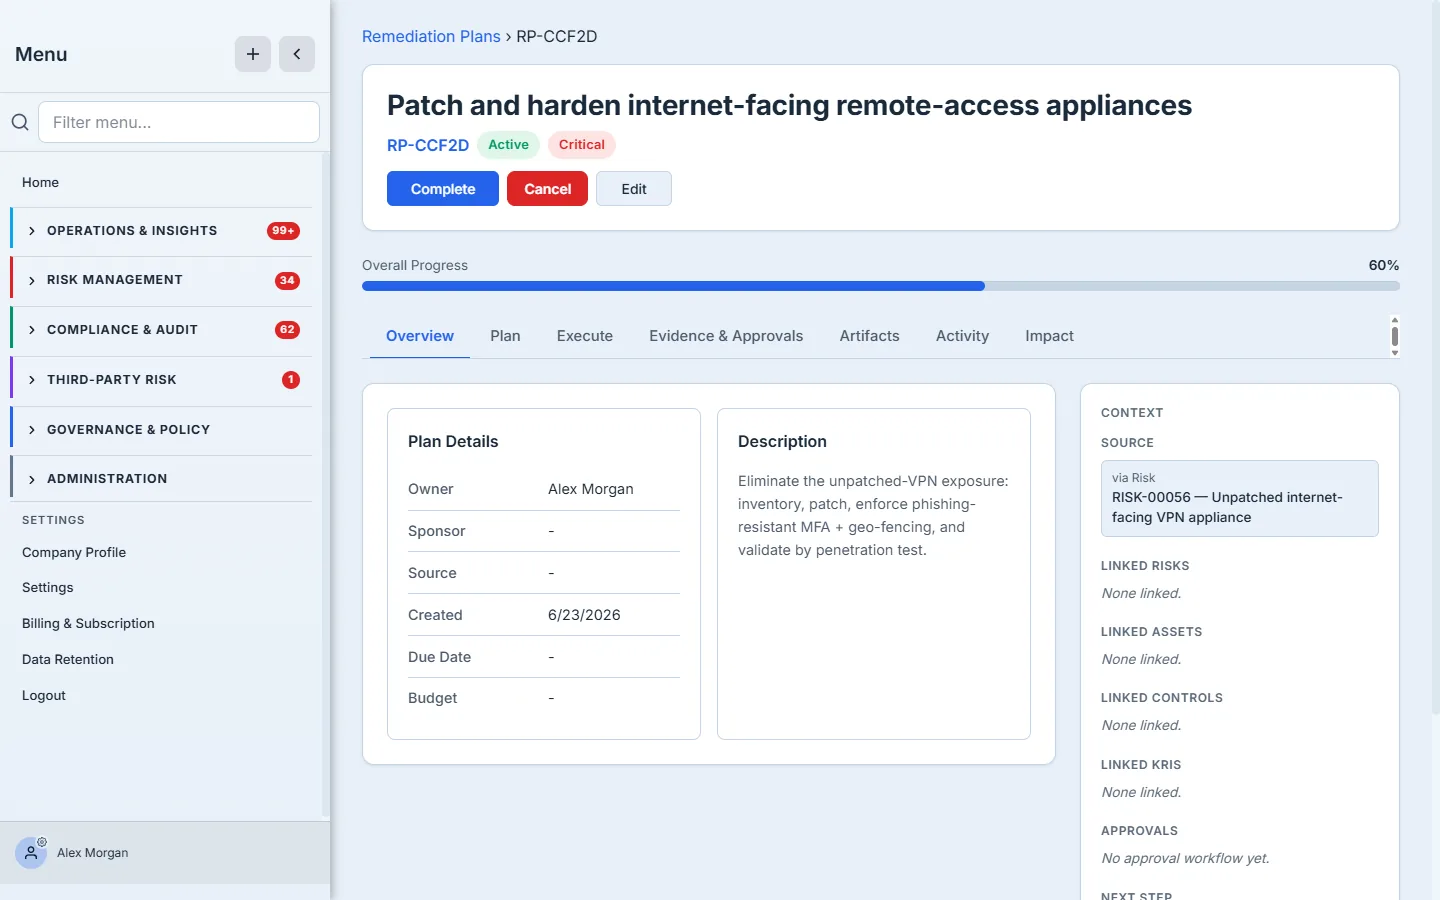
Open a plan and you get its workspace: a status / priority / progress header over a seven-tab layout — Overview (with the plan’s provenance, the finding that created it), the milestone Plan, Execute (the milestones themselves), Evidence & Approvals, Artifacts, Activity, and Impact.
Closure runs in its own Remediation Verification workflow — Verify → Submit for Sign-off → Approve → Review Closures — so the person who does the work isn’t the one who confirms it. The walkthrough below follows a plan from the portfolio through to a verified close.
Step 1 — The portfolio: your command center
Open Remediation Planner (/app/remediation). The top of the page is the portfolio at a glance: My Plans, Overdue, Active Plans, and a Score Projection Calculator that estimates how your risk posture improves as plans complete. Below that, a filterable table — priority, status, owner, planned end date, progress, and source — so you can triage by what’s overdue, what’s critical, or whose plate is full.
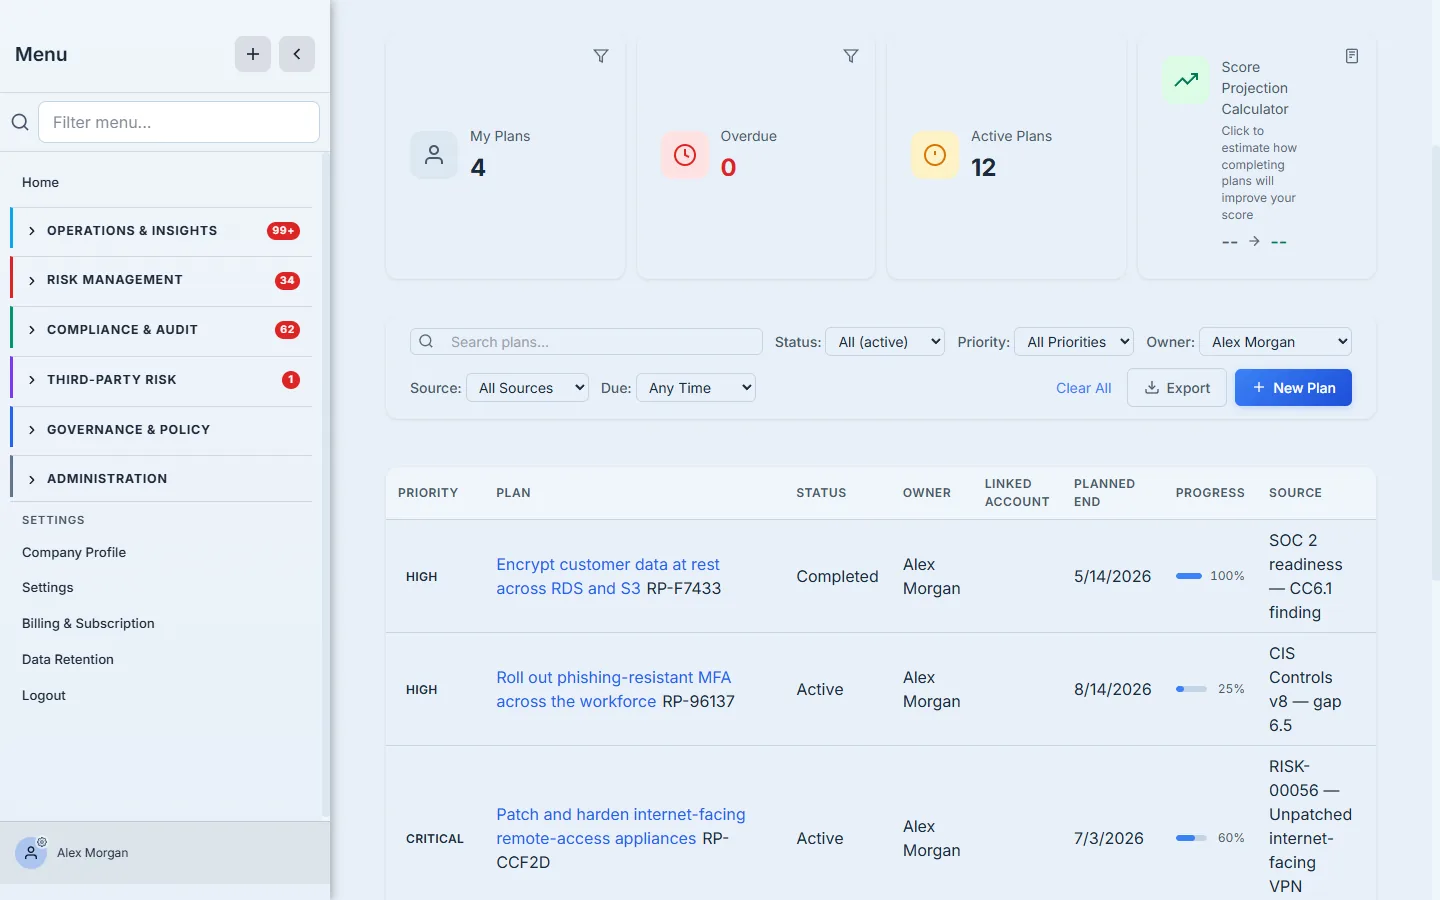
The same data renders three ways — Table for triage, Kanban to drag plans across stages (Draft → In Review → Active → Completed), and Timeline for a Gantt of due dates — plus Priority Distribution and Owner Workload charts so you can see concentration and over-allocation at a glance. Every plan carries its source, so the portfolio is also a traceability map back to the assessment, risk, audit finding, or incident that created the work.
The Score Projection Calculator is the move most teams don’t expect from a remediation tool: select a set of plans and it estimates the risk-score improvement if you complete them — so you can prioritise by return on effort, not just by who shouted loudest.
Step 2 — Where plans come from
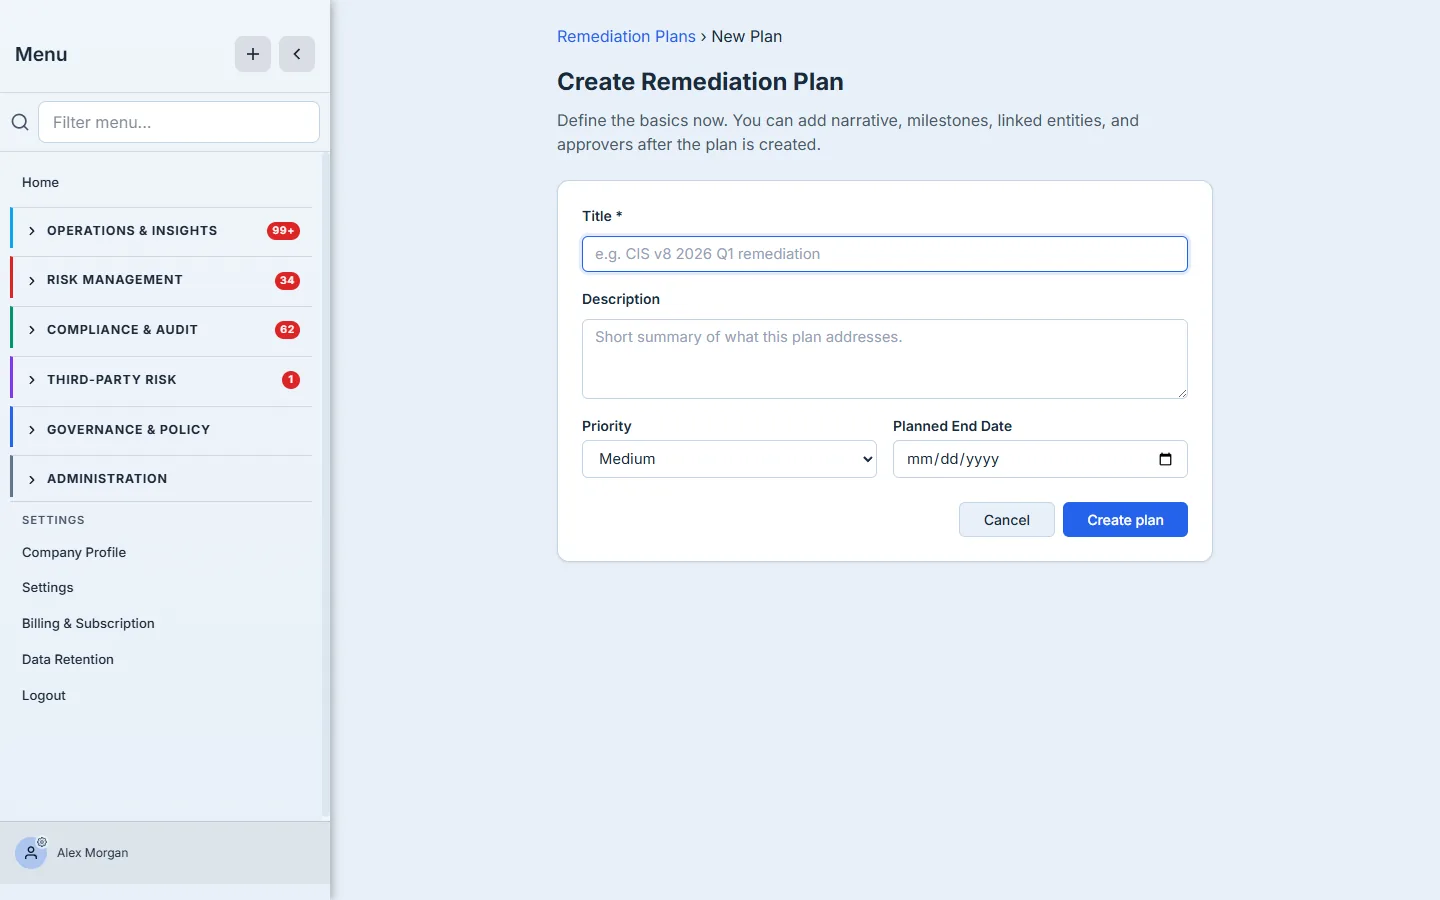
A remediation plan is rarely typed from scratch. It’s generated from the thing that found the problem — an assessment gap, a risk register entry, an audit finding, a control-test failure, a KRI breach, or an incident. Each carries its origin forward as the plan’s source, so closing the plan closes the loop on the finding. When you do create one directly, New Plan asks for the basics — title, description, priority, and a target date — and lets you add narrative, milestones, linked entities, and approvers once it exists.
Step 3 — A plan up close
Open a plan and you get its workspace. The header carries the status, priority, and overall progress; the tabs split the plan into Overview, the milestone Plan, Execute, Evidence & Approvals, Artifacts, Activity, and Impact. The Overview shows the plan’s provenance — here the plan was created via Risk RISK-00056 (Unpatched internet-facing VPN appliance) — so anyone reading it knows exactly which exposure it answers.
Step 4 — Milestones and evidence: the “M” in POA&M
A plan is only as real as its milestones. The Execute tab breaks the work into ordered milestones, each with an owner, a due date, and evidence requirements. A milestone can’t be marked complete until its required evidence is attached — that’s the gate that turns “we said we’d do it” into “here’s proof we did.” As milestones complete, the plan’s progress advances automatically.
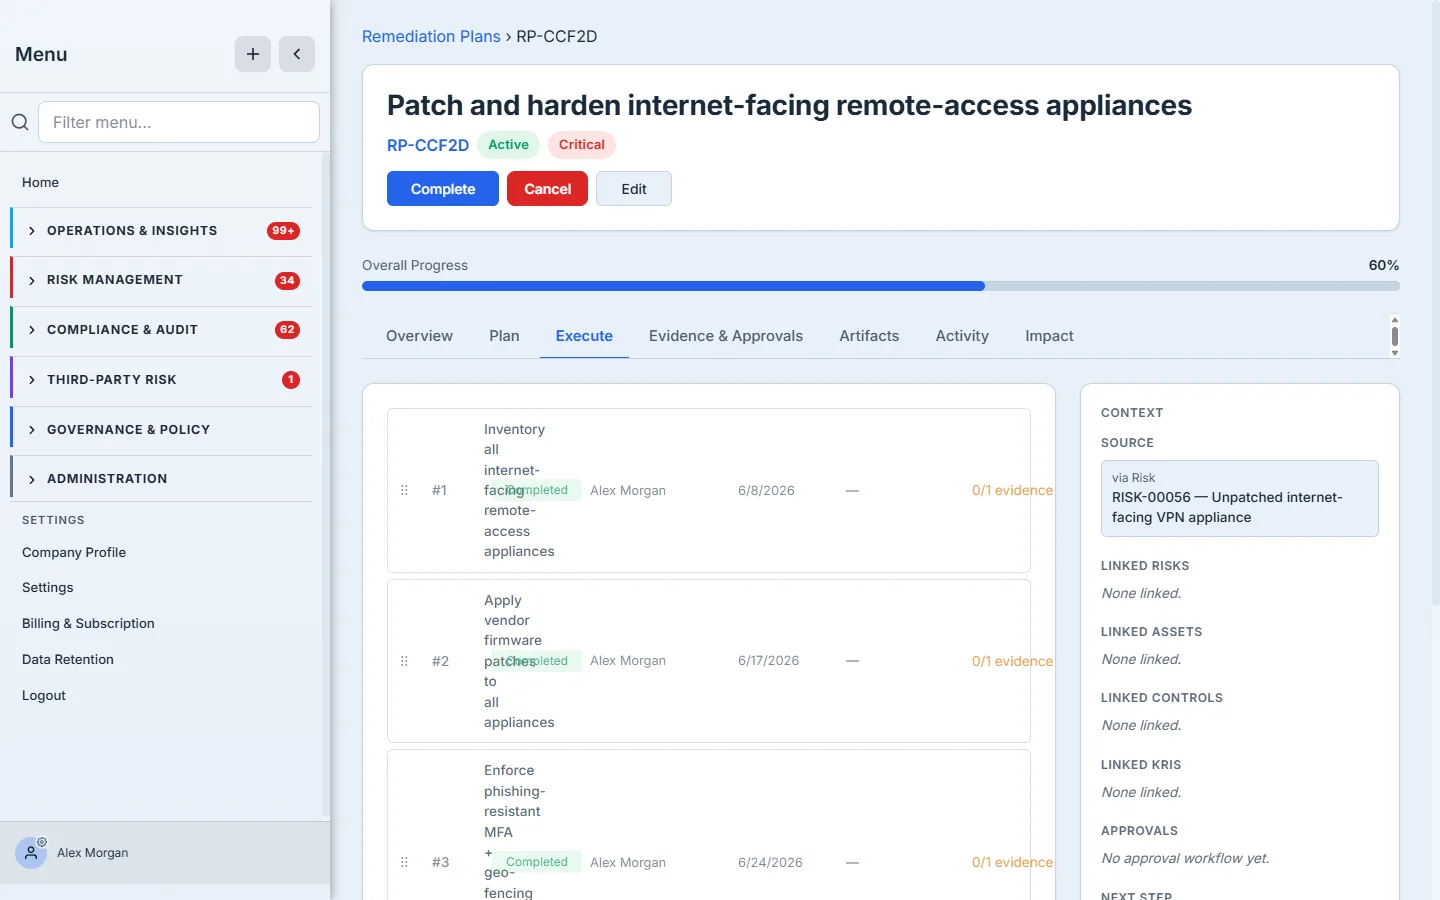
Evidence-gated milestones are the difference between a status report and an audit artifact. The progress bar isn’t someone’s optimistic guess — it’s the count of milestones that cleared their evidence requirement.
Step 5 — Verify and close
A plan owner saying “done” isn’t closure. The Remediation Verification view runs the last mile as its own workflow: Verify Remediations → Submit for Sign-off → Approve Items → Review Closures. Completed work lands in a verification queue, an independent verifier confirms the gap is actually closed, and only then does the plan close — with the sign-off recorded. The dashboard tracks what’s pending verification, awaiting sign-off, and closed in the last 30 days.
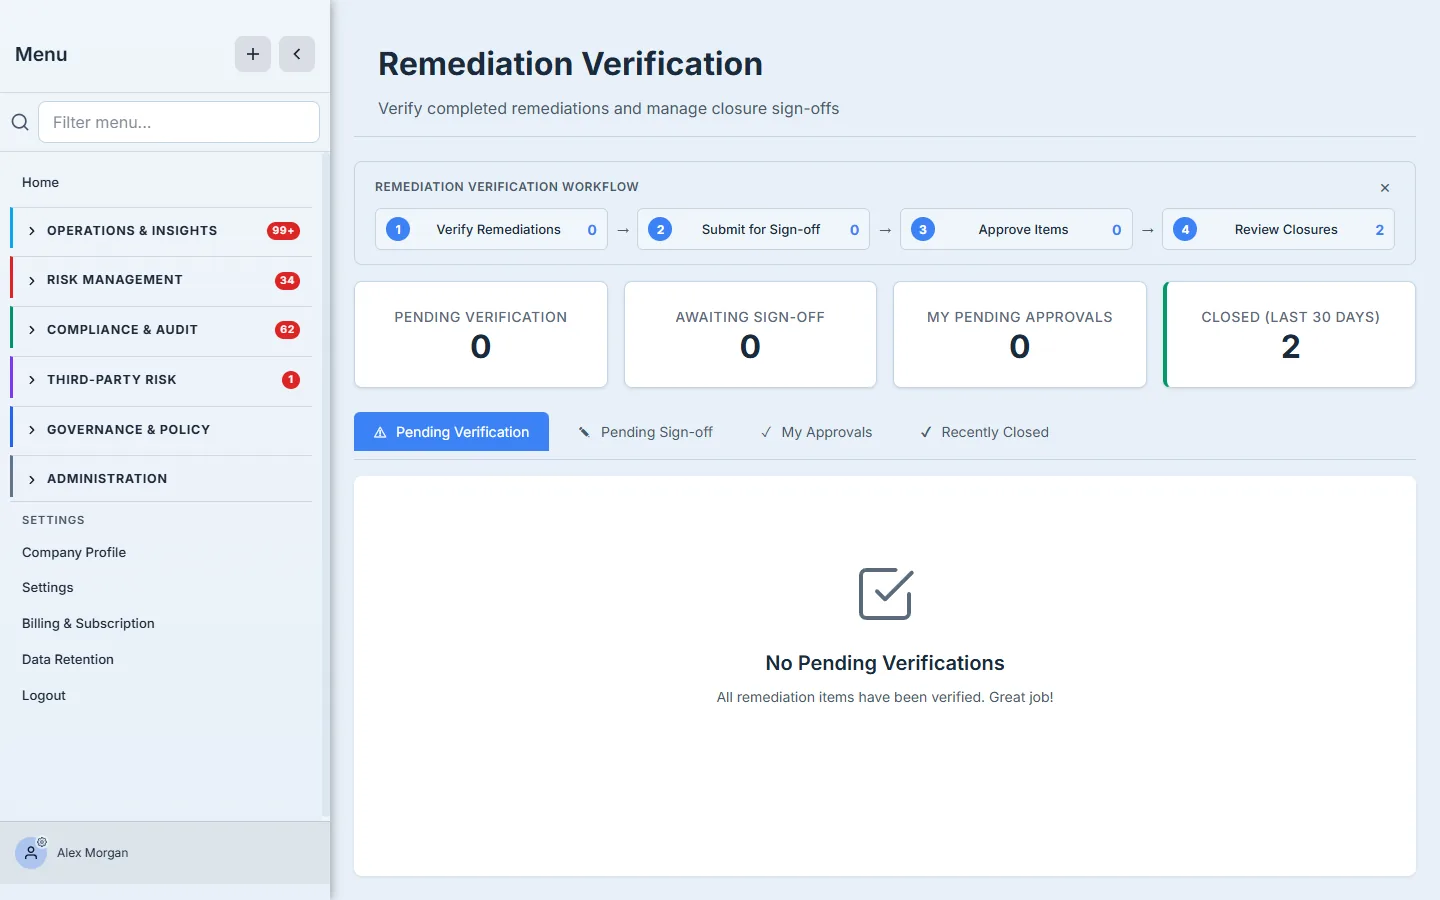
That separation — the person who does the work isn’t the person who confirms it’s closed — is exactly what an auditor looks for. It’s also what stops a portfolio from quietly filling up with “completed” plans that didn’t actually fix anything.
What you walk away with
- A POA&M as live data — every committed fix with an owner, milestones, a due date, and a source, instead of a spreadsheet you rebuild at audit time.
- Evidence-gated progress — milestones that can’t close without proof, so the progress bar means something.
- Verified closure — an independent sign-off step that separates “marked done” from “actually fixed.”
- Prioritisation by impact — a score projection that ranks plans by the risk reduction they’d buy.
Open Risk & Resilience → Work Items, on the Remediation Planner tab, take your oldest open finding, and turn it into a plan with three milestones and an owner. The next time an auditor asks what you did about it, the answer is a link — not a scramble.