A heat map says a risk is “High.” A board member asks the only question that matters: how much, and how likely? Qualitative ratings can’t answer that — they’re colored squares, not decisions. Talarity’s Quantified Risk (FAIR) module models risk scenarios with the FAIR methodology (Factor Analysis of Information Risk) and Monte Carlo simulation to produce what executives actually budget against: dollar-value loss estimates, the probability of an incident this year, and exposure projected over time.
Who’s involved
- CISO / CRO — needs to express cyber risk in dollars to justify spend and report to the board.
- Risk analysts — model the scenarios: threat frequency, vulnerability, loss magnitude.
- Executives / board — want one number (“expected annual loss”) and a probability, not a 5×5 grid.
What’s on the page
Open Quantified Risk (FAIR) (/app/risk/quantified):
- The workflow strip — a live tracker across Create Scenario → Configure FAIR → Simulate → Treat → Govern, each step showing how many scenarios have reached it.
- Summary stats — Total scenarios, Simulated, and Avg ALE (P90).
- The scenarios table — one row per modeled event with its simulated ALE (P90) / ALE (P50) / Mean ALE and last-simulated date.
- Seven tabs — Dashboard, Scenarios, and Pending Approvals are always present; Configure, Results, Treatments, and Governance appear once you select a scenario (they act on that one model).
- The Dashboard — the board roll-up: probability of an incident this year, expected annual loss, severity bands, an exposure waterfall (inherent vs. residual), and multi-year projections.
Step 1 — A library of quantified scenarios
Open Quantified Risk (FAIR) (/app/risk/quantified). Each scenario is a modeled risk event with simulated dollar outputs — ALE (P90), ALE (P50), and Mean ALE (Annualized Loss Expectancy at different confidence levels). The workflow strip — Create Scenario → Configure FAIR → Simulate → Treat → Govern — is the lifecycle each scenario moves through.
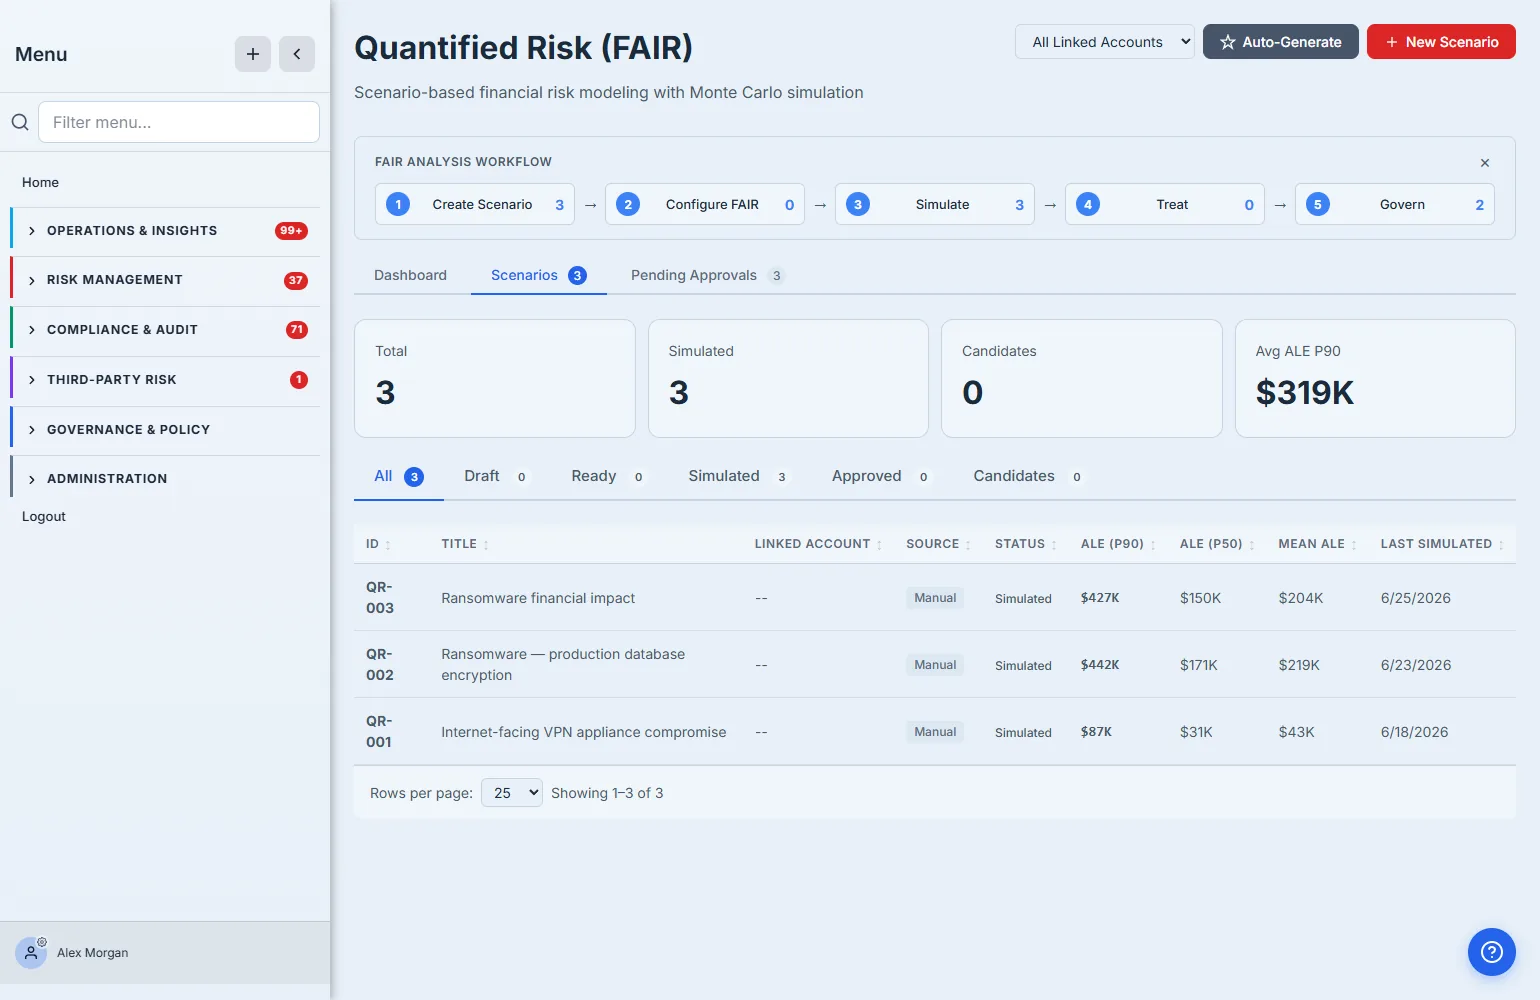
The point: every scenario carries a dollar figure, not a label. “Ransomware — production database encryption” isn’t “High,” it’s a $442K P90 annualized loss expectancy — a number a CFO can reason about.
Step 2 — Model a scenario the FAIR way
Click New Scenario and you start from the methodology itself: a scenario models a specific risk event by defining threat frequency, vulnerability, and loss magnitude, then running a Monte Carlo simulation to turn those ranges into a distribution of dollar outcomes. You can start blank or from a template for common attack patterns.
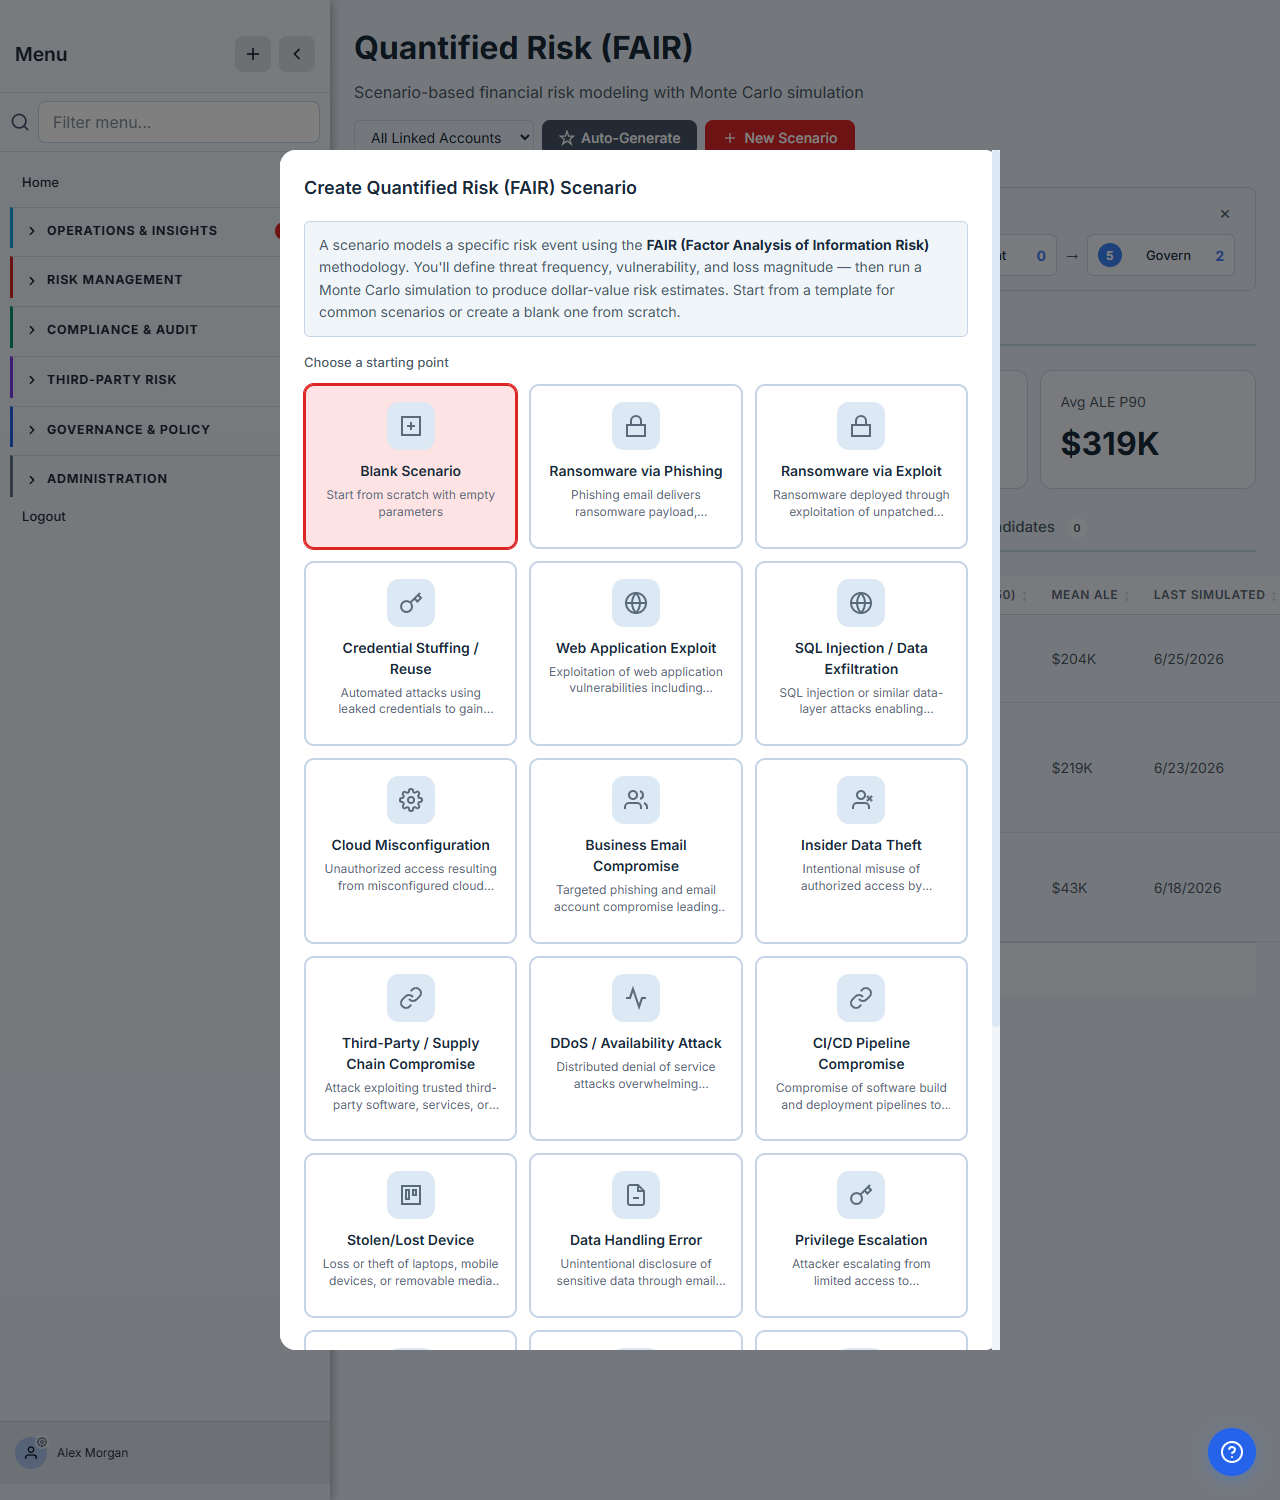
This is what makes the output defensible: you’re not guessing a single number, you’re describing the ranges (how often, how bad) and letting the simulation — 100,000 iterations per scenario — produce the probability distribution. The template library encodes common attack patterns so an analyst isn’t starting from a blank statistical model.
Step 3 — Exposure a board can act on
The Dashboard rolls every scenario into the numbers an executive actually uses. Not a grid — a probability, an expected loss, and a projection.
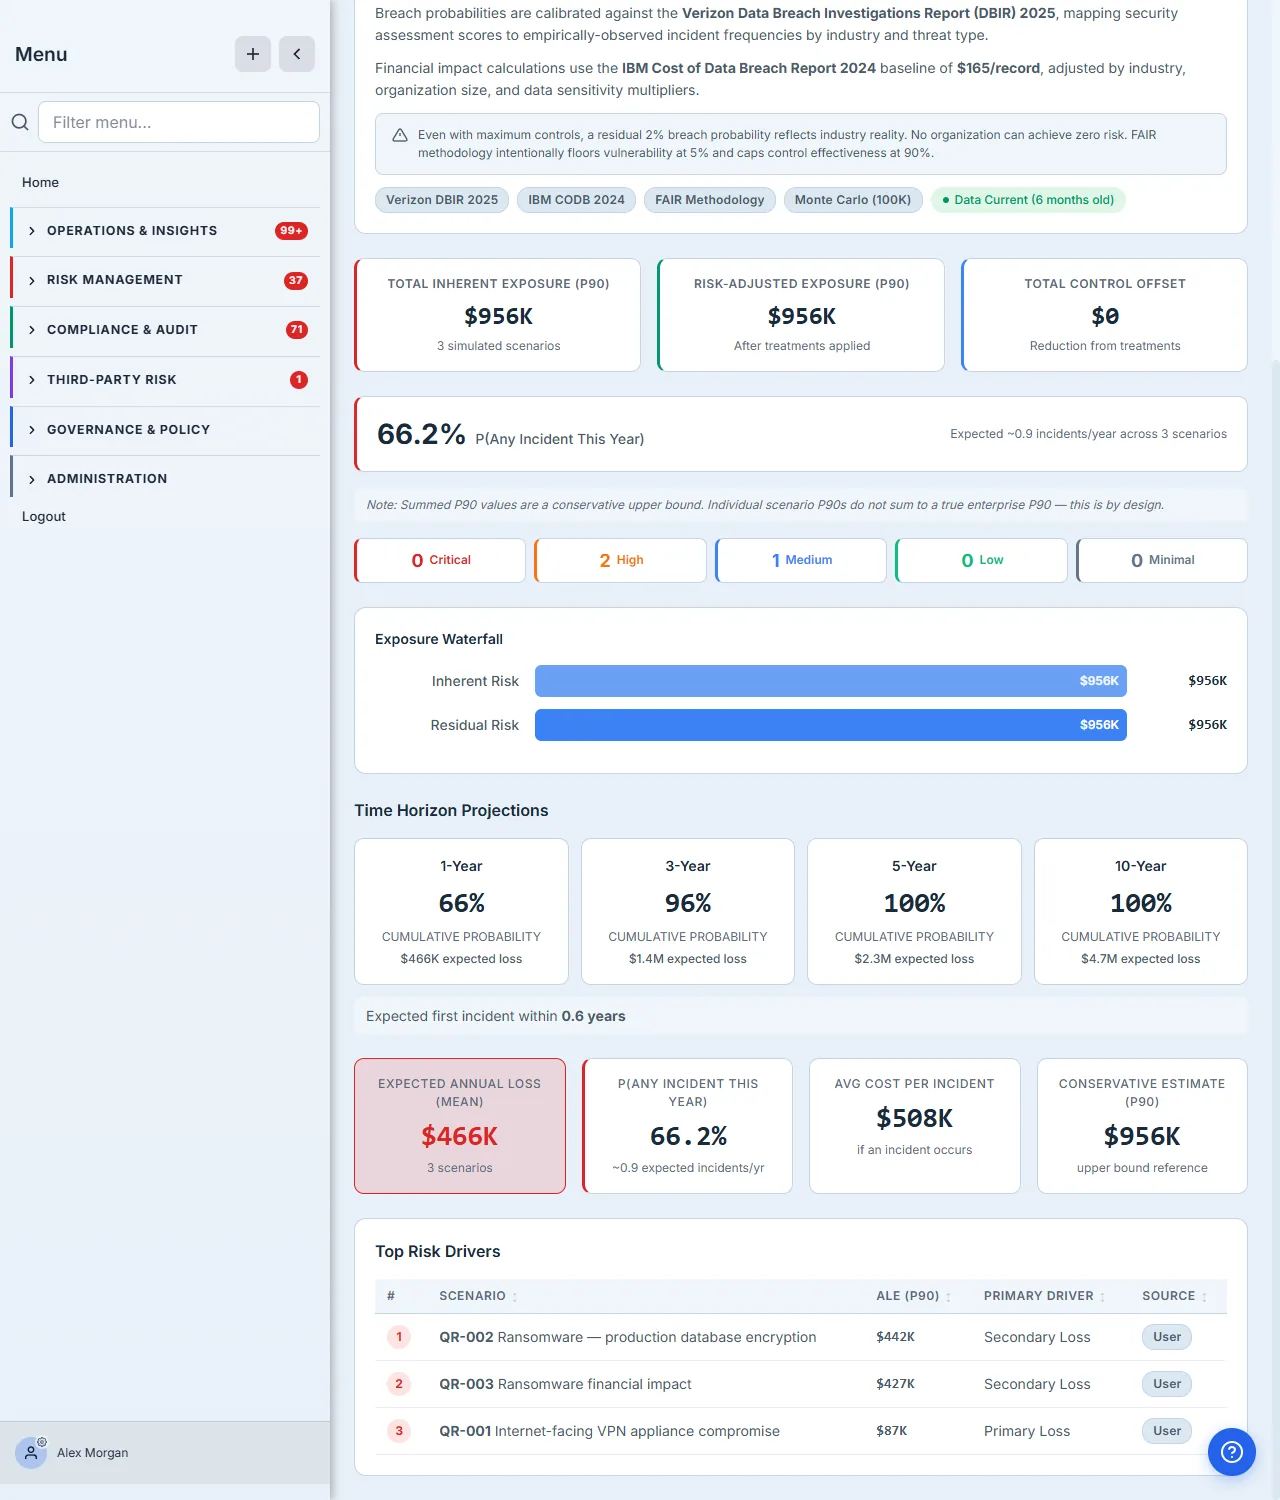
This is the slide that ends the “is it High or Critical?” argument: a 66% probability of an incident this year, an expected annual loss of $466K, and a 10-year projected exposure of $4.7M — with an honest note that summed P90s are a conservative upper bound, not a true enterprise P90. The severity bands are derived from each scenario’s dollar exposure, and the exposure waterfall shows inherent vs. residual risk, so the value of your controls (the Treat step) shows up in dollars too.
How the page works
The module is organized as a per-scenario lifecycle, and the page enforces it:
- The page has seven tabs, four of them scenario-scoped. Dashboard, Scenarios, and Pending Approvals are always there; Configure, Results, Treatments, and Governance only appear once you’ve selected a scenario — because they act on that model, not the portfolio. The workflow strip up top (Configure FAIR → Simulate → Treat → Govern) is a live tracker: each step shows a running count of how many scenarios have reached it.
- Configure gates Simulate with a readiness checklist. The Configure tab is where you set the FAIR factors (threat frequency, vulnerability, loss magnitude) as ranges; a readiness checklist tells you what’s still missing, and you don’t get a meaningful simulation until the inputs are complete. Garbage-in is caught before it becomes a confident-looking number.
- The dollar outputs are percentiles of a distribution, not point estimates. Simulate runs the Monte Carlo and the Results tab reports the loss distribution as Mean ALE, ALE (P50) (the median year), and ALE (P90) (a bad-but-plausible year). That’s why one scenario can show three different dollar figures — they’re three points on the same curve.
- Treatments are modeled in dollars, inherent vs. residual. The Treatments tab lets you add a control and compare the scenario with and without it, so a proposed investment shows up as a reduction in residual ALE — the exposure waterfall on the dashboard is the portfolio roll-up of that inherent-minus-residual gap.
- Governance makes a scenario auditable. Approval, versioning, and a review cadence live on the Governance tab, so a quantified model carries the same sign-off trail as a policy — an auditor can see who approved the numbers and when they’re next due for review.
How to quantify a scenario
- Create the scenario. Click New Scenario — start blank or from an attack-pattern template (ransomware, BEC, credential stuffing, …).
- Configure the FAIR factors. On the Configure tab, fill the frequency, vulnerability, and loss-magnitude ranges until the readiness checklist clears.
- Simulate. Run the Monte Carlo; read the Results tab for Mean / P50 / P90 ALE.
- Treat. On Treatments, add the controls you’re considering and compare residual vs. inherent exposure in dollars.
- Govern, then read the Dashboard. Send the scenario through approval on Governance, then open the Dashboard for the board-ready roll-up: probability of an incident this year, expected annual loss, and the multi-year projection.
What you walk away with
- Risk in dollars, not colors — every scenario carries an annualized loss expectancy at P50/P90, not a “High/Medium/Low” label.
- A defensible method — FAIR factors (frequency × magnitude) plus Monte Carlo simulation, not a single guessed number.
- Templates for common attacks — ransomware, credential stuffing, web-app exploit, data exfiltration, BEC, insider theft — so modeling starts from a pattern, not a blank page.
- A board-ready number — probability of an incident this year, expected annual loss, and multi-year exposure projections.
Open /app/risk/quantified, model one scenario, and run the simulation. The next time someone asks whether a risk is “High,” the answer is a dollar figure and a probability — the language the budget is actually written in.