Every risk framework is really one instruction repeated: manage risk, don’t just record it. ISO 31000 builds its whole model on a lifecycle — identification, analysis, evaluation, treatment, monitoring. SOC 2 CC3.1–CC3.4 expect you to identify risks to your objectives and decide what to do about each. The NIST Risk Management Framework turns the same loop into a federal mandate. None of them is satisfied by a spreadsheet row that says “ransomware — high.”
The gap most teams live in is the distance between “we know that’s a risk” and “here’s what we did about it, and here’s what it would cost us.” The risk gets logged, scored on a gut feeling, and then sits — until an auditor asks for the treatment decision, or a board member asks for the dollar exposure, and neither has an answer anyone can defend. Talarity closes that gap on a single record: a risk you identify, score (inherent and residual), treat with a recorded strategy, and — when the stakes justify it — quantify into a real loss distribution with FAIR. One lifecycle, one audit trail, one number.
Who’s involved
- Risk owner — logs the risk, sets likelihood and impact, and owns it through to closure.
- Risk manager / CRO — runs the register, prioritises by score, decides treat-vs-accept, and quantifies the ones that warrant a dollar figure.
- Control owners — the people whose verified controls pull residual risk down below inherent.
- Auditor / board — reads the register, the treatment decisions, and the FAIR output: what you found, what you chose, and what it would cost.
What’s on the page
Open the Risk Register (/app/risks) — the portfolio view plus the per-risk case file:
- Register table + KPIs — every risk with its inherent and residual score, status, and owner; summary tiles up top.
- New Risk modal — two doors: author one by hand, or generate from completed assessments.
- Scoring — inherent vs. residual (likelihood × impact).
- Treatment — the four strategies (mitigate / accept / transfer / avoid), each a recorded decision.
- Linked controls — the verified controls that earn the residual drop.
Step 1 — Open the register and read the portfolio
Open Risk Register (/app/risks). This is the portfolio view: stat cards across the top — Total Risks, Critical / High, Overdue Reviews, Accepted — over a colour-coded risk-level distribution bar, then a filterable, sortable table. Every column that matters for triage is there: score, level, status, review due (with an overdue flag), and ALE (P90) — the dollar figure that appears once a risk has been quantified.
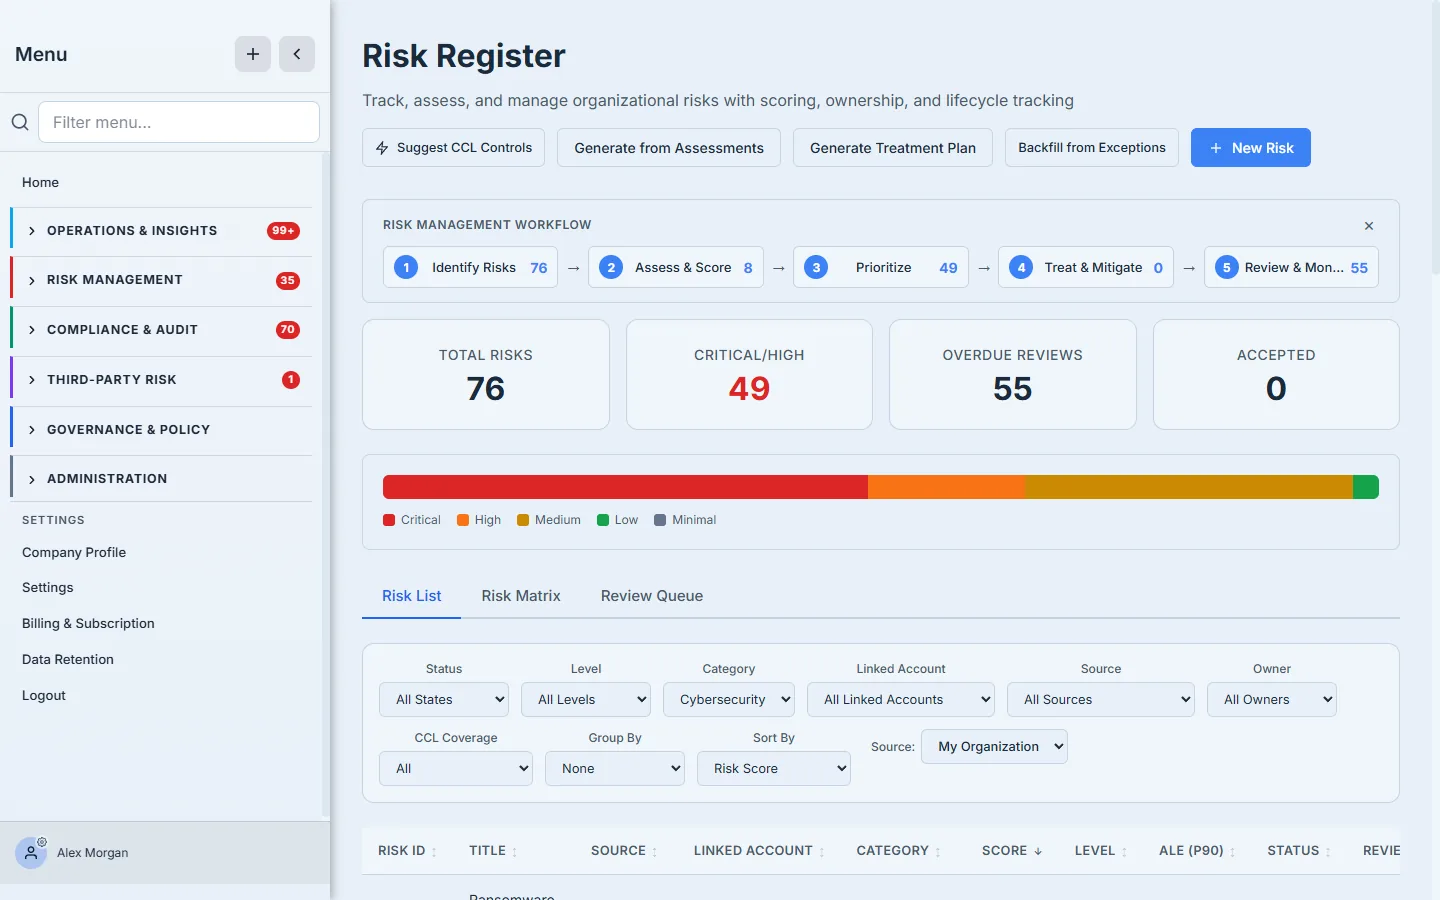
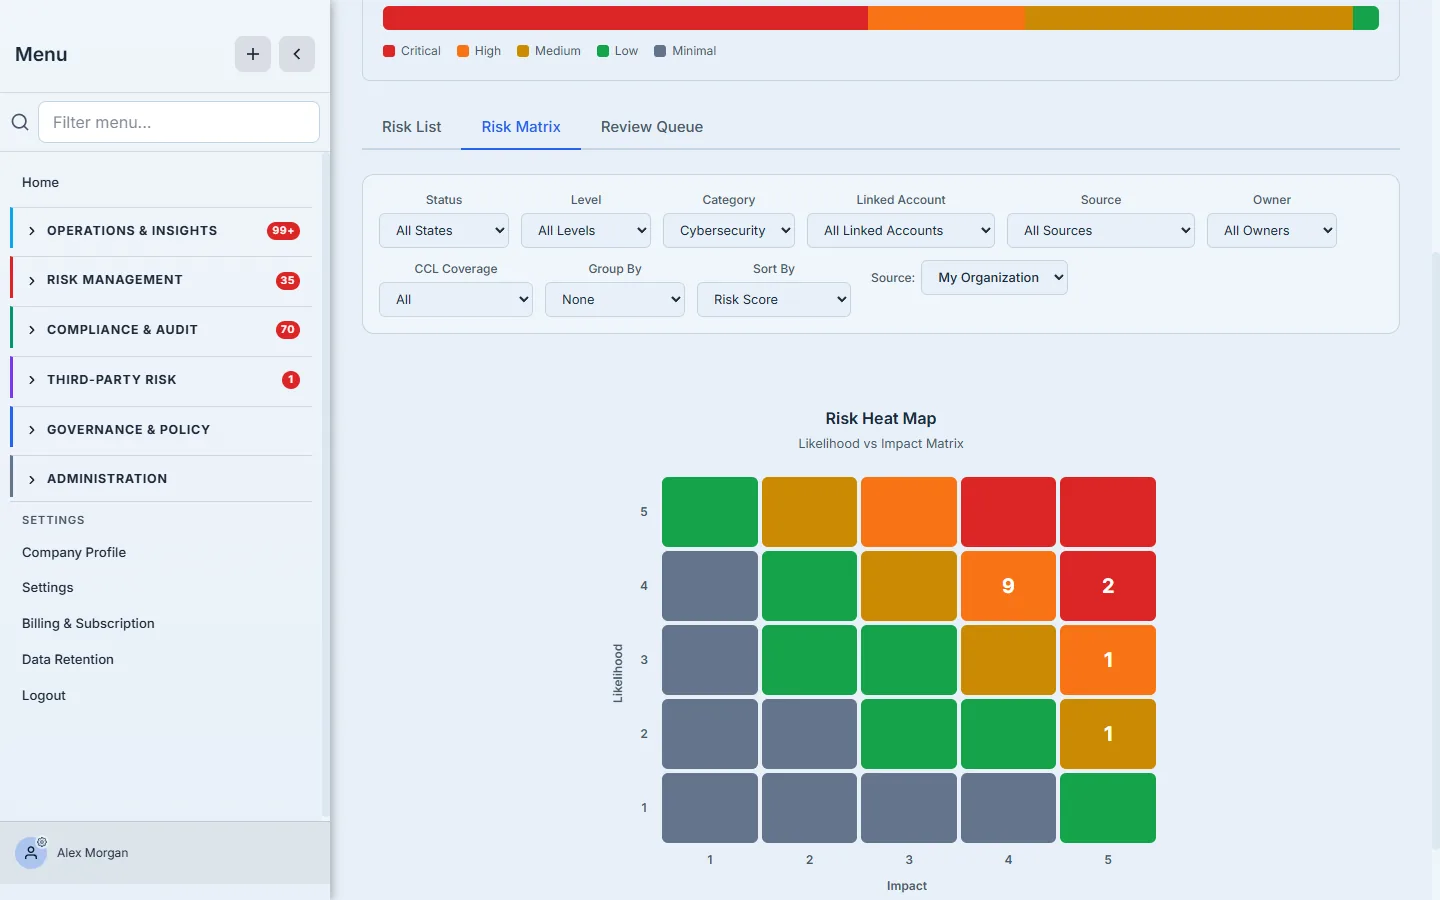
The filter bar is built for “show me the risks that need me right now”: status, level, category, owner, CCL coverage (has controls / no controls / unmitigated), plus group-by and sort. Three tabs sit above the table — List, Matrix (the likelihood × impact heat map), and Review Queue (overdue / upcoming / unscheduled).

The workflow guide at the top isn’t decoration — each step carries a live count (how many risks are unassessed, how many critical, how many overdue for review), so the register doubles as a to-do list for the program.
Step 2 — Create the risk: two doors
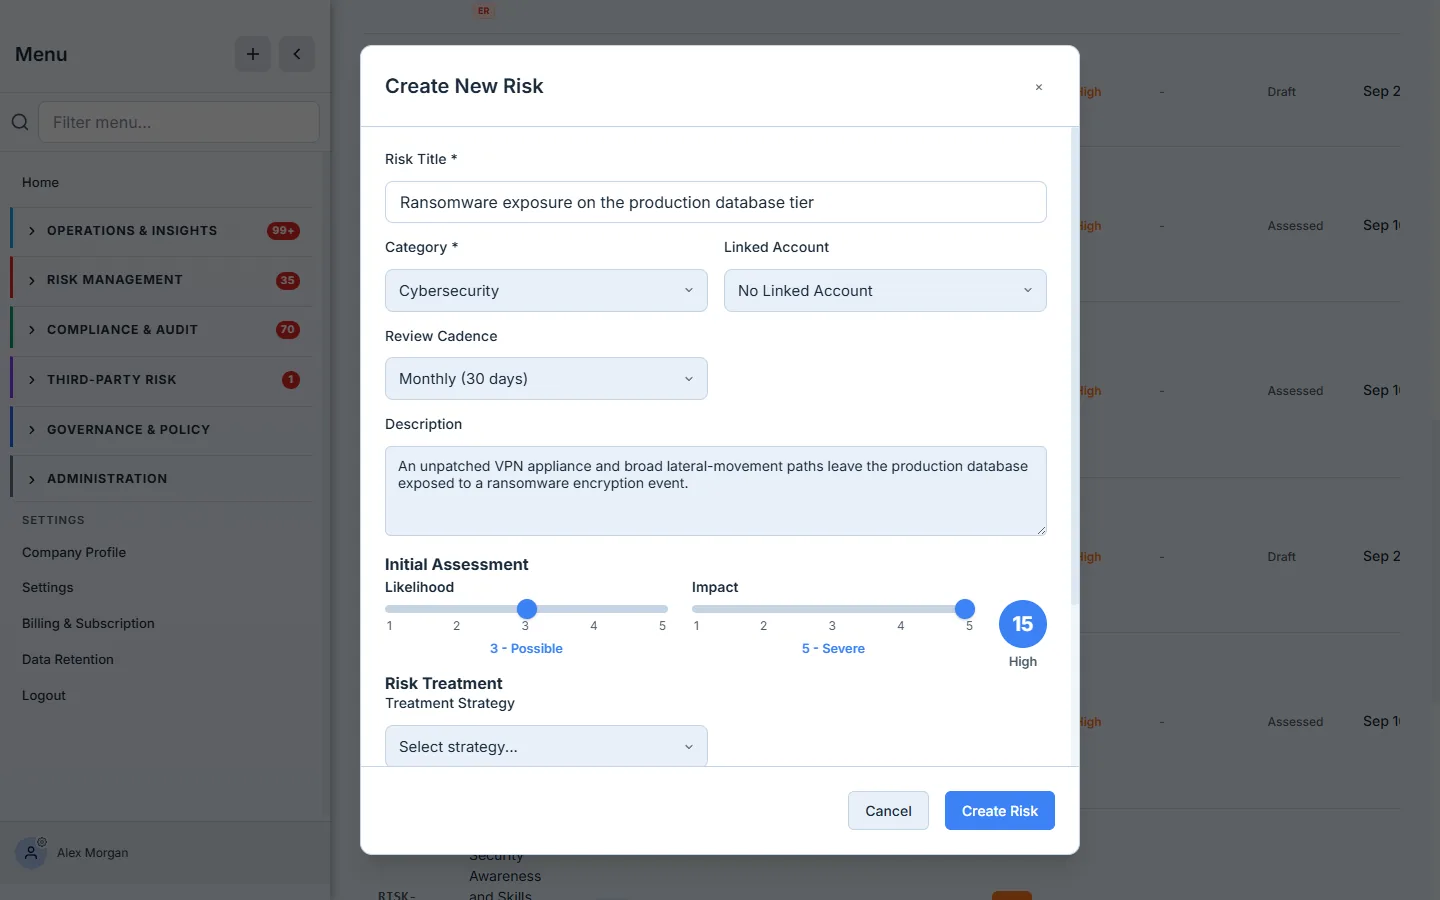
Click New Risk and you describe it in one modal: a title, a category (Strategic, Operational, Cybersecurity, Compliance, Third-Party, and the rest), a review cadence, and a description. Then the part that makes it a risk and not a note — the initial assessment: likelihood and impact sliders (1–5 each) that drive a live preview score and level as you move them, and a treatment strategy to start with.
The second door is the one most teams miss. Generate from Assessments turns a finished assessment into tracked risks: pick the completed runs, set a score threshold per assessment type, and Talarity previews the candidate risks (the questions that scored below your bar). Review the candidates, select the ones worth tracking, and generate — each new risk is stamped with the assessment run it came from.
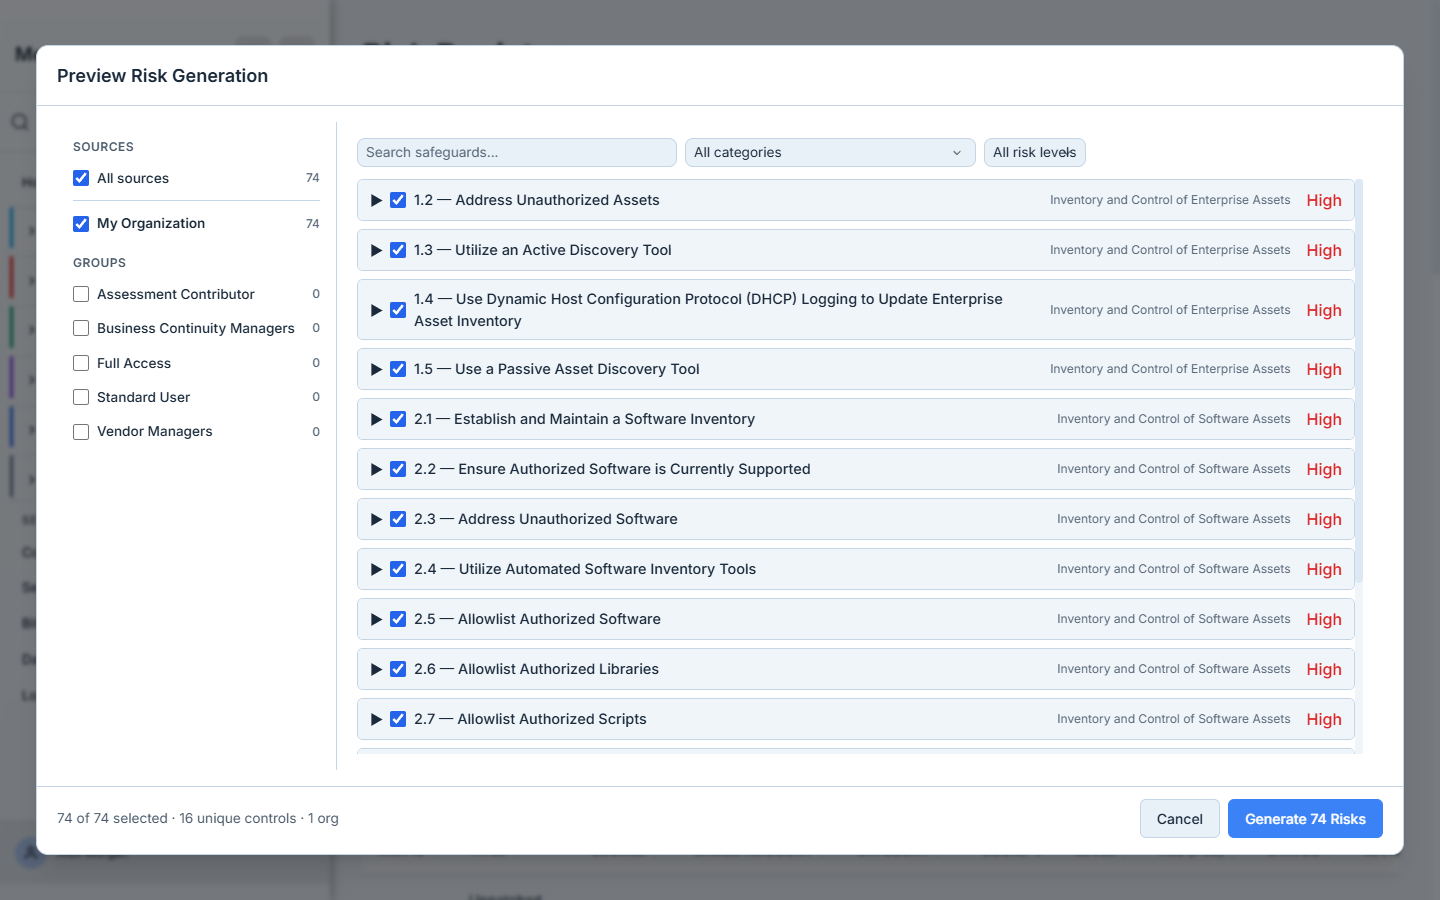
Manual for the one-off, generate-from-assessment for the sweep. Type a risk in by hand when something specific lands on your desk. But after you finish a CIS or CSF assessment, don’t re-key the gaps as risks one by one — let the register pull them, pre-scored and provenance-stamped, in a single pass.
Step 3 — Score it: inherent versus residual
Open the risk and you land on its case file. The header carries the big score circle, the status and lifecycle badges, the category, and the review-due date; the action bar gives you Edit, Re-Assess, Mark Reviewed, Accept, and the closure workflow.
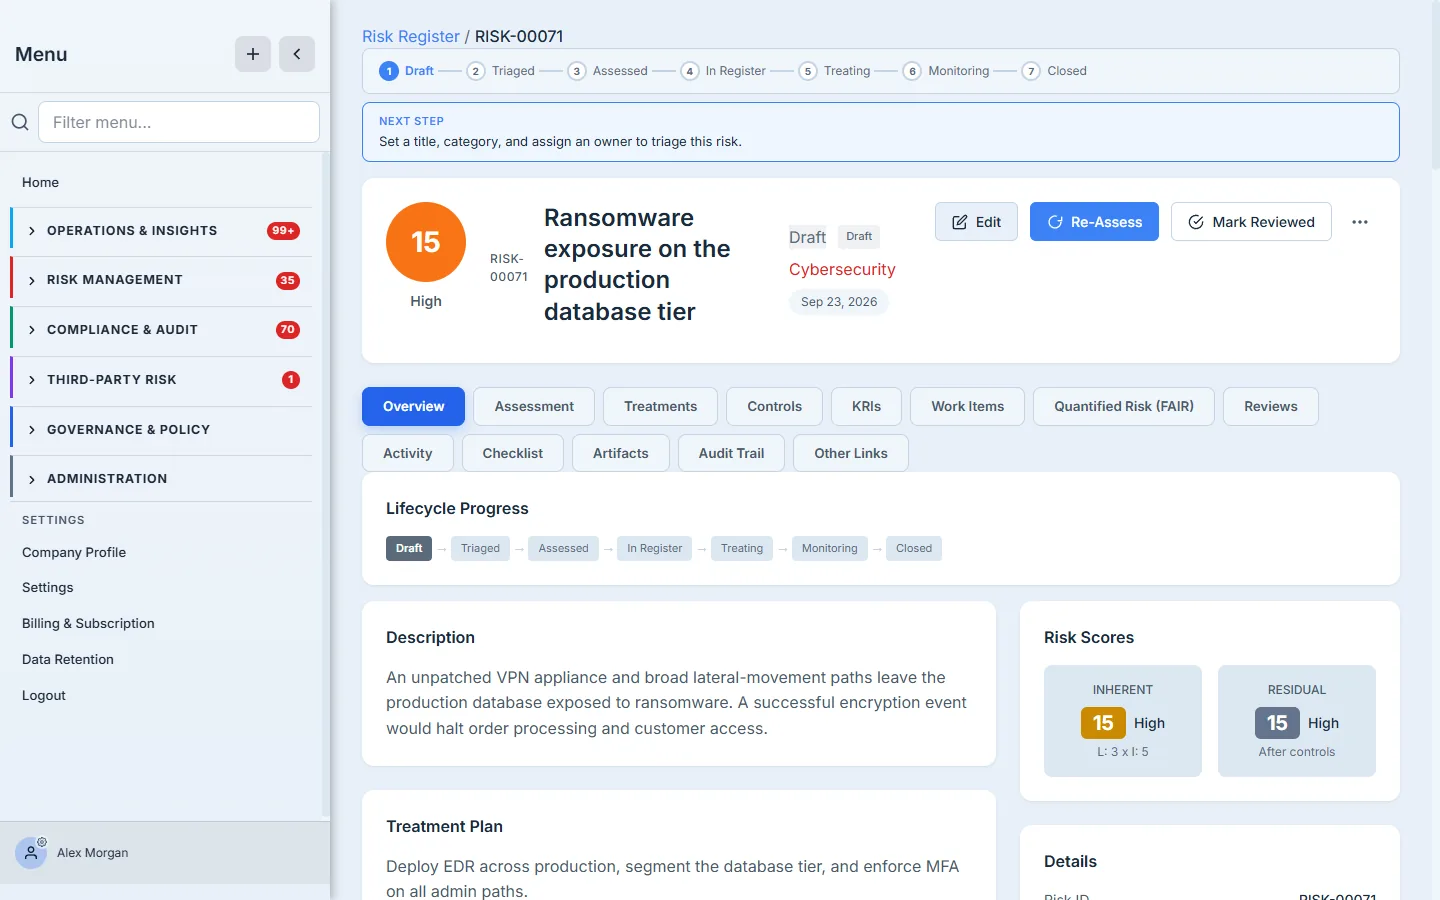
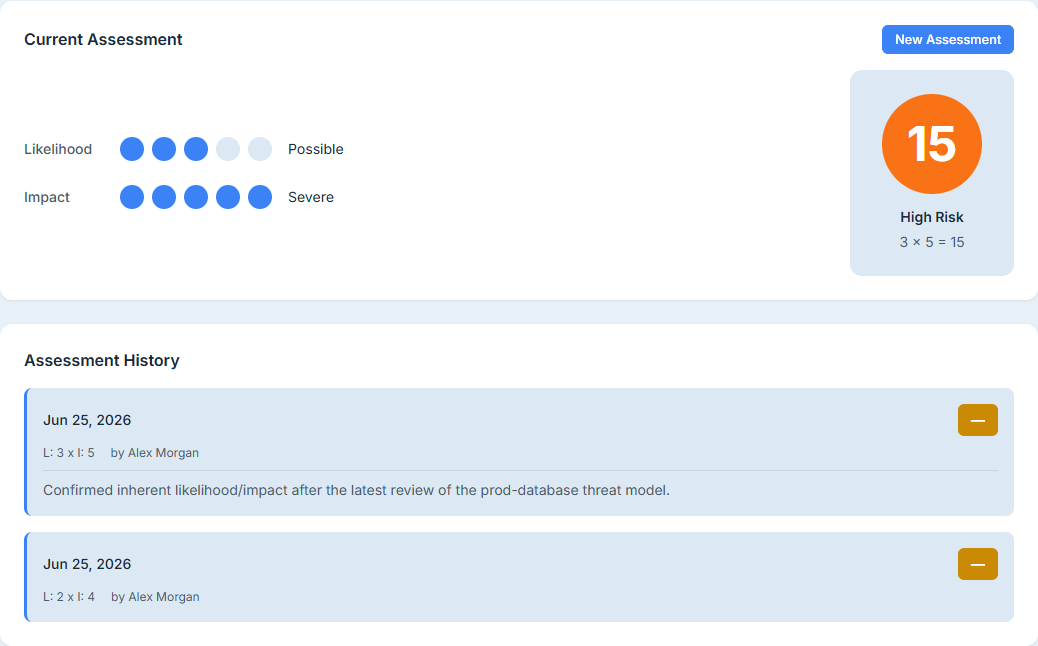
The score itself is likelihood × impact on a 1–5 scale, mapped to five levels — Minimal, Low, Medium, High, Critical. The Overview tab shows two scores side by side: inherent (the risk before your controls) and residual (the risk after the controls you’ve verified). The Assessment tab is where you re-score, with a history timeline of every change and who made it.
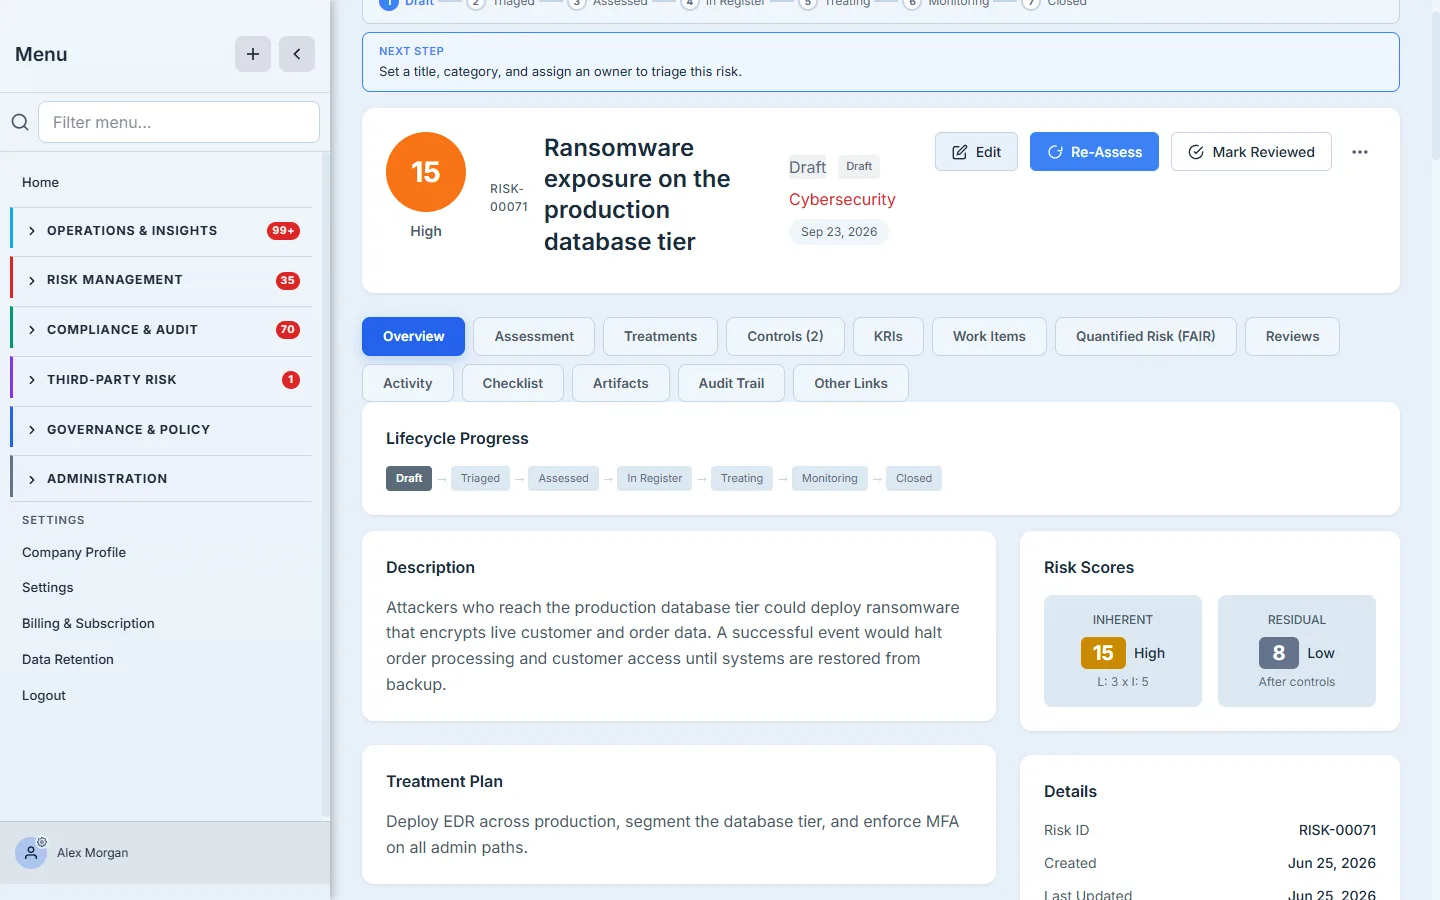
The gap between inherent and residual is what your security program bought you. A Critical inherent risk that sits at Medium residual is a control story you can tell an auditor: here’s the raw exposure, here are the verified controls, here’s the reduction they earned. A residual score that never moves off inherent means your controls aren’t credited — or aren’t there.
Back on the register, the Matrix tab plots the whole portfolio on a likelihood × impact heat map — the fastest way to see where your concentration of high-stakes risk actually is.
Step 4 — Treat it: four strategies, one recorded decision
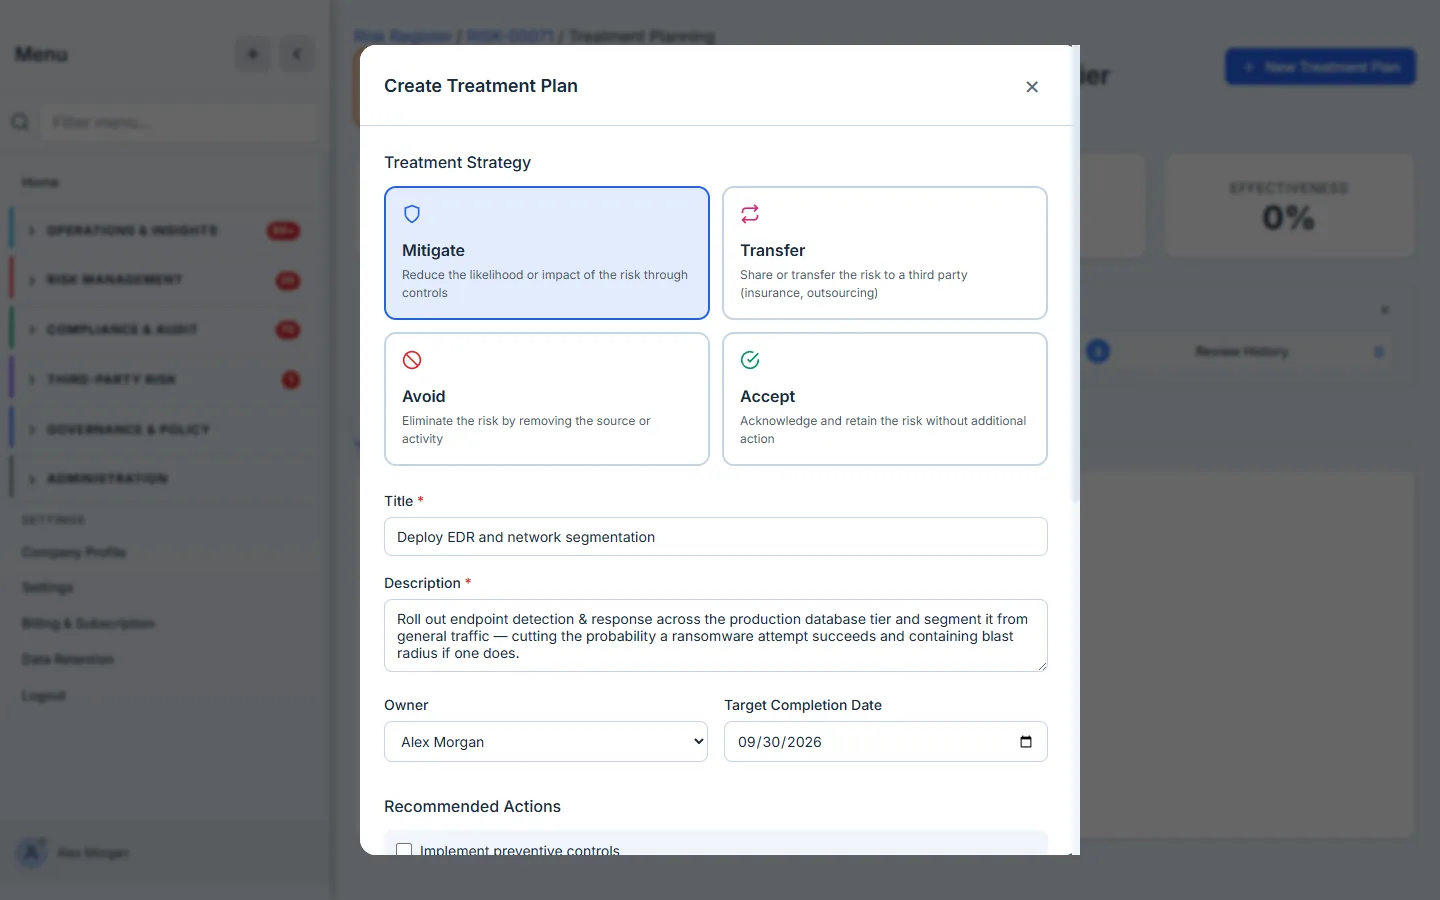
Open the risk’s treatment view (/app/risks/:riskId/treatment). Talarity gives you the four ISO 31000 strategies as cards, each with the moves it implies:
- Mitigate — reduce likelihood or impact with controls. Residual risk should fall as the controls land.
- Transfer — shift the financial risk to a third party (cyber insurance, an outsourced service). The premium is recorded as a cost.
- Avoid — eliminate the activity that creates the risk. This closes the risk.
- Accept — knowingly retain it, with a rationale and an expiry so “accepted” can’t quietly become “ignored forever.”
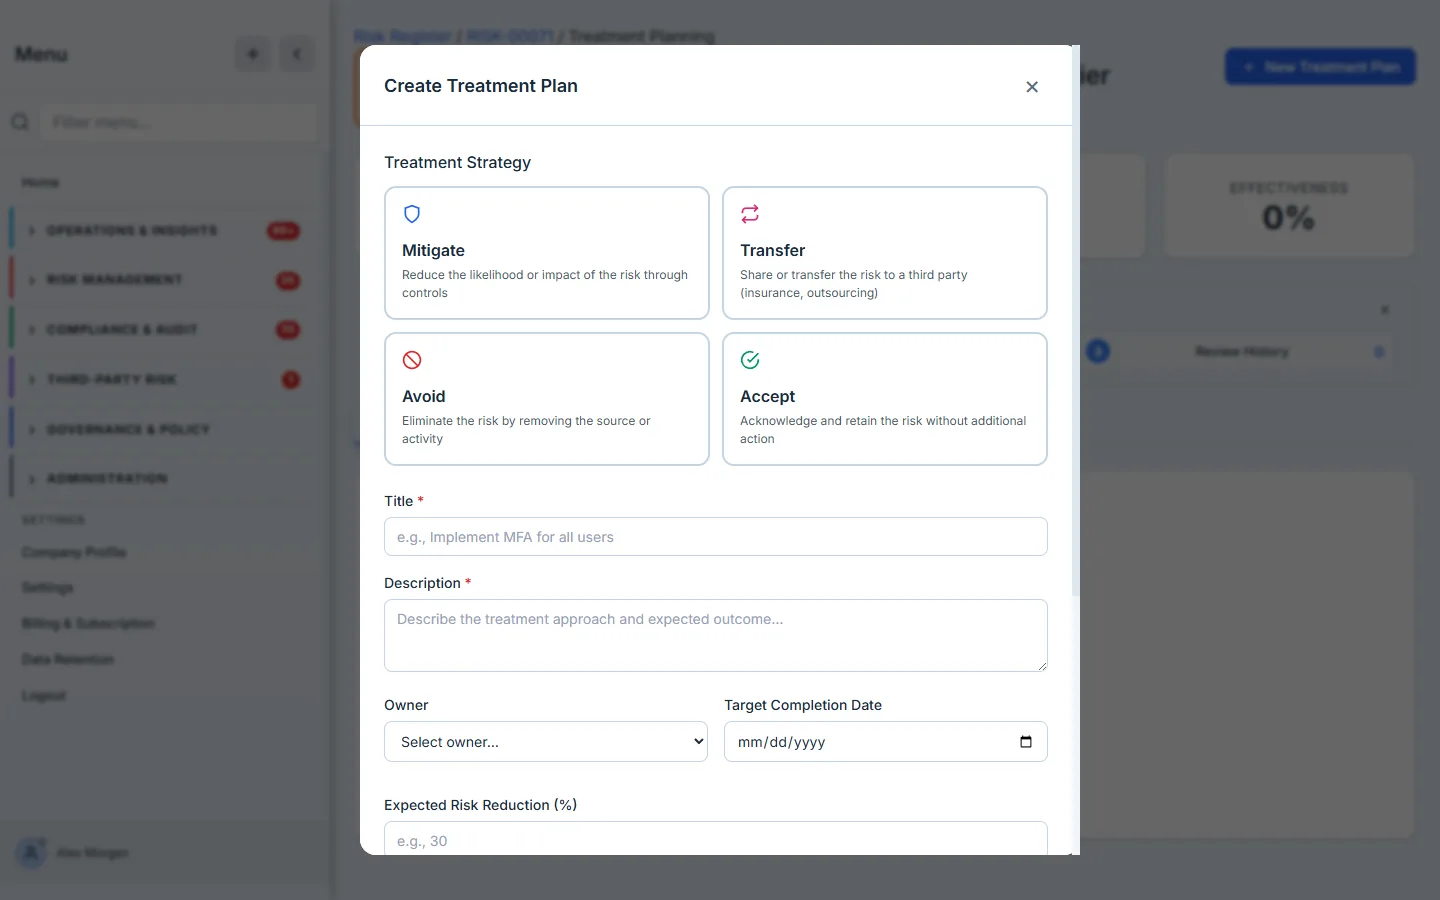
A treatment plan is a real work item: a title, an owner, a target date, an expected reduction, linked controls, and cost entries. As it progresses, you track it to an outcome — the actual reduction measured after the fact, against the expected.
Treat versus accept is the decision the article exists to make easier. Mitigate when a control meaningfully moves the number and the cost is worth it. Transfer when the loss is survivable-with-insurance but not survivable alone. Avoid when the activity isn’t worth the exposure. Accept — explicitly, with an expiry and a named owner — when the residual is genuinely tolerable. The wrong move is the silent one: letting a risk sit untreated with no decision on record.
Step 5 — Link the controls that earn the residual drop
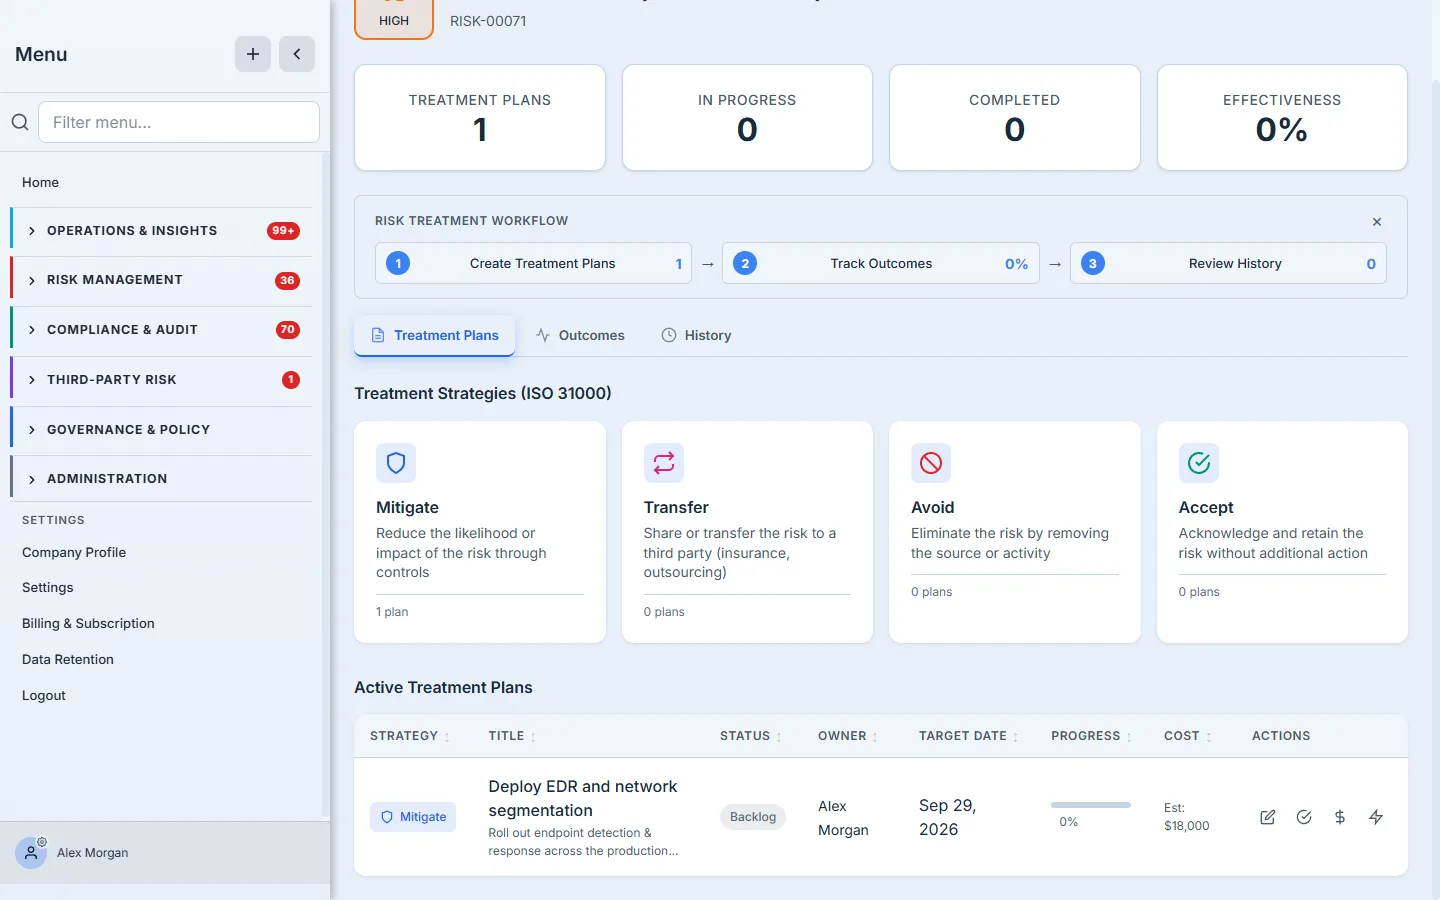
Residual risk doesn’t fall because you wrote a plan; it falls because controls are in place and verified. On the risk’s Controls tab, link the CCL controls that mitigate it. The link is a real relationship, and the strength of your verified control coverage is what justifies a residual score below inherent.
Step 6 — Quantify it with FAIR
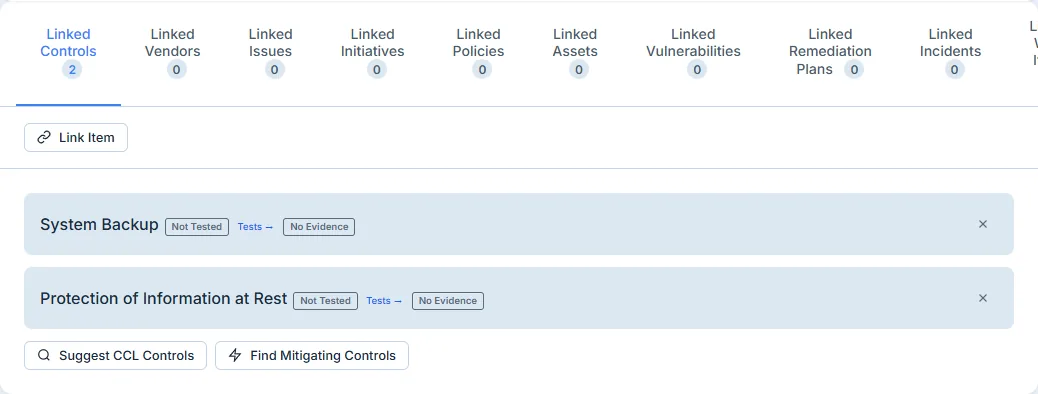
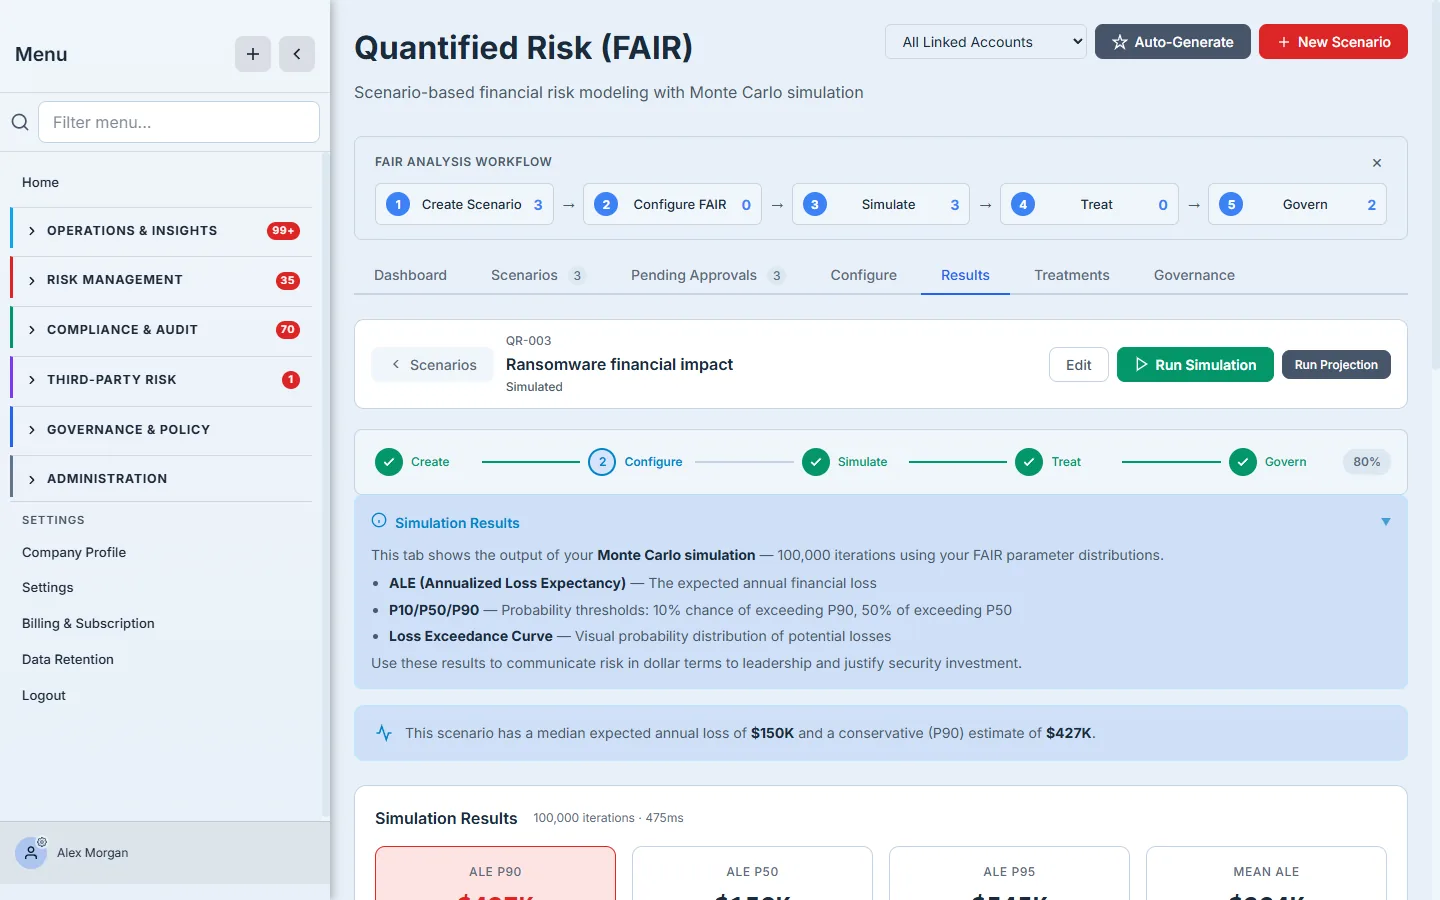
For the risks where a dollar figure changes a decision, open Quantified Risk (FAIR) (/app/risk/quantified). FAIR turns “high cyber risk” into a loss distribution. In the Configure tab you set the model’s inputs as min/likely/max ranges: Threat Event Frequency, Vulnerability (the share of attempts that succeed), Primary and Secondary loss magnitude, with Loss Event Frequency computed as TEF × Vulnerability.
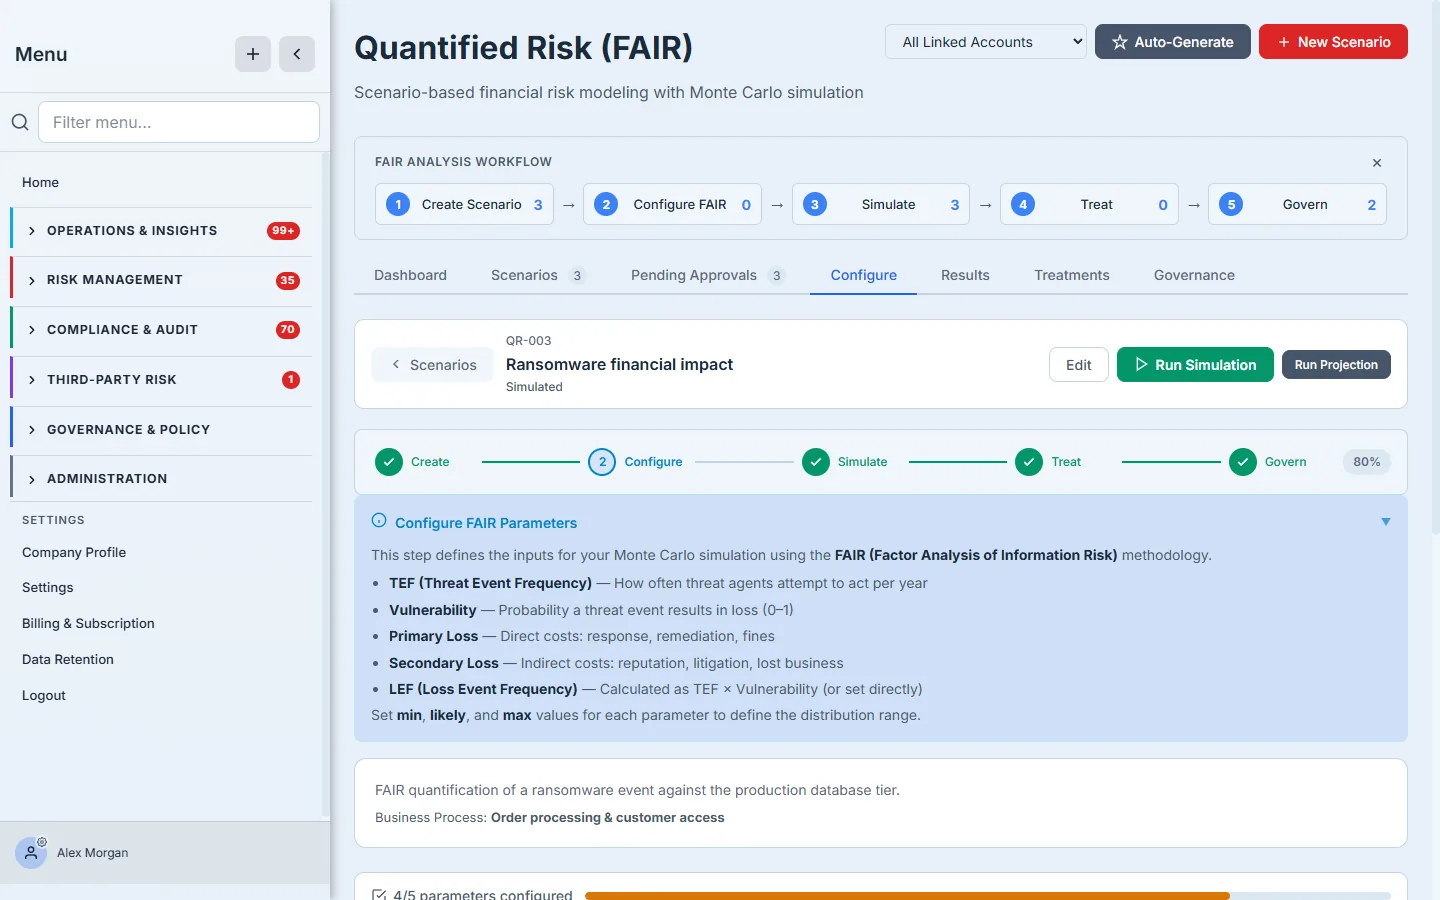
Run the simulation and Talarity executes a Monte Carlo of 100,000 iterations, sampling each parameter across its range. The Results tab reports ALE at the 10th, 50th, and 90th percentiles plus the mean — and the loss-exceedance curve: the probability of exceeding any given loss. P90 is the prudent number for budgeting; the curve is the picture a board understands.
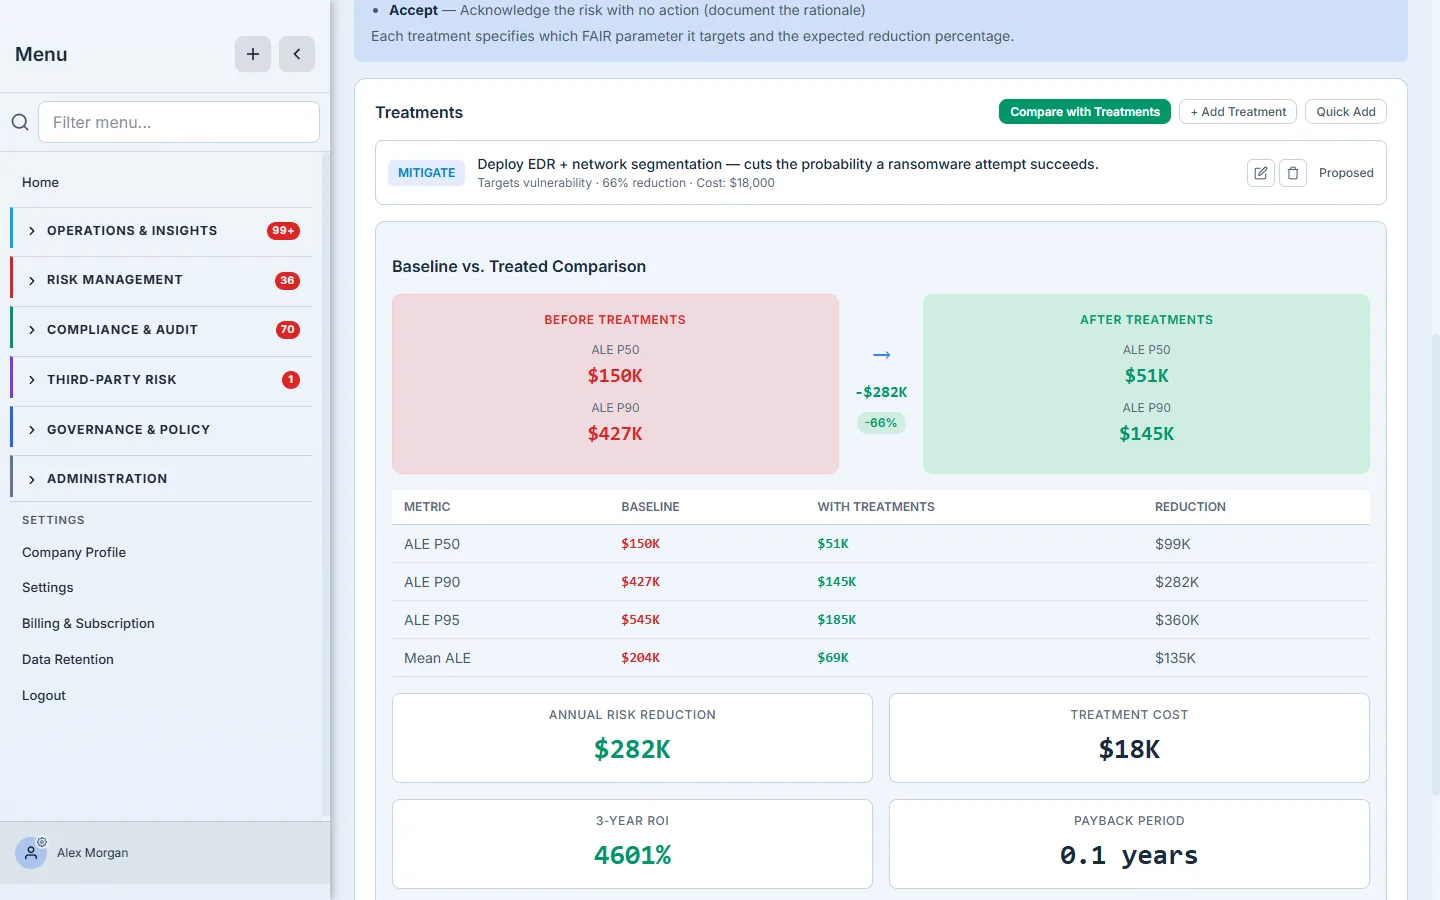
The Treatments tab closes the loop with money attached: model a control’s effect on a parameter, re-simulate, and read the baseline-versus-treated comparison — “this control reduces our ALE by 45%.” That is a security investment expressed in the language the budget is written in.
Not every risk warrants FAIR. Scoring (Step 3) is enough for most of the register. Reserve quantification for the handful where a dollar figure actually changes what you’d do — a budget request, an insurance limit, a board decision. FAIR is the tool you reach for when “high” isn’t specific enough to act on.
Step 7 — Monitor, review, and keep it honest
The lifecycle doesn’t end at “treated.” Each risk carries a review cadence; the register’s Review Queue surfaces what’s overdue. The lifecycle bar tracks the risk through its states, and an acceptance carries an expiry that reopens the risk for re-triage when it lapses. A quantified risk’s ALE flows back onto the register row and into the FAIR governance/approval trail — so the number an auditor reads is the number that was reviewed and signed off.
What you walk away with
- A register that runs the whole lifecycle on one record — identified, scored, treated, quantified — instead of a list you re-discover at audit time.
- Inherent and residual scores that make your control story legible: raw exposure, verified controls, and the reduction they earned.
- A recorded treatment decision — mitigate, transfer, avoid, or accept — with an owner, a cost, an expected reduction, and an outcome, not a silent gap.
- A FAIR dollar figure for the risks that warrant one — ALE percentiles, a loss-exceedance curve, and a treated-vs-baseline comparison your board can act on.
- A review cadence and acceptance expiry so a managed risk can’t quietly go stale.
Open /app/risks, log the one risk you’d least like to explain at your next board meeting, set its likelihood and impact, and pick a treatment strategy. If it’s the kind of risk where someone will ask “what would that actually cost us?”, take it through FAIR. You’ll walk into the meeting with a number you can defend — and the trail behind it.