Every vendor you depend on promised you a service level: 99.9% uptime, a four-hour response time, a recovery objective. It’s written into the contract. And then — for most teams — nobody ever checks. The SLA lives in a PDF, the vendor sends a status email once a year, and the first time anyone notices a breach is when something is already on fire.
Talarity treats a vendor SLA as something you measure, not something you file. You define each commitment as a metric with a target, record the vendor’s actual performance, and Talarity does the comparison continuously — flipping a vendor to breached the moment they fall below contract, raising an alert, and opening a remediation work item. One dashboard rolls the whole portfolio up into a compliance scoreboard.
Who’s involved
- TPRM / vendor manager — owns the SLA definitions and watches the scoreboard.
- Service owner — gets the breach alert and the remediation work item.
- The board / risk committee — sees the portfolio-level compliance rate.
What’s on the page
There are two surfaces under Third-Party Risk, and they answer two different questions.
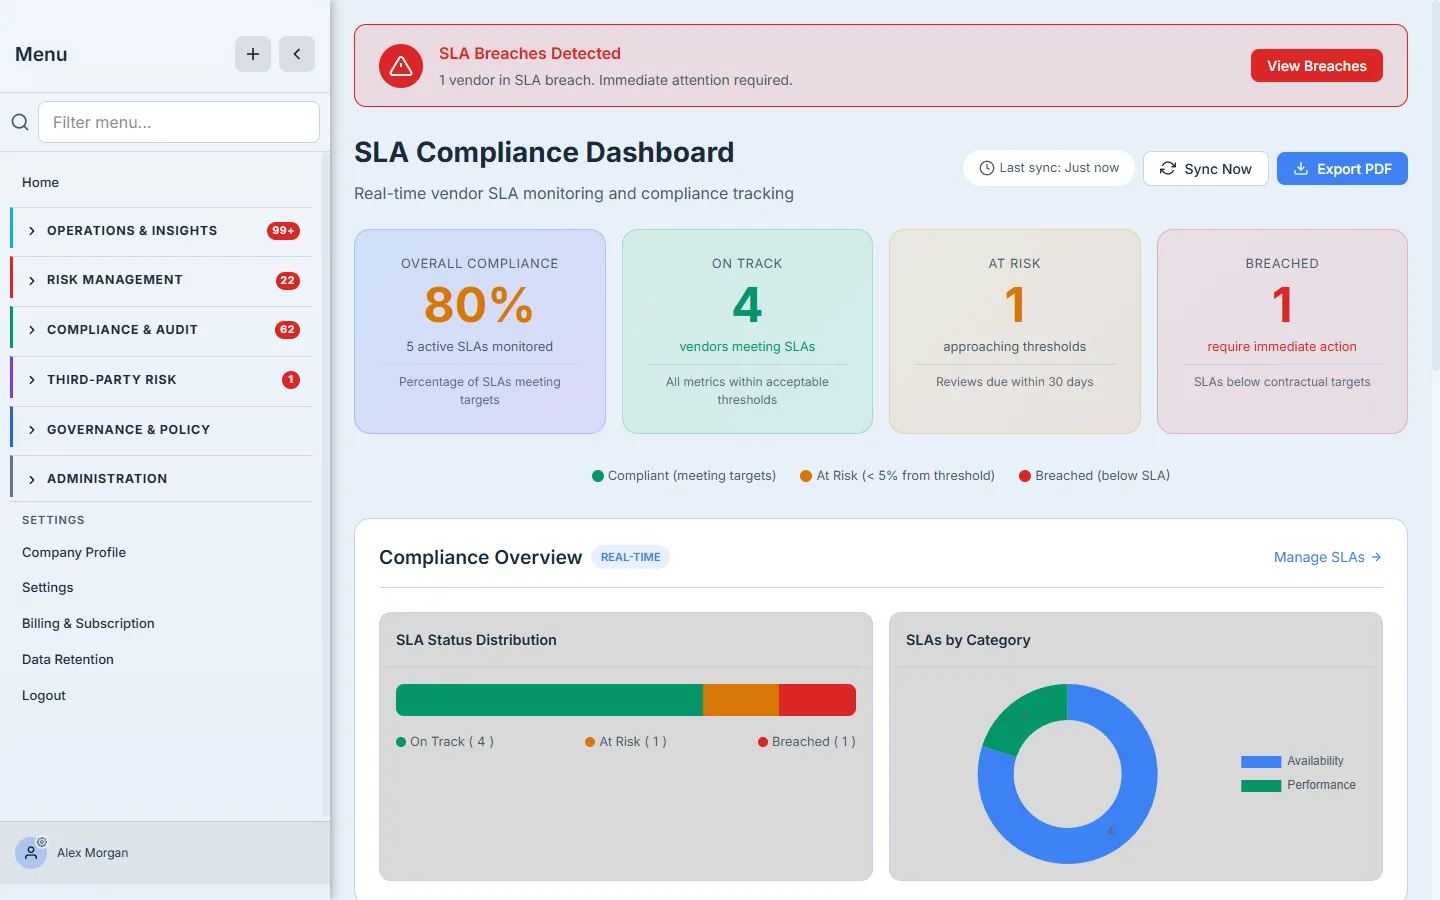
SLA Compliance is the portfolio scoreboard — “how is the whole vendor estate doing?”:
- Overall compliance rate — the headline percentage across every SLA you track.
- Three status counts — On Track, At Risk (within 5% of the threshold, or a review due in the next 30 days), and Breached (a measurement below the contractual target).
- Status-distribution bar — the same three buckets as a proportional bar, for an at-a-glance read.
- SLAs-by-category donut — your SLAs split by category (availability, performance, support, security…), so you can see where your contractual commitments are concentrated.
- Sync Now and Export PDF — pull fresh measurements (see “How the page works”) and produce a board-ready report.
- Breach banner — when any vendor is in breach, a banner pins to the top and links straight to it.
SLA Management is the per-vendor detail — “is this vendor keeping this promise?”. Each SLA renders as a card carrying its category (with an icon + label), a compliance rate with a colored bar, a review badge (Review in N days or Review Overdue, driven off the SLA’s review date), and — if any measurement came in low — a “N breaches recorded” warning. Inside the card, each metric shows its current value, its target, and when it was last measured. A category filter narrows the list.
Step 2 — Each vendor’s SLAs
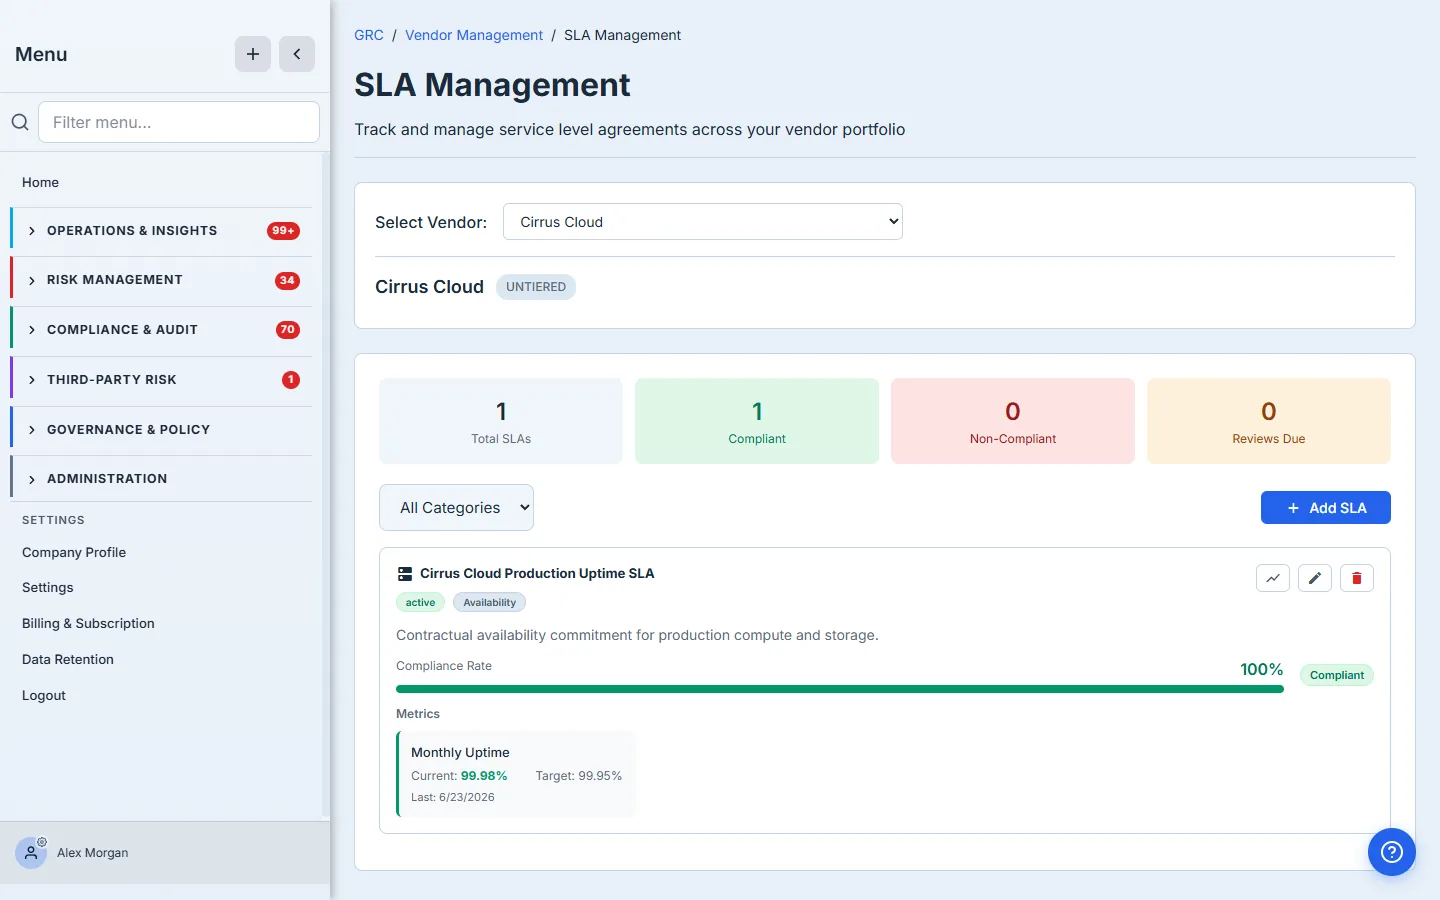
Drill into a vendor from SLA Management and you see its individual commitments. Here, Cirrus Cloud carries a Production Uptime SLA with a single metric — Monthly Uptime, target 99.95% — currently measured at 99.98%. Above target, so the SLA reads 100% compliant.
How the page works
A few mechanics explain why the numbers move on their own:
- Compliance is computed from measurements vs target, not entered. Each metric’s recorded value is compared to its target; the SLA’s compliance rate and its colored bar follow from that comparison. Record a number above target and nothing happens; record one below and the SLA flips (Step 4).
- The three buckets are thresholds, not labels. At Risk is the early-warning band — a metric within 5% of its threshold, or an SLA whose review date falls inside 30 days (you’ll see a Review in N days badge before it’s actually late). Breached is below the contractual target. Everything else is On Track.
- Sync Now pulls live status automatically. For vendors whose uptime lives on a public status page, Talarity ships status-page connectors (Statuspage.io, Instatus, and a generic connector) — Sync Now fetches current uptime from the connected source and records it as a measurement, so you’re not transcribing numbers from a vendor’s email. Breach detection then runs across every vendor and writes any breach into the unified vendor-alert stream the rest of the monitoring module reads from.
- A breach is an event, not just a count. A below-target measurement raises a vendor alert, opens a remediation work item routed to the service owner, and lights up the dashboard’s Breached count and the top banner — the same record an auditor or your risk committee sees.
Step 3 — Define an SLA
Adding one is Add SLA. Give it a name and a category (availability, performance, support, security…), point it at the contract clause, set a review date, and add one or more metrics — each with a target type (percentage, time, count) and a target value. You can also record escalation contacts and the penalty/credit terms the contract specifies for a miss.
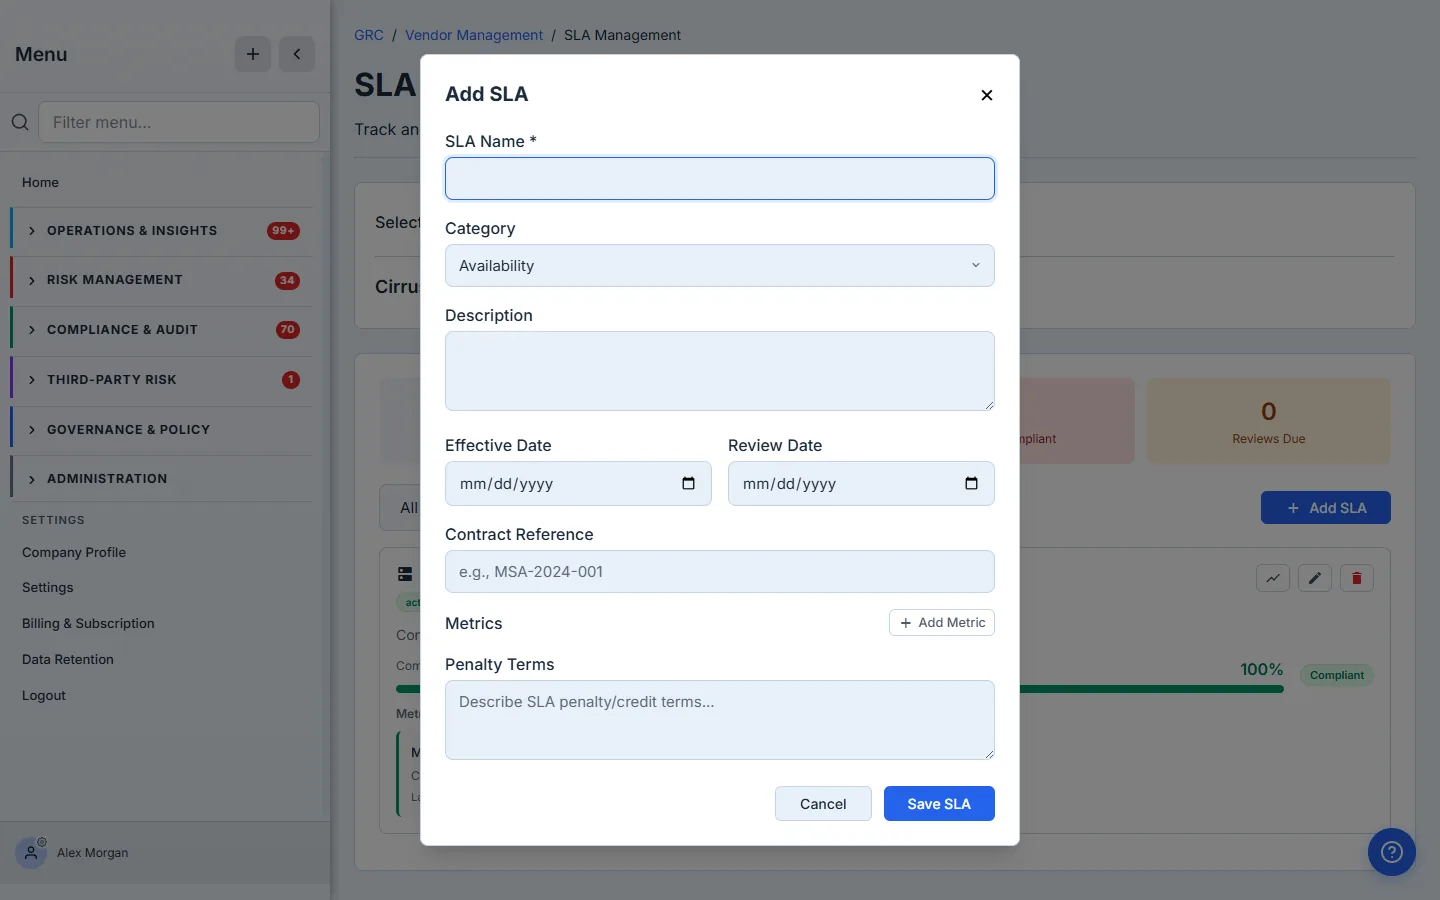
The contract reference field is the one people skip and shouldn’t. When a vendor disputes a breach, “SLA below target” is an opinion; “SLA below the 99.9% in MSA-2024-001 §7.2” is a conversation you win.
Step 4 — When a vendor breaches
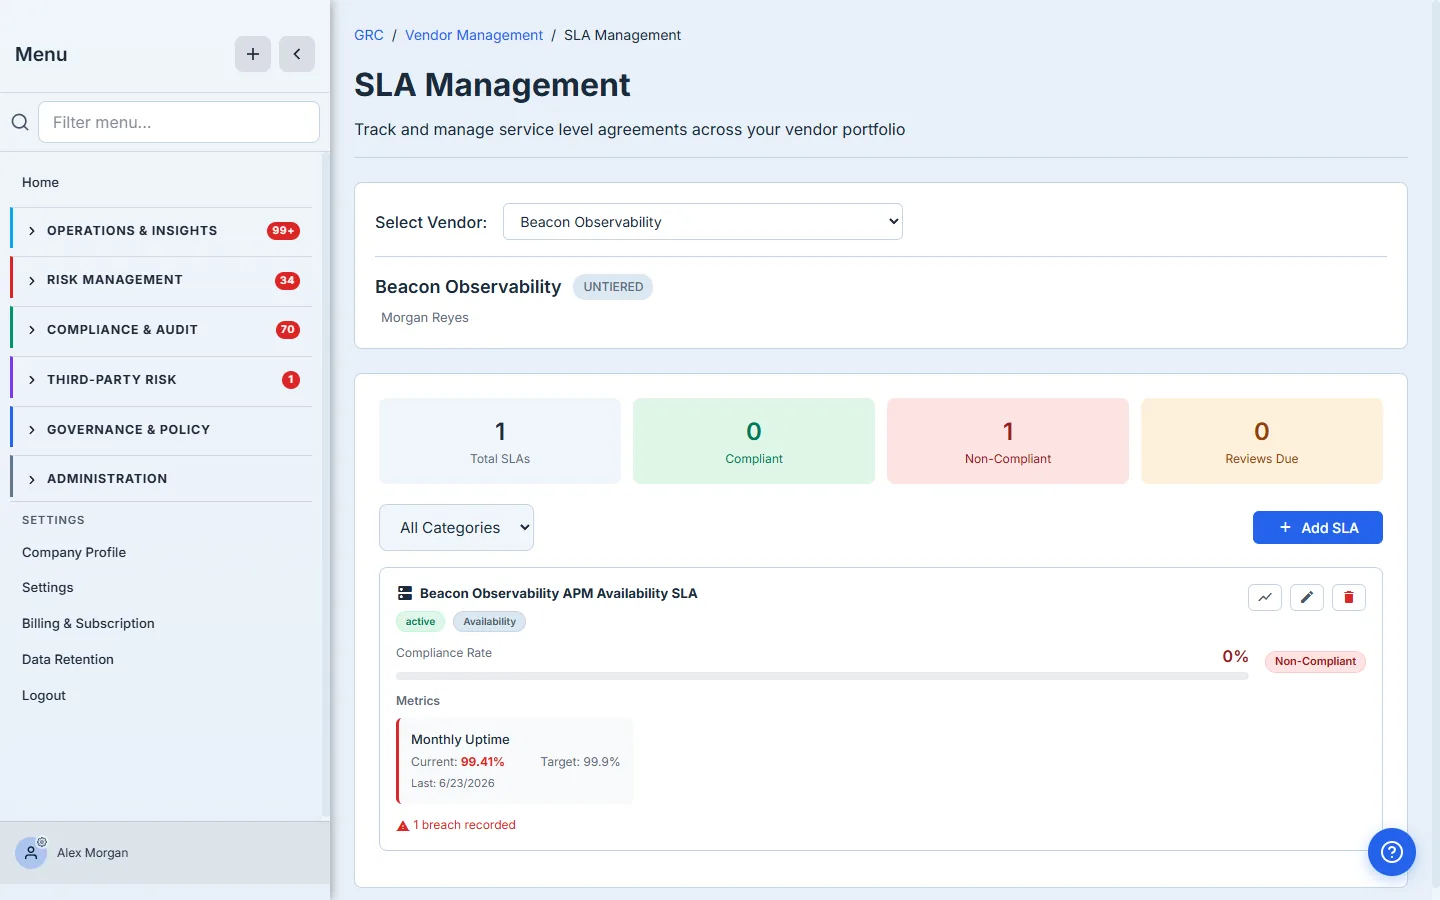
Record a measurement below target and the SLA flips. Here Beacon Observability’s Monthly Uptime came in at 99.41% against a 99.9% target — so the SLA is Non-Compliant, its compliance rate drops, and the page shows “1 breach recorded.” Behind the scenes that breach doesn’t just sit on a counter: it raises a vendor alert and opens a remediation work item routed to the service owner, and it lights up the dashboard’s Breached count and the banner from Step 1.
What you walk away with
- SLAs you measure, not file — each contractual commitment is a metric with a target and a recorded actual.
- Breaches that act — a measurement below target raises an alert and opens a remediation work item, automatically.
- A portfolio scoreboard — one compliance rate, on-track / at-risk / breached, ready for the board and exportable to PDF.
Open Third-Party Risk → SLA Dashboard, pick your most critical vendor, and add the one SLA that matters most — its uptime. The next time it slips, you’ll know before your customers do.
Related: an SLA breach is one of the signals vendor monitoring acts on, and the remediation it opens is tracked the same way as any other vendor finding. Overview: vendor risk management.