There are two very different questions an auditor — or your own board — can ask about disaster recovery. The first is “what have you tested?” — that’s coverage, and the DR program dashboard answers it. The second is harder: “how good is your recovery practice?” You can have 100% test coverage and still run shallow tests against unrealistic RTOs with no immutable backups. Coverage says you did the activity; it doesn’t say you’re actually resilient.
The BC/DR readiness score answers the second question. It’s a 10-question maturity model — DR test frequency, RTO/RPO achievement, BIA currency, immutable backups, runbook accuracy, alternative processing, third-party DR coordination, recovery validation, cloud DR — each scored 0–5 and rolled into a single readiness picture. It’s a diagnostic, not a checklist: it tells you which parts of your recovery practice are mature and which are a liability.
Early access (Beta). The Extended Risk readiness dashboards are in early access. The model and visuals shown here are live, but expect refinement as the module moves toward general availability.
Who’s involved
- Risk leader / CISO — reads the maturity score to understand where recovery practice is strong vs. fragile, and what to prioritize.
- DR program owner — uses the dimension breakdown and the maturity roadmap to target the next set of improvements.
- Auditor / board — gets a defensible, framework-mapped maturity readout (ISO 22301, NIST 800-34, CIS v8 Control 11) rather than a binary “we tested.”
What’s on the page
Open BC/DR Testing under Extended Risk (/app/products/extended-risk/bcdr). It’s a dashboard over a single maturity assessment, with a sticky header and two tabs plus a roadmap:
- The header — three numbers that stay on screen: the BC/DR score (0–5), the risk level it implies, and coverage (the share of in-scope recovery actually tested, carried over from the DR program).
- Overview tab — the readout: the DR Readiness Maturity waterfall (one bar per recovery domain), the Recovery Objectives gauges (RTO / RPO / Validation), the DR Dimensions rings (Recovery Objectives / Resilience / Planning), the Backup & Resilience grid, and the Critical Findings list.
- Analysis tab — the interpretation layer: the BC/DR Control Radar (your four dimensions vs. a target profile), Question Maturity Scores (all ten questions ranked), the BC/DR Trend line, and the Risk Heatmap of DR failure scenarios.
- Maturity Roadmap — your current level, the next target, and the exact questions below threshold with the points each needs.
The four steps below walk those in the order you’d actually read them.
Step 1 — The readiness readout
Open BC/DR Testing under Extended Risk (/app/products/extended-risk/bcdr). The top of the page is the headline: a single BC/DR score, the risk level, coverage, and the DR Readiness Maturity waterfall — your maturity across the seven recovery domains, from DR testing through third-party coordination.
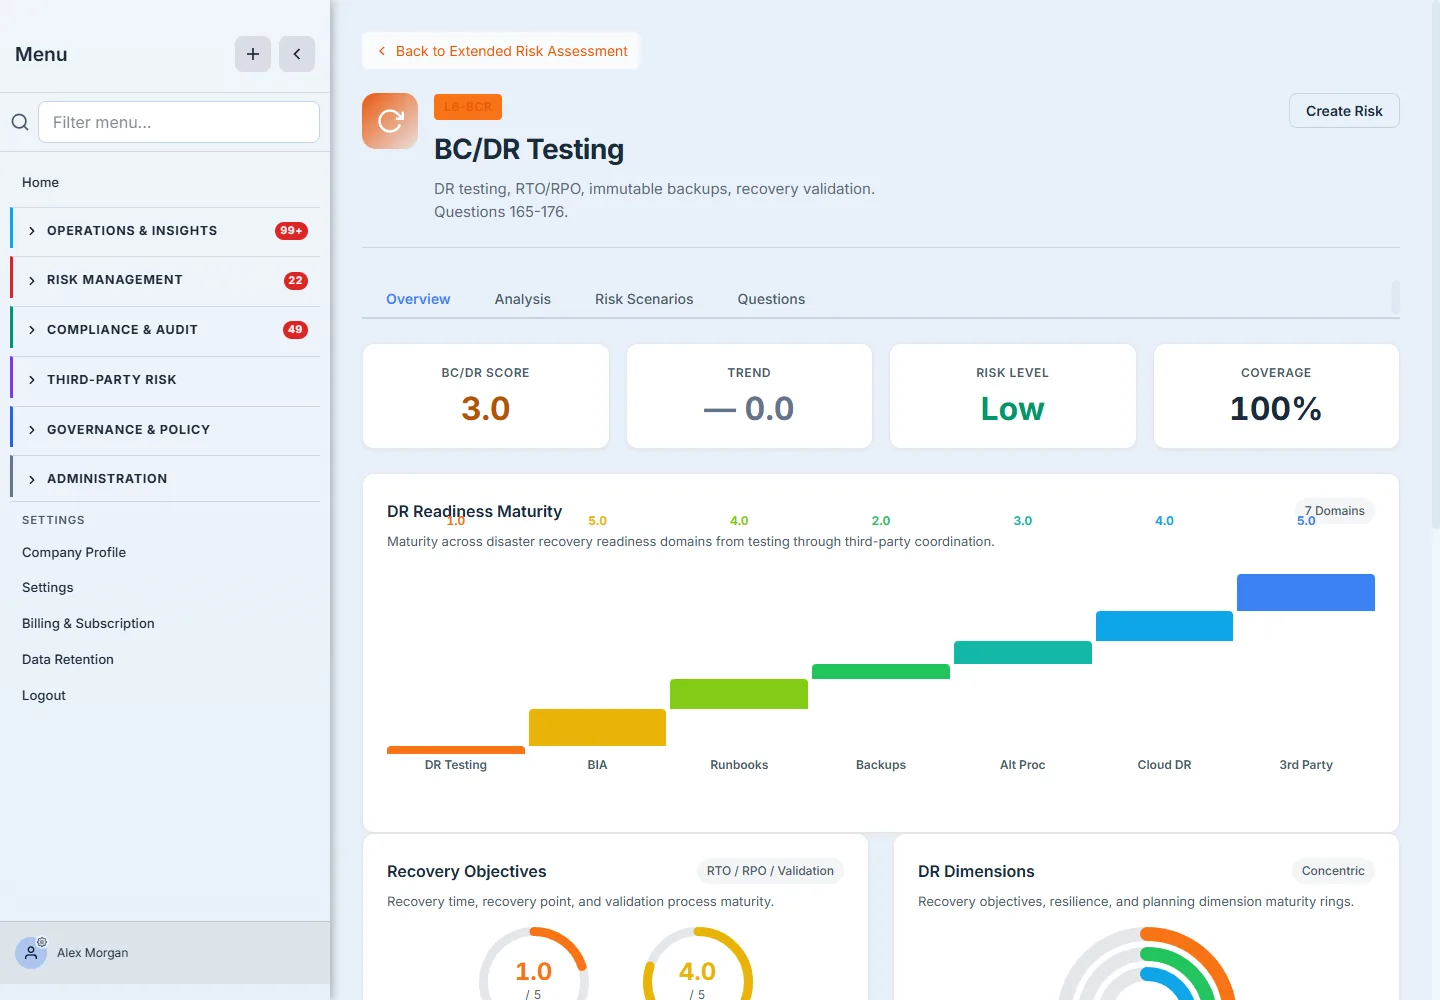
The waterfall is the fastest read in the product: each bar is a domain’s maturity, stepping from your weakest (here DR Testing at 1.0 — a real exposure) up to your strongest (3rd Party at 5.0). A flat-high waterfall means a balanced, mature program; a jagged one — like this — tells you exactly where to look.
A 3.0 average can hide a 1.0. The score is the headline; the waterfall is the story. Two organizations with the same overall score can have completely different risk profiles — one evenly “developing,” one excellent-but-with-a-fatal-gap.
Step 2 — The dimensions behind the score
Below the waterfall, the score is broken into the parts that matter for recovery.
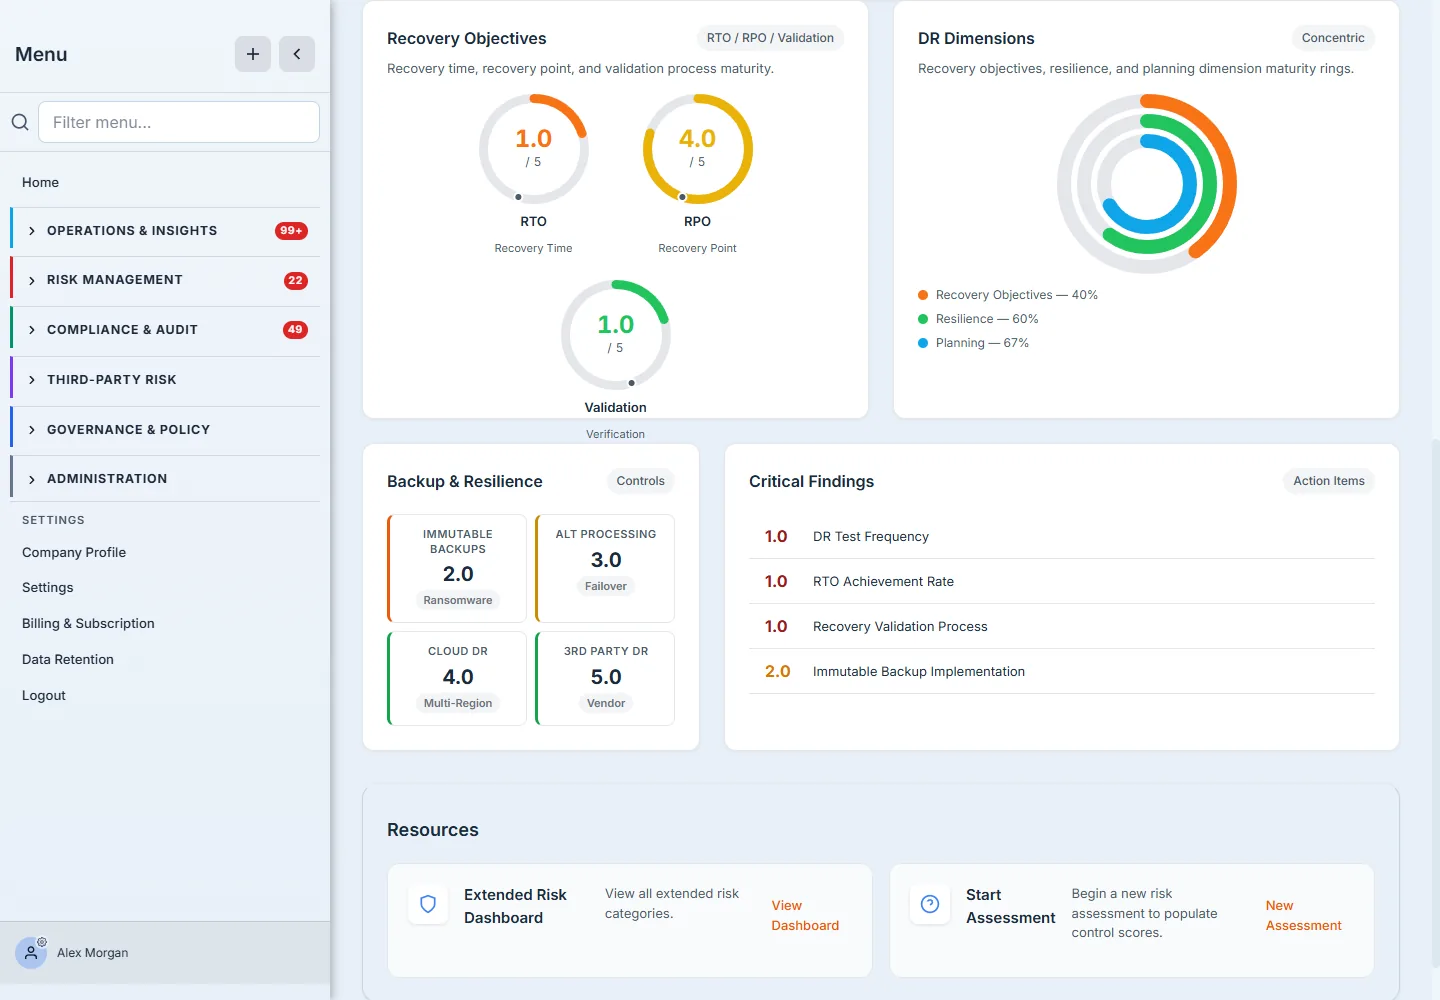
The Recovery Objectives gauges separate RTO, RPO, and validation maturity — so you can see that recovery point (RPO 4.0) is in good shape while recovery time and validation (both 1.0) are not. The DR Dimensions rings roll the ten questions into three lenses — Recovery Objectives, Resilience, Planning. The Backup & Resilience grid scores immutable backups, alternative processing, cloud DR, and third-party DR at a glance. And the Critical Findings list names the low-maturity items directly — DR Test Frequency, RTO achievement, recovery validation — so the weak spots aren’t buried in an average.
Step 3 — The analysis behind the picture
The Analysis tab is for interpretation. The Control Radar plots your four dimensions against the target profile (the dashed overlay), so a dent in the shape is an instantly visible gap. Question Maturity Scores ranks all ten questions, and the Risk Heatmap plots the built-in DR failure scenarios — ransomware destroying backups, RTO failure, third-party cascade, cloud-region outage — by likelihood and impact.
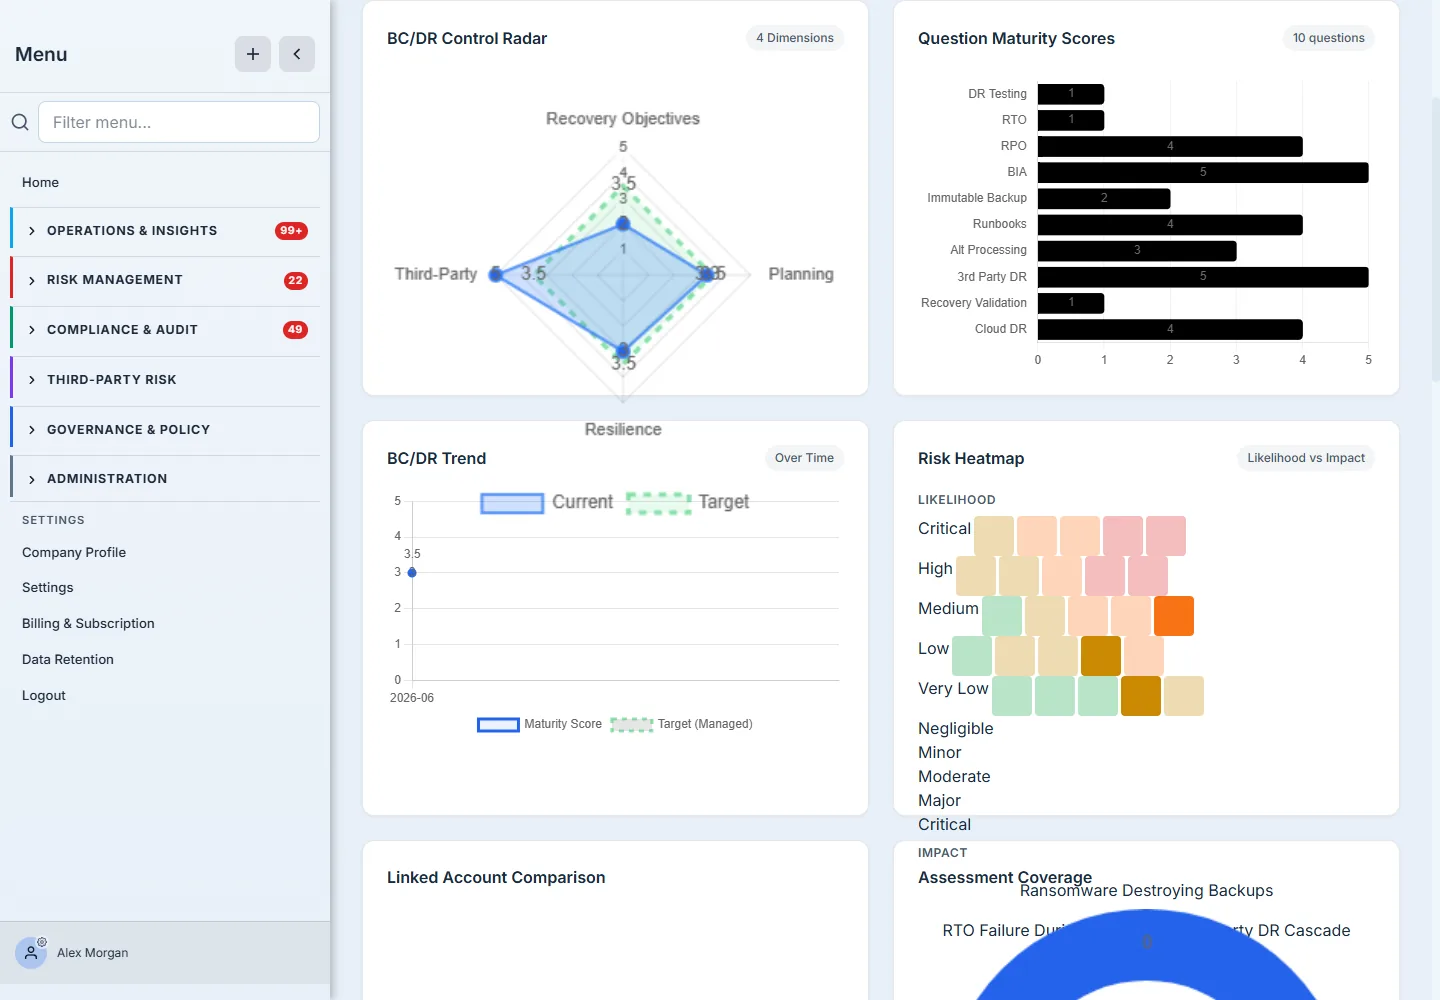
This is where the readiness score stops being a number and becomes a conversation: the radar shows shape, the heatmap shows which disaster scenarios you’re exposed to, and the trend line tracks whether you’re improving over time.
Step 4 — Your maturity roadmap
The payoff is the Maturity Roadmap: your current maturity level, the next target, and exactly which questions sit below that threshold — with the points needed and the quick wins flagged.
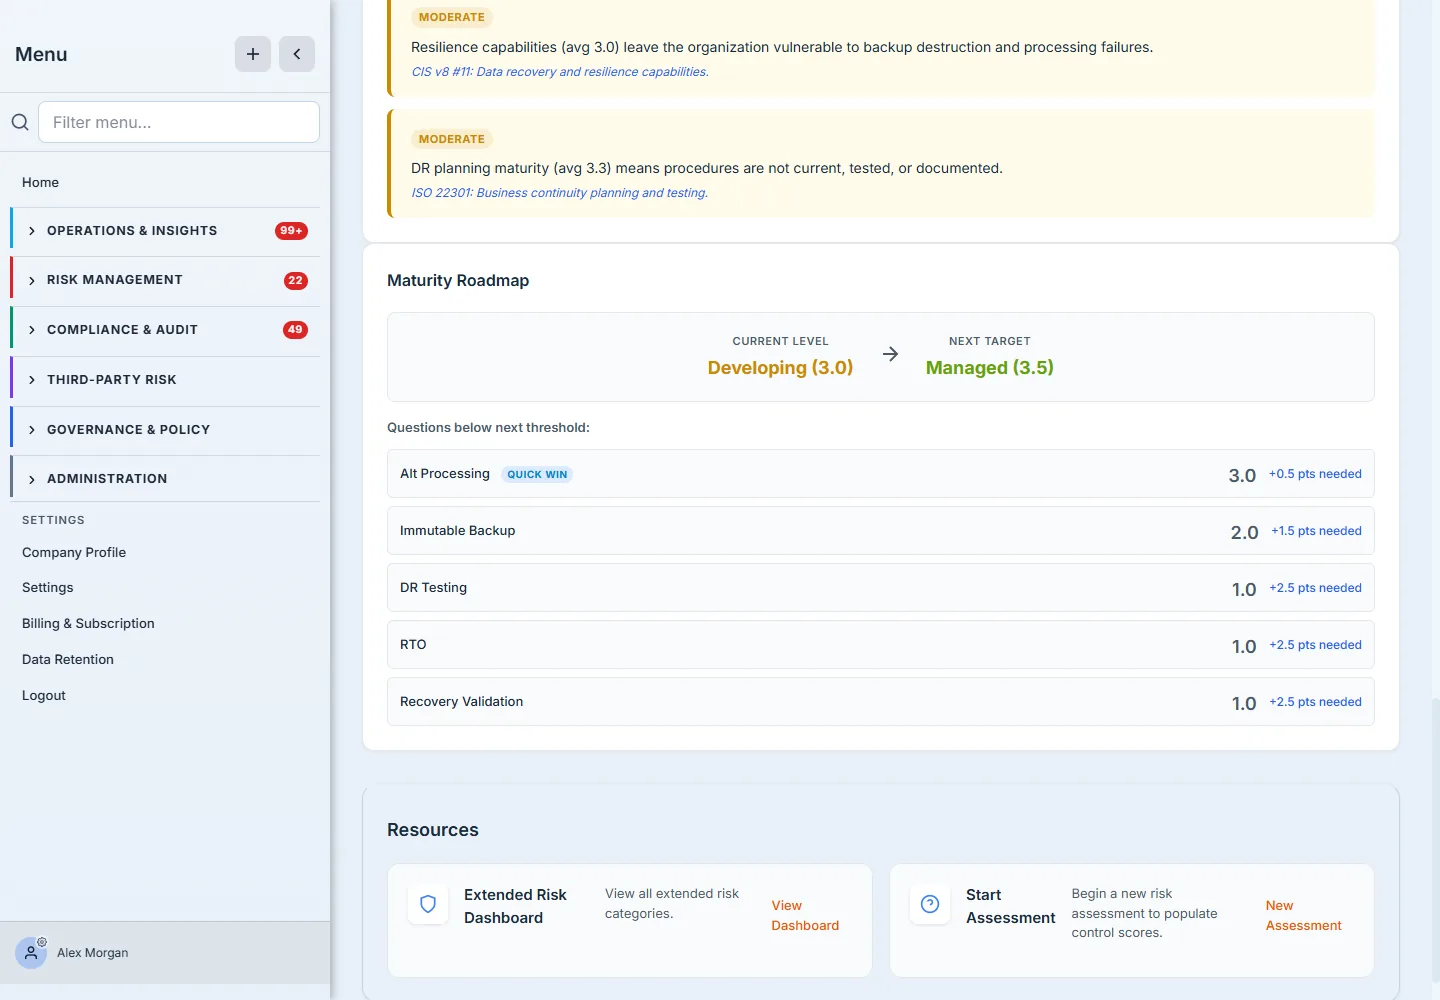
It turns the diagnosis into a plan: to move from Developing (3.0) to Managed (3.5), the dashboard shows that Alt Processing needs just +0.5 (a quick win), while DR Testing and RTO each need +2.5 (the heavy lifts). The risk insights above it are framework-cited — CIS v8 #11: data recovery, ISO 22301: business continuity planning and testing — so the gaps map straight to the controls an auditor checks.
How the page works
The dashboard doesn’t store a score — it reads a 10-question maturity assessment and recomputes every visual on the page:
- The ten questions are the Extended Risk BC/DR Testing layer (
L6-BCR-001…L6-BCR-012) — DR test frequency, RTO and RPO achievement, BIA currency, immutable backups, runbook accuracy, alternative processing, third-party DR coordination, recovery validation, and cloud DR. Each is scored 0–5. - The score and the waterfall are roll-ups, not inputs. Every question is tagged to one of four dimensions — Recovery Objectives (RTO, RPO, Validation), Planning (DR-test frequency, BIA, runbooks), Resilience (immutable backup, alt processing, cloud DR), and Third-Party — and the gauges, rings, and overall score are averages over those groupings. That’s why a 3.0 average can hide a 1.0: the headline is a mean, the waterfall is the distribution.
- The risk heatmap is derived, not authored. Each built-in DR failure scenario is wired to specific questions — Ransomware Destroying Backups keys off your Immutable Backup score, RTO Failure off RTO achievement — so a low answer doesn’t just lower a bar, it lights up the scenario it exposes you to.
- Every item is framework-cited. Each question carries its mapping — ISO 22301, NIST SP 800-34, CIS v8 #11, BCI GPG — so a weak answer points straight at the control an auditor checks.
How to raise your score
The dashboard is a mirror; you change it by changing the answers underneath:
- Open the Extended Risk BC/DR Testing assessment and answer (or re-answer) the ten L6-BCR questions honestly against your current practice — a maturity model rewards evidence, not optimism.
- Re-open this dashboard. The waterfall, gauges, rings, score, and heatmap all recompute from the new answers — there’s no separate publish step.
- Work the Maturity Roadmap top-down. It already sorts the below-threshold questions by the points they need and flags the quick wins (a +0.5 like Alt Processing) apart from the heavy lifts (a +2.5 like DR Testing). Bank the quick wins to move your level, then schedule the heavy lifts as real program work.
What you walk away with
- A maturity number you can defend — not “we tested,” but a 0–5 readiness score across ten recovery practices, mapped to ISO 22301 / NIST 800-34 / CIS v8 #11.
- The weak spots named — the waterfall, gauges, and critical-findings list surface your lowest-maturity domains instead of averaging them away.
- A prioritized next step — the maturity roadmap tells you the quick win and the heavy lift to reach your next level.
Open BC/DR Testing under Extended Risk and read the waterfall first. The tallest gap between two adjacent bars is where your recovery practice is most uneven — and the maturity roadmap will tell you what it costs to close it.