Every security investment decision is really a bet: spend X on a control, reduce risk by Y. Most teams make that bet on intuition — they buy the tool, deploy it, and hope the board agrees it was worth it. Risk scenario analysis turns the bet into a model. Start from your actual risk posture, propose a change — tighten a control, transfer risk to insurance, avoid an activity entirely — and Talarity projects what it does to your risk score, your annual loss exposure, and the return on the spend, before you commit the budget.
This is distinct from FAIR quantification (covered in Risk lifecycle — from identify to quantify). FAIR answers “what is this risk worth, precisely?” with Monte-Carlo loss distributions. Scenario analysis answers a faster, earlier question: “if I do this, what happens?” — a what-if sandbox for decisions, not a precision measurement.
Who’s involved
- Risk manager — builds the scenario, picks the target risks, sets the parameters.
- CISO / security lead — uses the projected ROI and payback to justify (or kill) a control investment.
- Finance / the board — sees the spend framed as risk-reduction return, not just a line item.
What’s on the page
Open Risk Scenarios (/app/risk-scenarios) — a what-if modeler over your live risk baseline:
- Baseline builder — start from your real current posture, then change one variable.
- Modeled return — the projected ROI and payback of a control improvement.
- Cost-of-inaction — model a threat increase, not just the fix.
- Runs are projections only — they never write back to your register.
Step 1 — Start from your real baseline, then build the bet
Open /app/risk-scenarios. The top of the page isn’t a blank canvas — it’s your current risk baseline, computed from the live risk register: total risks, average score, how many are Critical or High, and an estimated annual loss (ALE). Every scenario is modeled against this baseline, so you’re never modeling in the abstract.
Below it sits the Scenario Builder. The Scenario Type is the key fork: Control Improvement (you strengthen a control), Threat Increase (you model a worsening threat — the cost of inaction), Risk Transfer (Insurance) (you move loss to a policy), and Risk Avoidance (you discontinue the risky activity). Each type swaps in its own parameters, so the builder always asks the right questions for the bet you’re modeling.
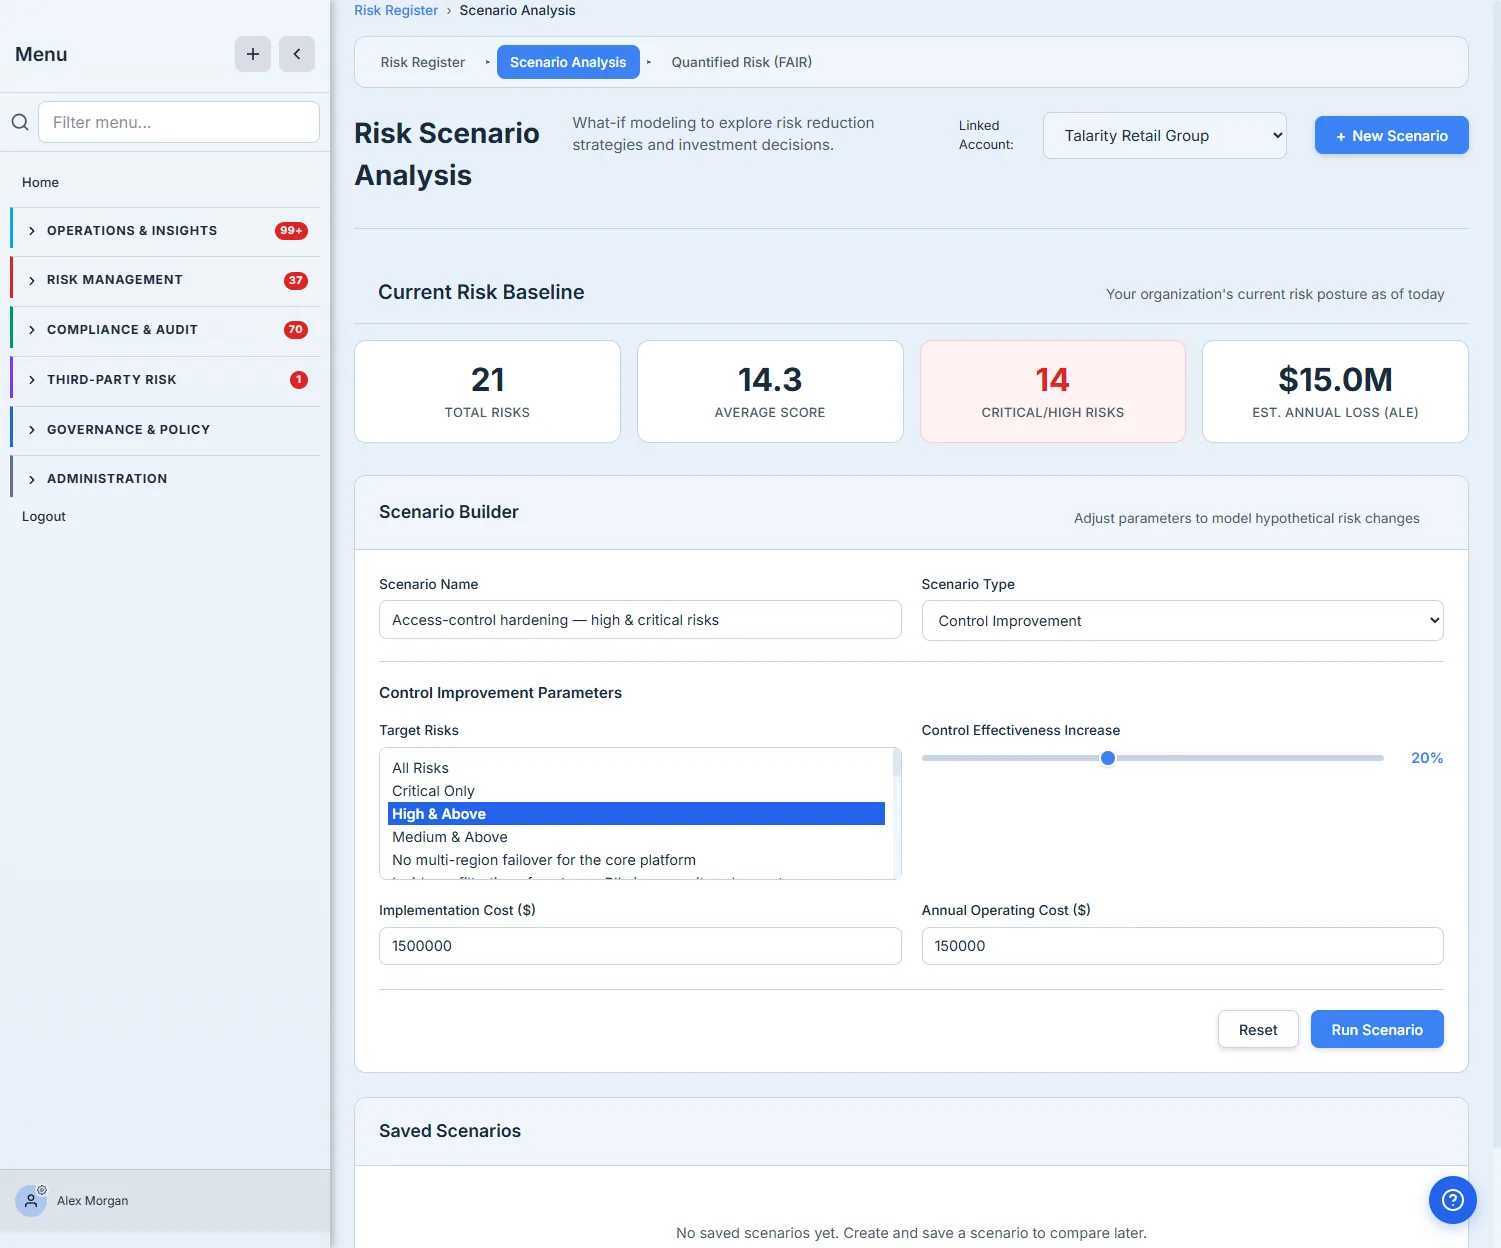
Pick Control Improvement, name it, target High & Above to scope the bet to the risks that move the needle, and enter what it costs — both the upfront Implementation Cost and the recurring Annual Operating Cost. The two cost fields are what separate this from a hand-wave: the return is measured against the total cost of the control over its life, not just the purchase price.
Step 2 — See the modeled return
Hit Run Scenario and Talarity projects the bet against your baseline — the risk score and annual loss side by side, before and after, with the investment math underneath.
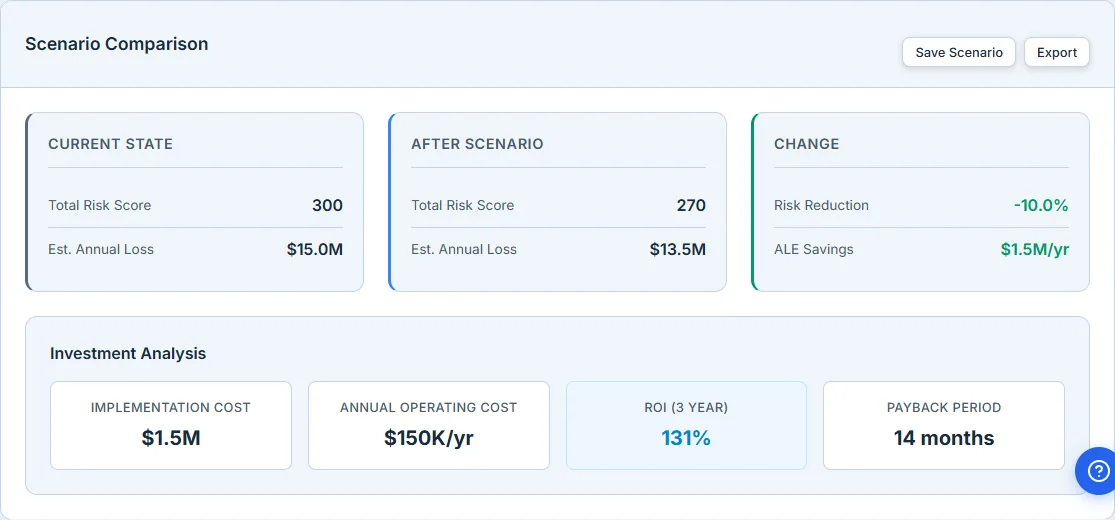
This is the whole point. The Change column quantifies the bet — a 10% risk reduction worth $1.5M/yr in avoided annual loss. The Investment Analysis turns that into the language a budget conversation actually uses: a 131% three-year ROI and a 14-month payback on a $1.5M program. Those numbers reconcile — three years of savings ($4.5M) against the total three-year cost ($1.5M upfront + $450K operating), net of everything. That’s a figure you can put in front of a board and have it survive the CFO’s back-of-envelope check — and if it came back at 12% with a five-year payback, you’d know to kill the proposal before it ever became a purchase order.
Step 3 — Model the cost of inaction, not just the fix
The most persuasive risk case isn’t only “here’s what the control buys” — it’s “here’s what doing nothing costs.” Switch the Scenario Type to Threat Increase, pick a threat source, and set how much more likely and impactful it gets. Now you’re modeling the bet in reverse.
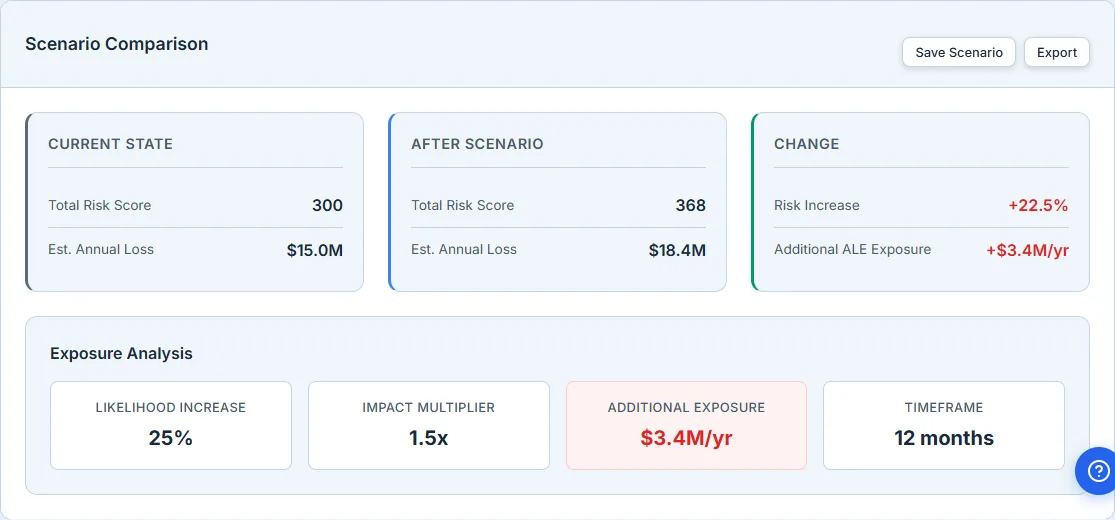
Here the numbers run red: a worsening external threat pushes the risk score from 300 to 368 and grows annual loss exposure by $3.4M/yr. Set the $1.5M control investment from Step 2 against this $3.4M/yr of unmanaged growth and the case makes itself — the spend isn’t a cost, it’s the cheaper side of a bet you’re already exposed to.
How the page works
The page is two halves — a fixed baseline you can’t edit and a builder you can — and the projection sits between them:
- The baseline is live, not typed. The top-of-page totals (risk count, average score, Critical/High count, estimated ALE) are computed from your current risk register, so every scenario is measured against the posture you actually have today. Change the register and the next scenario you run starts from the new baseline.
- The Scenario Type rewires the form. Each of the four types — Control Improvement, Threat Increase, Risk Transfer (Insurance), Risk Avoidance — swaps in its own parameters (an effectiveness slider and two cost fields for a control; a likelihood/impact multiplier and a timeframe for a threat; a premium and retained-loss for insurance). You never see fields that don’t belong to the bet you’re modeling.
- Run Scenario projects, it doesn’t commit. Running a scenario re-scores your targeted risks under the proposed change and recomputes ALE — nothing is written back to the register. It’s a sandbox: the “After Scenario” numbers are a projection you can throw away.
- ROI and payback are measured over the whole life of the control, not the sticker price. The three-year ROI reconciles the projected savings (annual ALE reduction × 3) against the total three-year cost (implementation + 3× annual operating), and payback is the month the cumulative savings cross that total spend — which is why a cheap tool with high operating cost can still fail the test.
What you walk away with
- Decisions modeled against your real baseline — every scenario runs against the live risk register’s score and ALE, not a hypothetical.
- Four bet types, one builder — control improvement, threat increase, insurance transfer, and avoidance, each with the parameters that bet actually needs.
- The investment in board language — projected risk reduction, ALE change, a 3-year ROI that reconciles, and a payback period, so a control purchase is framed as a return, not a cost.
- A what-if sandbox, not a precision tool — for the precise dollar figure on a single risk, FAIR quantification takes over.
Open /app/risk-scenarios, point a Control Improvement at your High-and-Above risks, and put a real cost on it. In about two minutes you’ll have the one number every security budget conversation is missing: the return — and the cost of not making it.