Most application-security teams live in a pile of scanner tabs: SAST in one console, SCA in another, container and IaC and secret scans somewhere else, each with its own IDs, severities, and export format. Nobody can answer the two questions leadership actually asks — how many real issues are open, and are we fixing them fast enough? — without a spreadsheet.
Talarity’s AppSec findings register is the answer to both. Every scanner feeds one normalized table: one deduped row per issue, each with a live SLA state, a status, and its repository where it has one. Where the scanner reported a severity — or a CVSS score one can be derived from — the row carries it. Where it reported neither, the row says Unrated rather than inventing a rating, which is a distinction the rest of this walkthrough depends on. This covers the whole loop — ingest, triage, SLA, and hand-off — from the point of view of an application-security engineer.
The register at a glance
Open Application Security → Findings & Supply Chain, on the Findings tab. The six headline cards answer the leadership questions immediately: Active findings, Critical (active), High (active), SLA breached, SLA at risk, and Accepted risk. Every one of them is a button — pressing Critical (active) filters the table to those three rows, SLA breached opens the tab that lists them. A line beneath the row says what they count and what they do not: the cards count the whole register you have access to, while the filters and tabs below narrow the table only. That sentence exists because the two numbers legitimately disagree the moment you filter, and a page that lets you discover that by arithmetic has already cost you your trust in it.
The page is careful about what it does not know, and it distinguishes two kinds of not-knowing. On an organisation that has ingested no scan and recorded no finding by hand, the first card reads Not scanned rather than a zero — because “no findings recorded” and “no findings exist” are different statements, and only one of them is good news. On an organisation that has recorded findings by hand but still run no scanner, the counts are real and a different banner says what is unknown is coverage: nothing has been examined beyond what someone typed in, so the absence of further findings is not evidence that there are none. Below the cards, a posture-by-class strip shows where the open work lives — here SCA 2 · Container 3 · API 3, summing to the eight active findings — and doubles as a one-click filter.
If your organisation has linked accounts, your view of this page may be narrowed to the ones you can see, and a band under the header says so. When it is there, every figure below it means “of the accounts you can see” — and when it is absent, nothing is being withheld.
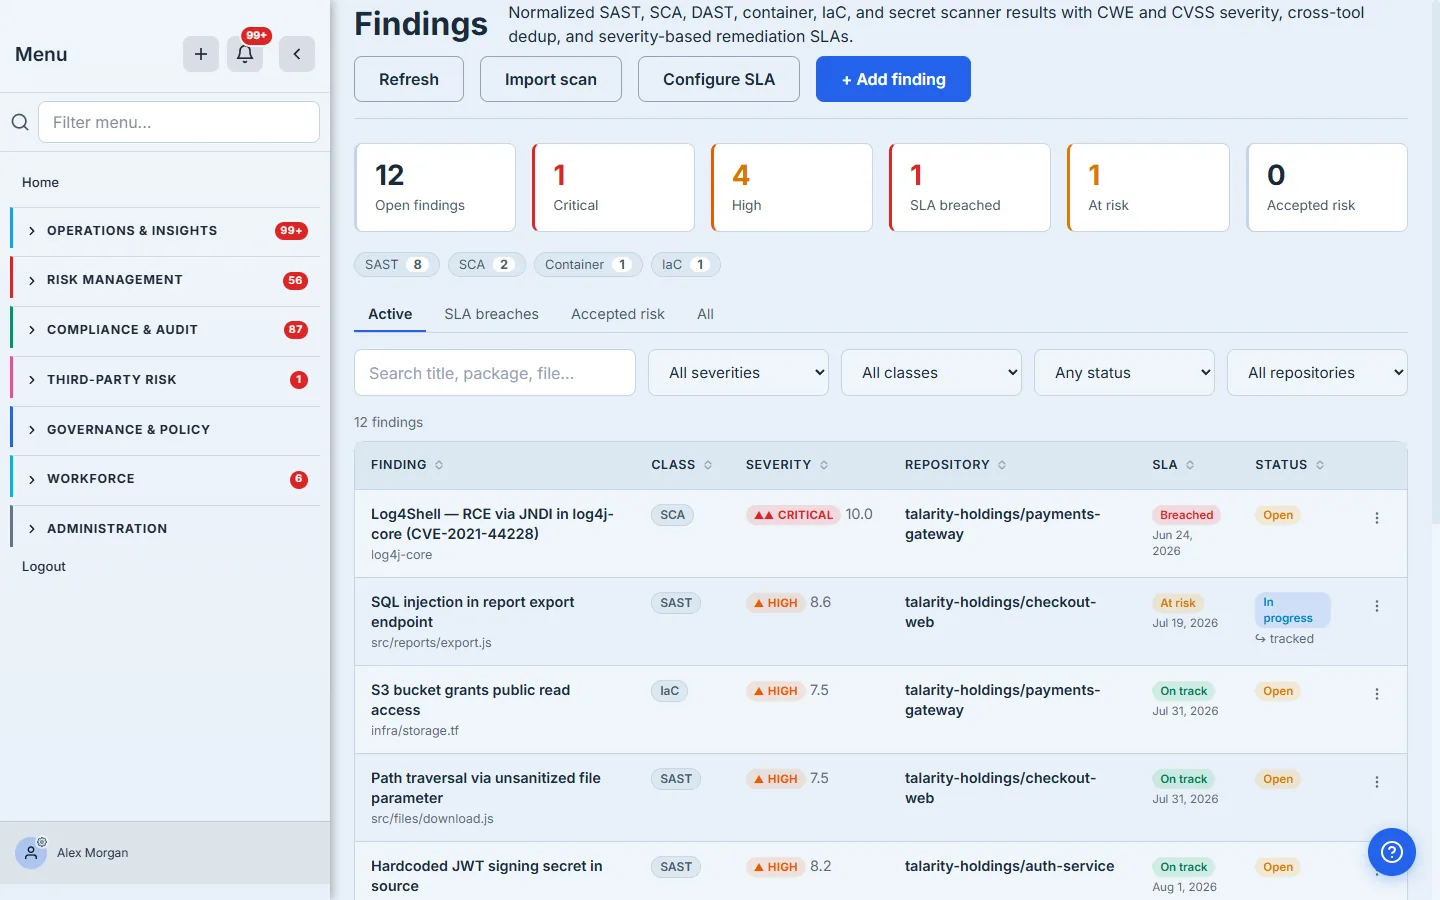
The four tabs scope the list the way a triage session actually runs: Active (open and in-progress), SLA breaches (overdue), Accepted risk, and All.
Step 1 — Feed it from your scanners
Click Import scan. Talarity ingests SARIF 2.1.0 (Semgrep, CodeQL, Snyk) plus the native JSON of Trivy, Grype, Checkov, tfsec, Gitleaks, and TruffleHog — pick the format, choose the finding class and — optionally, but read the next paragraph first — the repository, then paste the report or attach a file up to 10 MB. It maps each tool’s own model into the shared taxonomy: Trivy vulnerabilities become container findings, its misconfigurations become IaC, its detected secrets become secret findings. The secret value itself is never stored. What a secret finding keeps is the rule that fired, the file, the commit and the line — and, in place of the credential, a one-way hash of it, which is enough to recognise the same credential turning up again and useless to anyone who obtains the row.
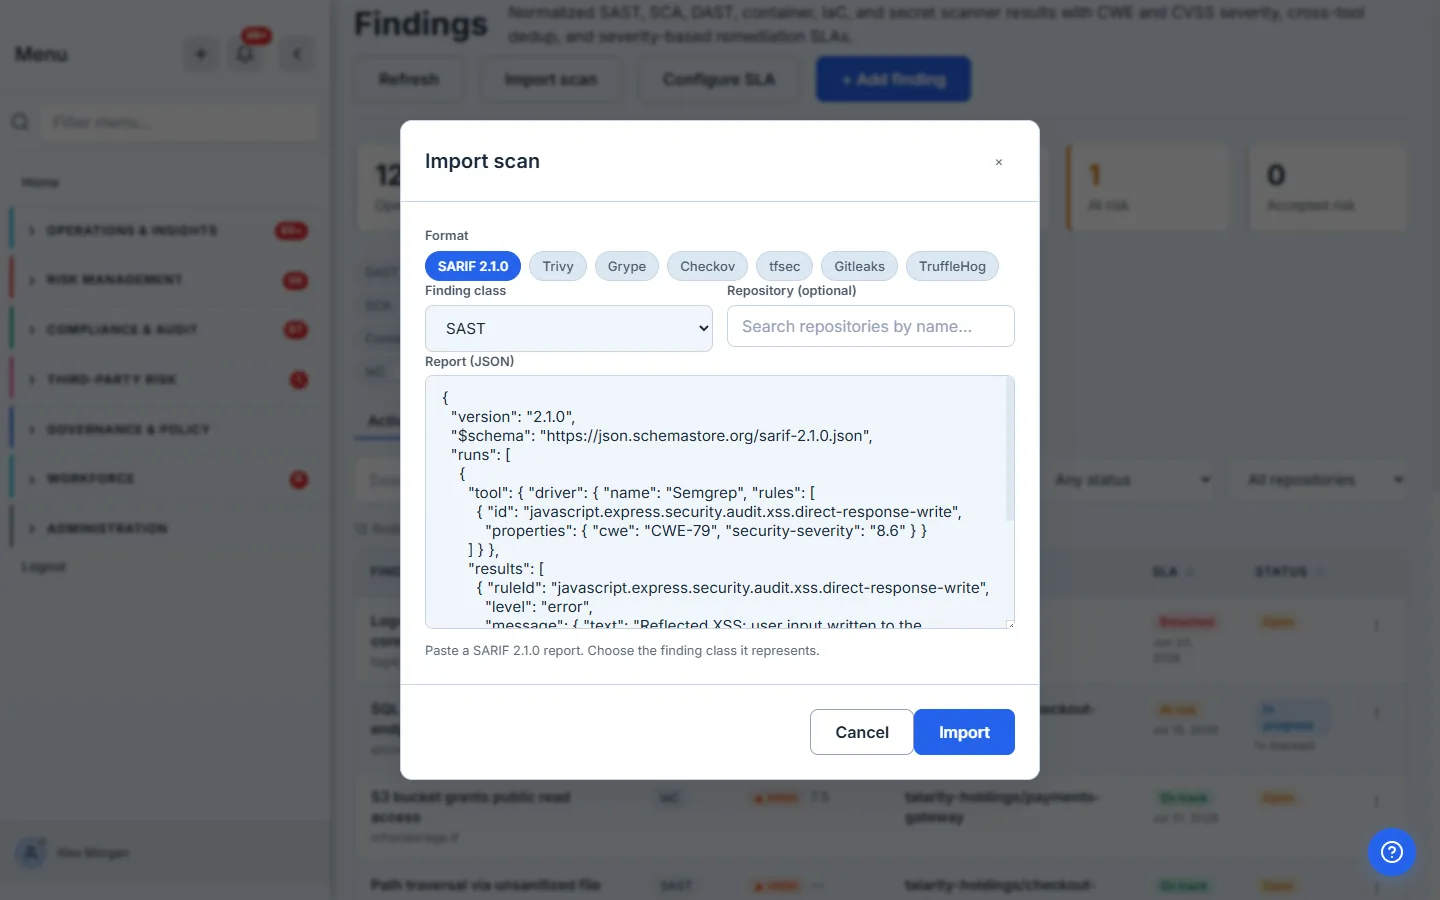
Import is idempotent. Every finding carries a stable fingerprint, so re-running the same scan updates the existing rows instead of duplicating them, and a finding seen by two different tools is merged into one row that keeps the higher severity and never downgrades a human triage decision. The fingerprint is a digest of seven things: your organisation, the repository, the finding class, the sorted list of CWE identifiers, the file path, the package and the normalized title. Knowing which seven matters, because each one is a boundary. Two scanners converge on one row when they agree on all of them — so two SAST tools that report the same flaw at the same path with the same CWE become one row, while two that classify it under different CWEs stay two. The same CVE seen once by a dependency scanner and once by a container scanner stays two rows for the same reason, and that one is deliberate: they are two places you have to fix it. And because the repository is part of the key, importing the same report twice — once before you had connected the repository and once after — gives you both sets. Choose the repository at the first import, or leave it off both times.
Pasting a report is the universal path, and it is not the only one. Beside it sits Live sync, which pulls directly from Snyk, SonarQube or Veracode, so a program that has standardised on one of those does not have to export anything by hand. Live sync is a platform-level integration rather than something you wire up yourself: the scanner credentials are held centrally by Talarity and each connector stays switched off until it is enabled, so if live sync reports itself unavailable that is a request to make of us, not a setting to hunt for in your own configuration. The register treats both the same way: same fingerprints, same dedupe, same merge rule. What you cannot do is read silence as safety, and the register refuses to let you: until something has been scanned, the page says its coverage is unknown rather than showing you a clean zero. Read that literally — it is a statement about the organisation, not a per-repository certificate. The posture views list the repositories that carry findings; a repository that appears nowhere has not been declared clean, it has simply never been looked at, and only you know which of the two it is.
Step 2 — Record what the scanners miss
Not every finding comes from a tool. Click + Add finding to record a pen-test result or a manual review by hand — a title and a severity, which are the two required fields, plus an optional class, repository (chosen by name, not an internal id), CVSS score, file path, package, and the CVE and CWE identifiers so it correlates with everything else. Every field the form will refuse to submit empty is marked (required) before you press anything, and the placeholders are format hints — CVE-YYYY-NNNN, CWE-NNN, 0.0 – 10.0 — rather than example values you have to notice are not yours.
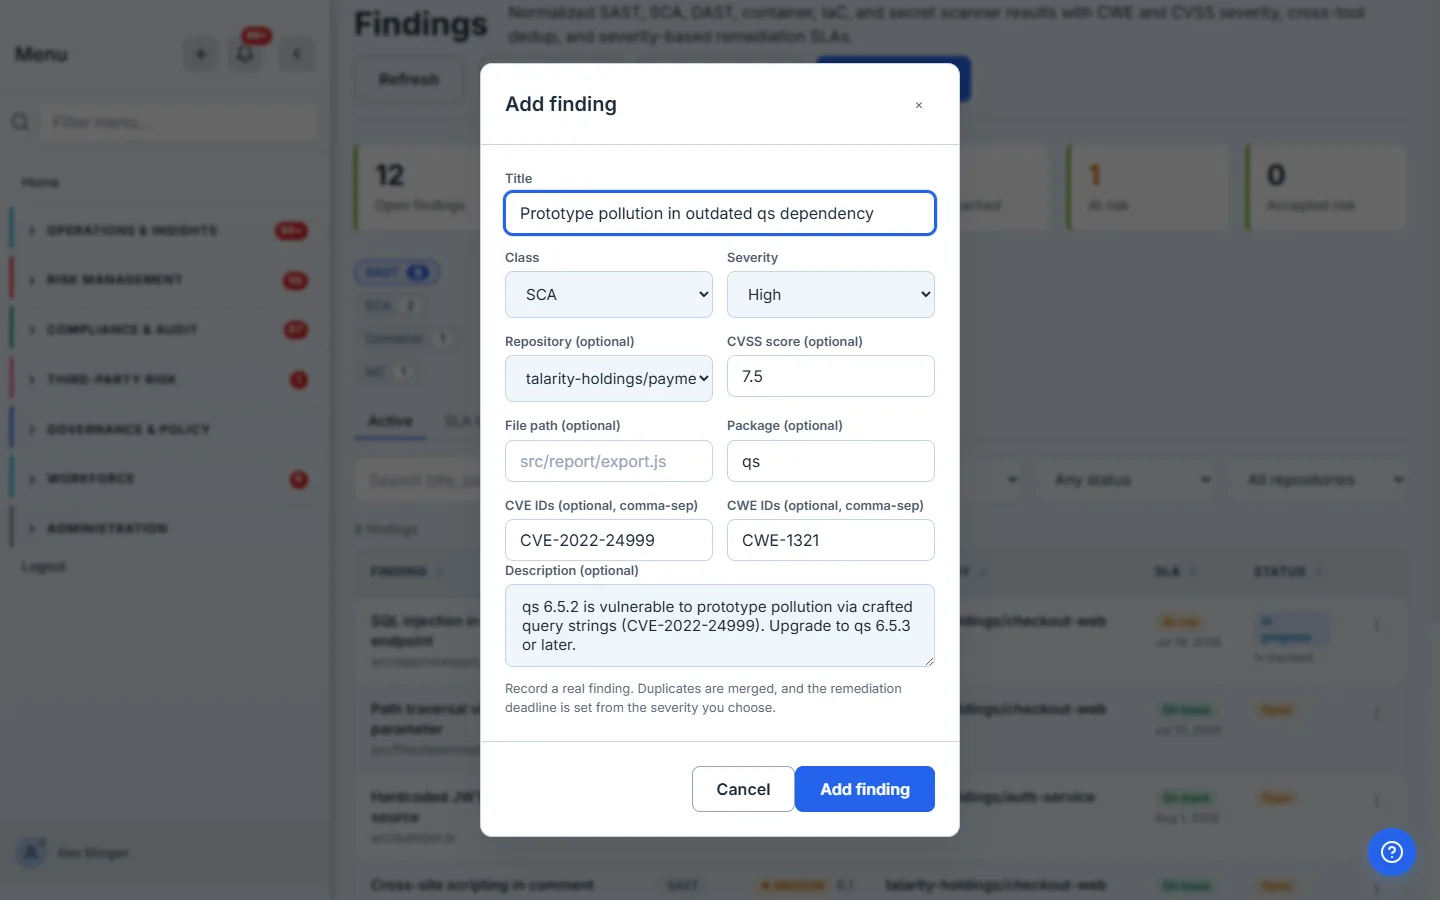
The remediation deadline is set from the severity you choose — with one exception the form states as you fill it in: Info carries no deadline at all. That is the whole point of the next step.
Step 3 — Triage from the row
Each row carries its own triage menu, so you never leave the table to move a finding through its lifecycle. The menu is built for the row it belongs to rather than being one fixed list. On the rated, hand-recorded finding below it offers six: Edit details, Change severity, Assign for remediation, Mark remediated, Accept risk, and Mark false positive. Edit details appears only on findings someone recorded by hand — a scanner’s row is the scanner’s account of itself and is not yours to retype. Change severity reads Set severity while the finding is unrated. Assign for remediation becomes Reassign for remediation once a work item already exists. A closed finding gets a shorter menu ending in Reopen finding, and a secret finding gains Mark credential rotated, then Verify old credential revoked, because a leaked credential is not remediated by deleting the line of code that exposed it.
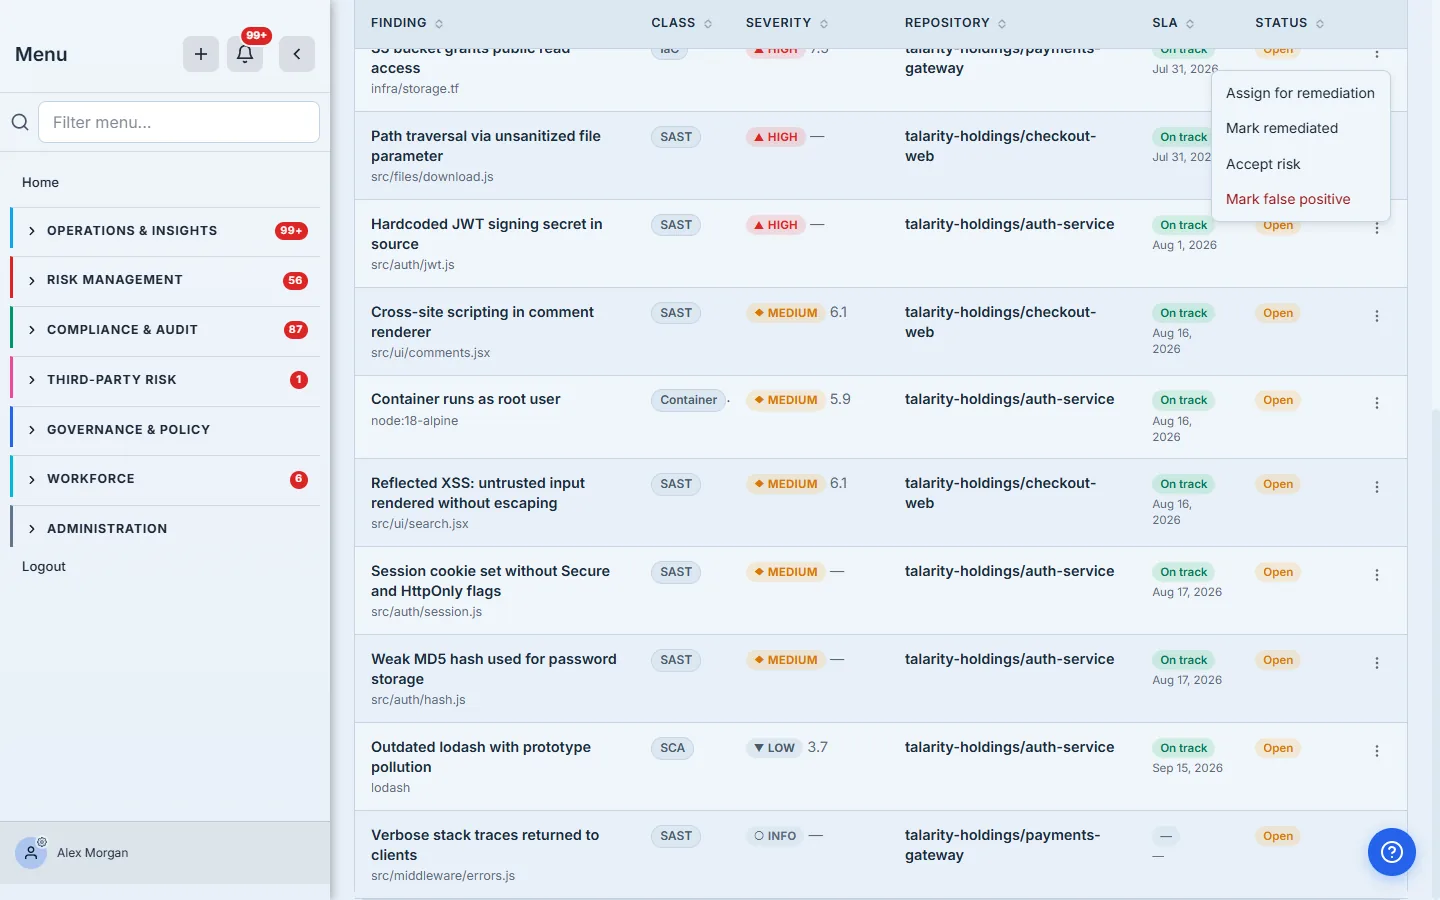
The table normalizes every class into the same columns. The severity column pairs the qualitative band (Critical/High/Medium/Low/Info) with the score, labelled CVSS 10.0 rather than left as a bare number, and shows nothing at all where the scanner supplied none — so a “High CVSS 7.2” and a High with no score are distinguishable at a glance rather than by guessing what a dash meant. The SLA column reads On track with the due date beneath it, or No deadline where the severity carries none. The status column shows a ↪ tracked marker once a finding has a remediation work item, so you can tell which findings are already in someone’s queue, and a Still detected marker if a later scan keeps seeing a finding somebody has already marked remediated — which is the only fix-verification signal a register can honestly offer. Clicking the finding’s title opens its drawer, where the description, the location, the version the fix lands in, every CVE and CWE, the CVSS vector, each tool that reported it, and the reason it was accepted or dismissed are listed together.
The same menu is where an Unrated finding gets resolved. A scanner that reports no severity and supplies no CVSS score leaves the row genuinely unrated, and an unrated finding carries no remediation deadline — so it will sit outside your SLA numbers until a human decides what it is. The banner above the table says how many there are and carries a Show unrated finding button that filters straight to them; Set severity — the name that same menu item takes on a row with no rating — is the decision itself. The deadline it then gets is measured from when the finding was first seen, not from when you rated it — so a month-old finding you rate today is already a month into its window, and if that window has fully elapsed it starts a fresh one rather than landing pre-breached. Triage delay does not buy back time, which is the behaviour you want: the clock belongs to the risk, not to the moment someone got round to looking at it.
Step 4 — Put every severity on a clock
Findings without a deadline never get fixed. Click Configure SLA to set your organization’s remediation window per severity — the platform defaults to 7 days for critical, 14 for high, 30 for medium, and 60 for low, and each field names its own default beside its label. Leave a field blank to inherit it; override it to match your own policy. Two properties of that change are worth reading before you make it: it applies to deadlines set from now on — new findings, re-rated findings and reopened ones — and leaves deadlines already set where they are; and Info carries no deadline at all, by design.
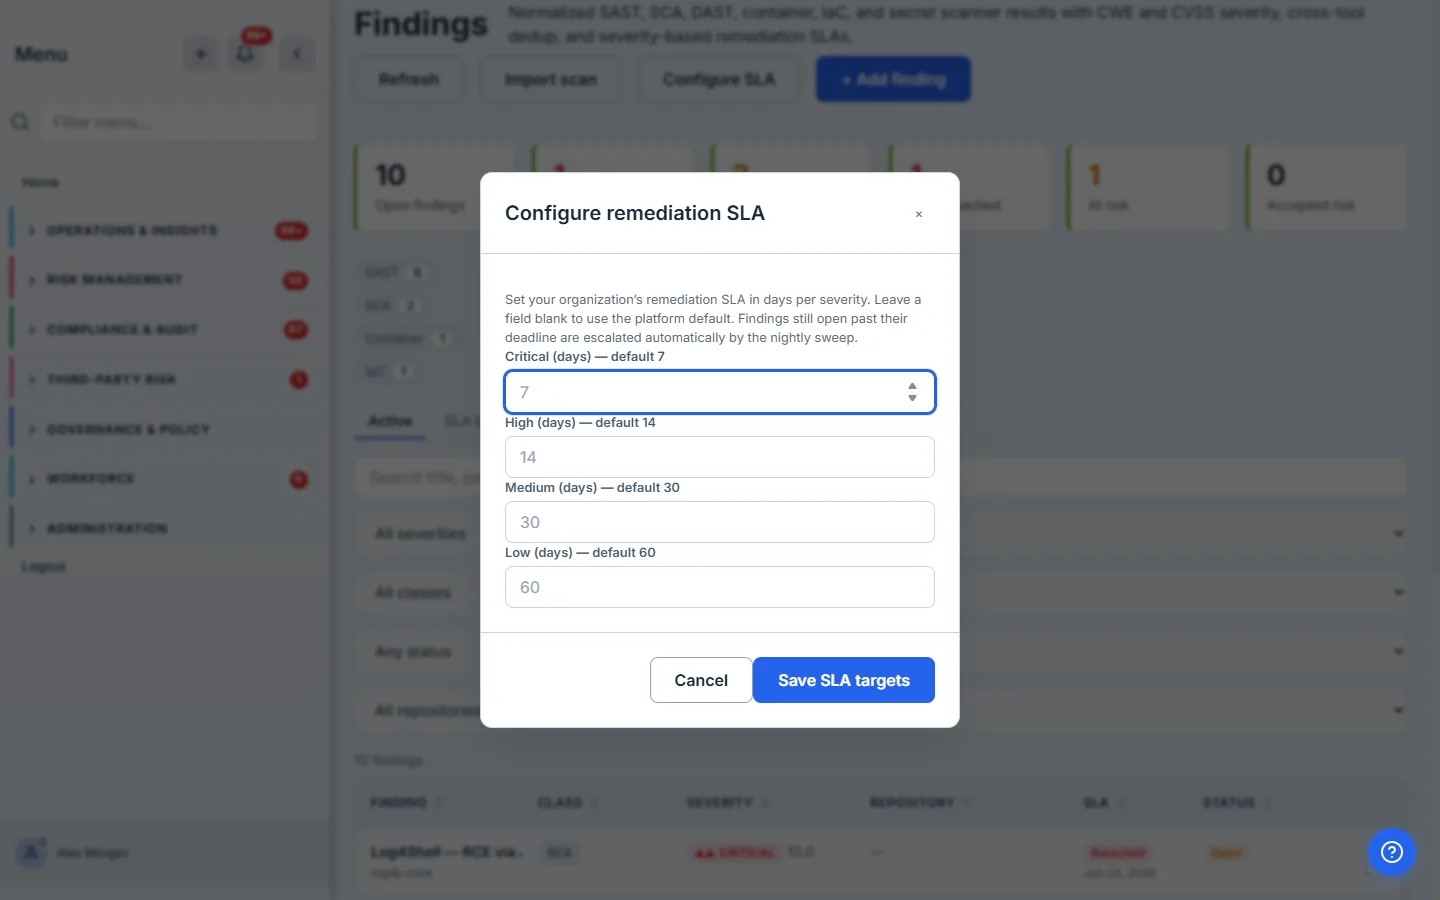
The two halves of an SLA behave differently, and it is worth knowing which is which. The due date is stamped on the finding when it is first seen — first-seen plus its severity’s window — and then it stays put; it is re-derived when the severity changes or the finding is reopened, and at no other time. The SLA state is not stored at all: On track, At risk (inside the final quarter of the window), Breached, or No deadline is computed on every query, so it is never a stale label left over from the last time something ran. A nightly sweep re-checks open findings against their deadlines and escalates the ones that have gone overdue, exactly once, so a breach is surfaced without spamming the same alert every night. The headline card is called SLA at risk where the row’s own chip reads simply At risk; they are the same state counted two ways — the card over the whole register, the chip on one finding.
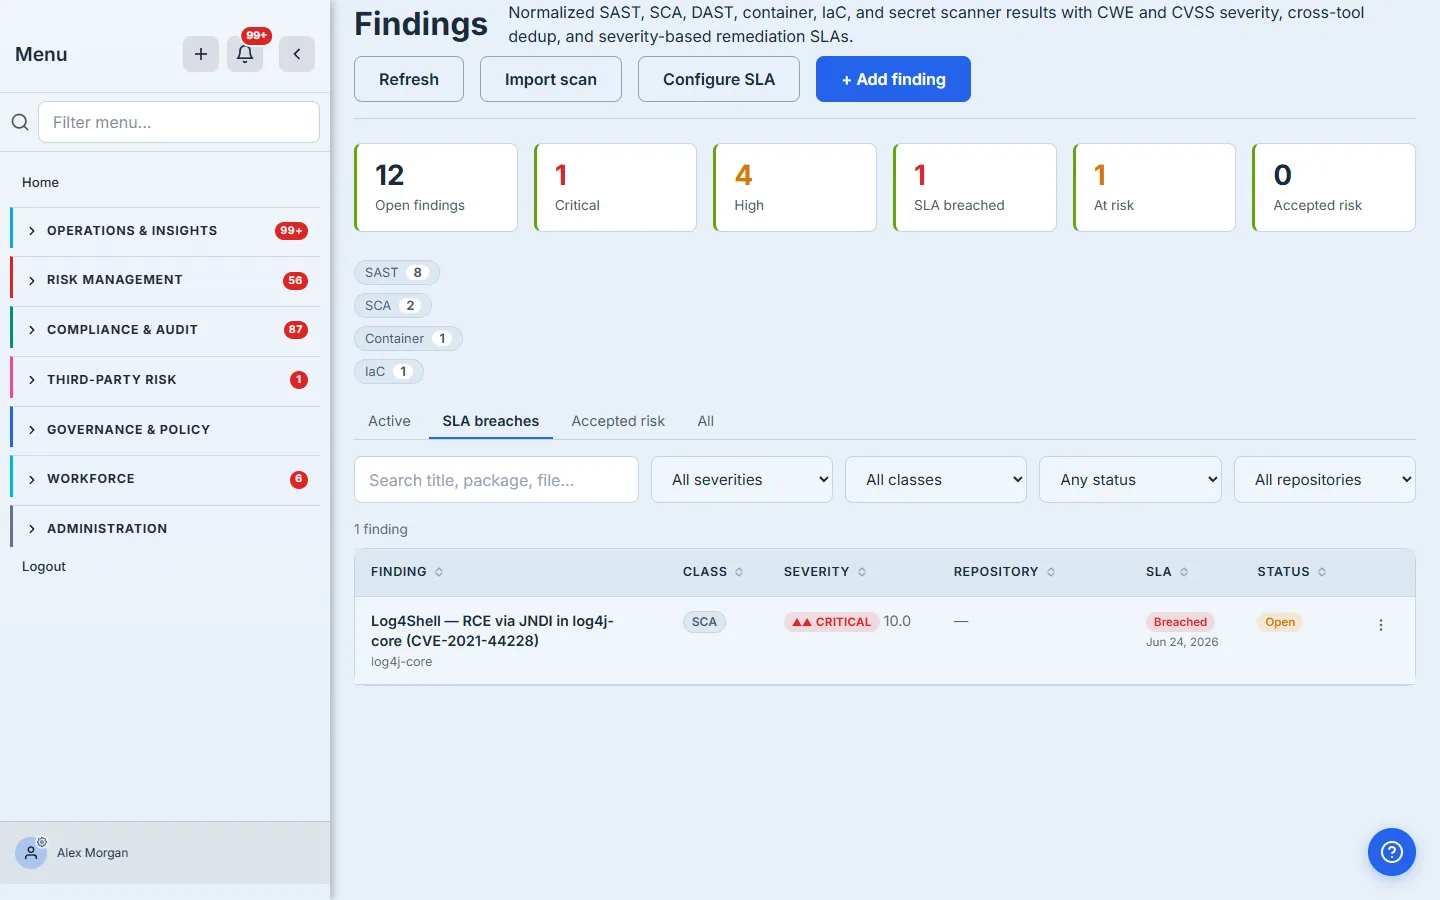
The SLA breaches tab is where you start a remediation stand-up: it shows only the findings that are already past their deadline — and when none are, it says so in those terms rather than rendering a blank panel, so “nothing is overdue” never reads as “nothing loaded”.
Step 5 — Hand it off, or close it with a reason
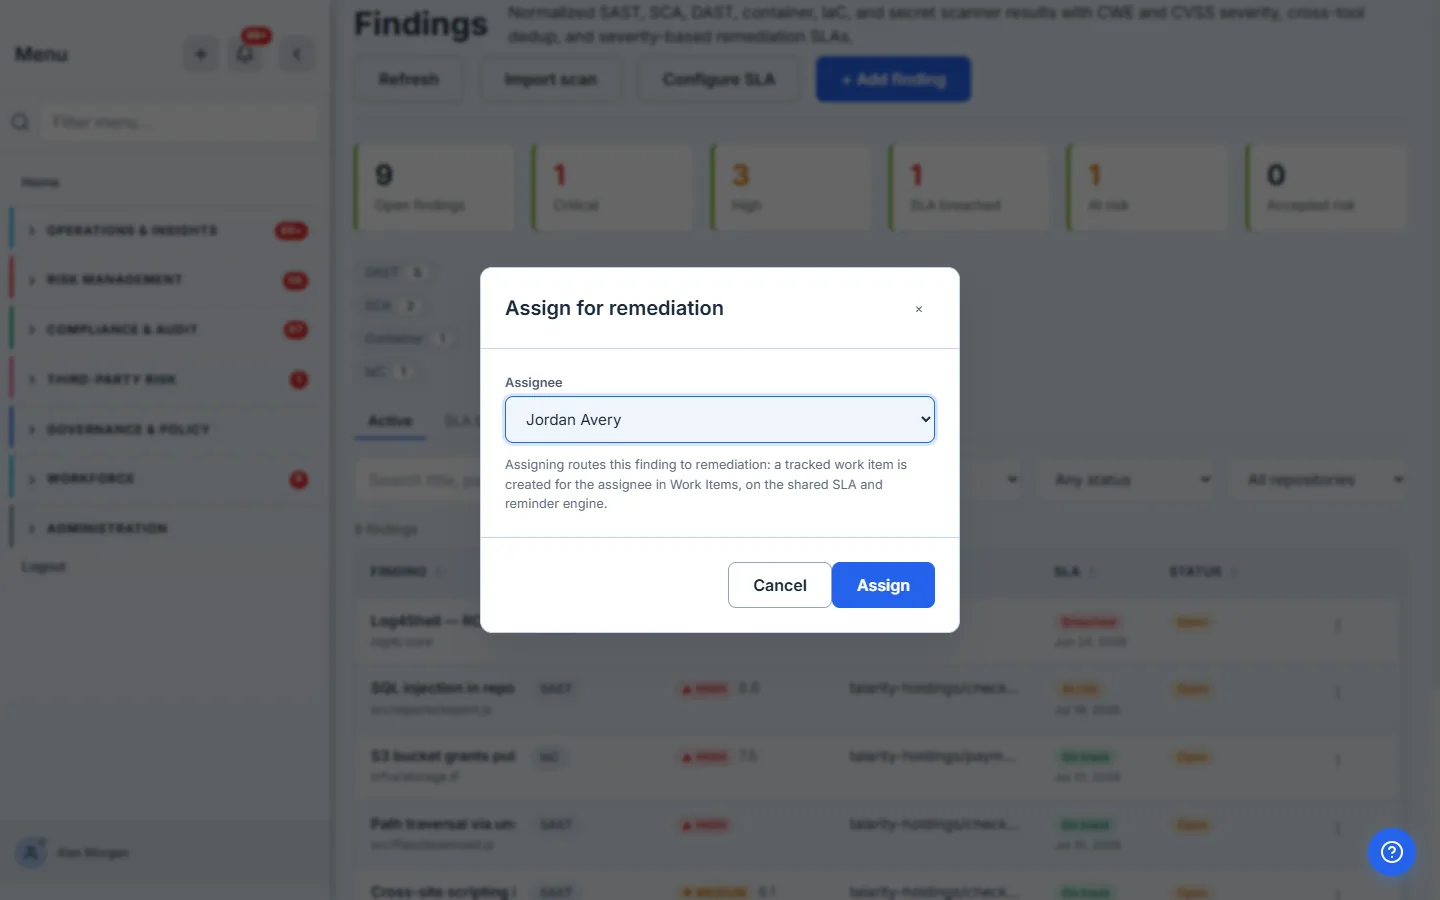
Assign for remediation routes a finding to a teammate. Pick the assignee by name; Talarity spins up a tracked work item for them in Work Items — on the same SLA and reminder engine as the rest of your governance work — and flips the finding to in progress with the ↪ tracked marker. Every one of these dialogs names the finding it is about in its first line, so a triage session that moves quickly cannot act on the wrong row.
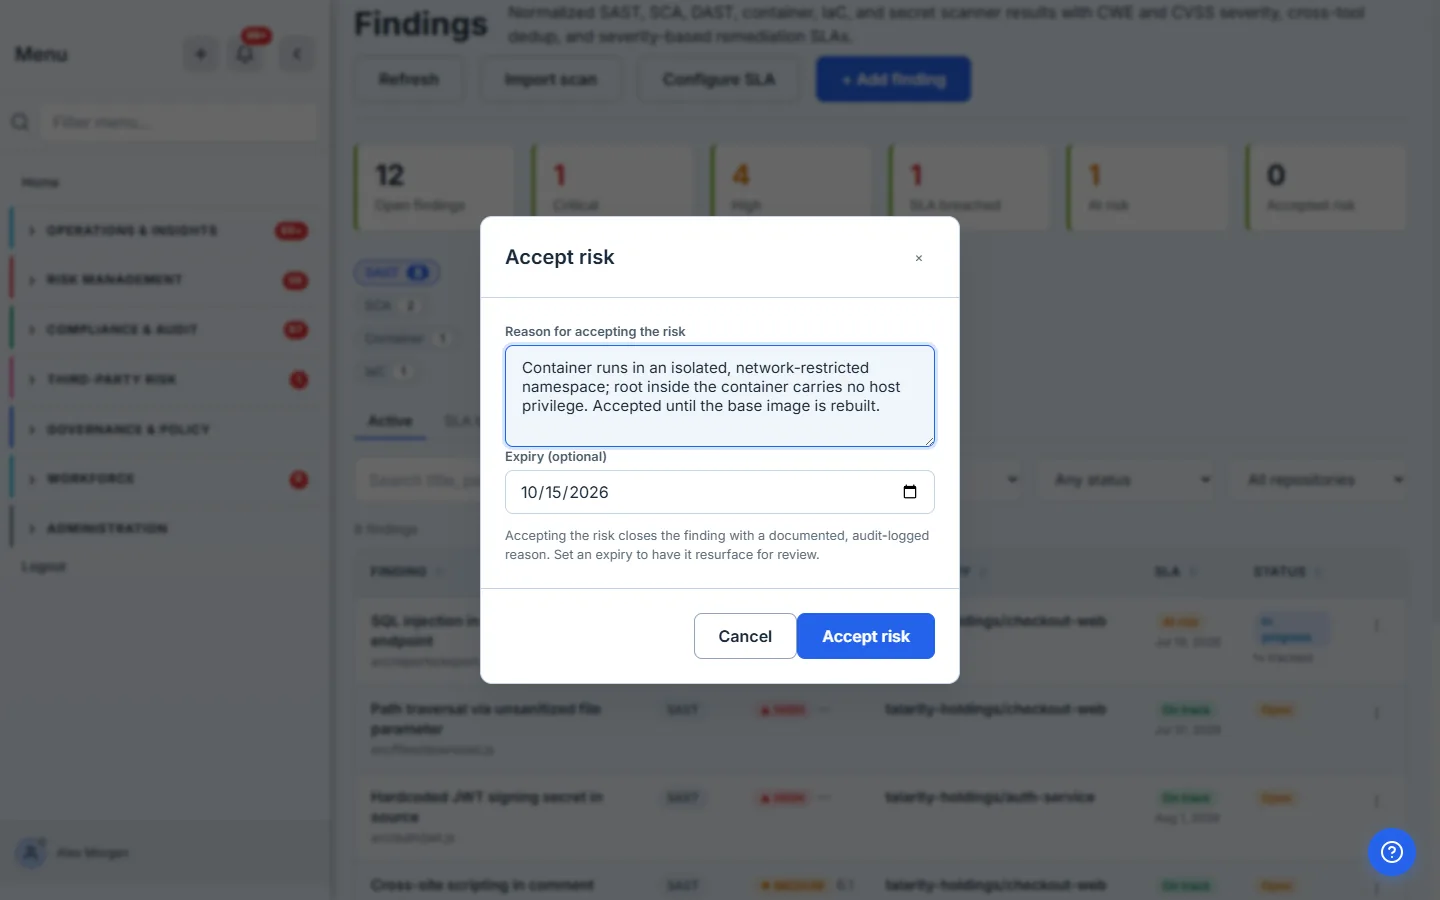
Not every finding gets remediated. Accept risk closes it with a documented, audit-logged reason and an optional expiry — and the expiry is not decoration: the finding reopens for review automatically the night after it lapses, so the decision resurfaces instead of quietly ageing forever. Leave it blank and the Accepted risk tab says so in as many words, printing No expiry — permanent where it would otherwise show a date, which is the honest rendering of a decision nobody has agreed to revisit. You can reopen an accepted finding by hand at any time.
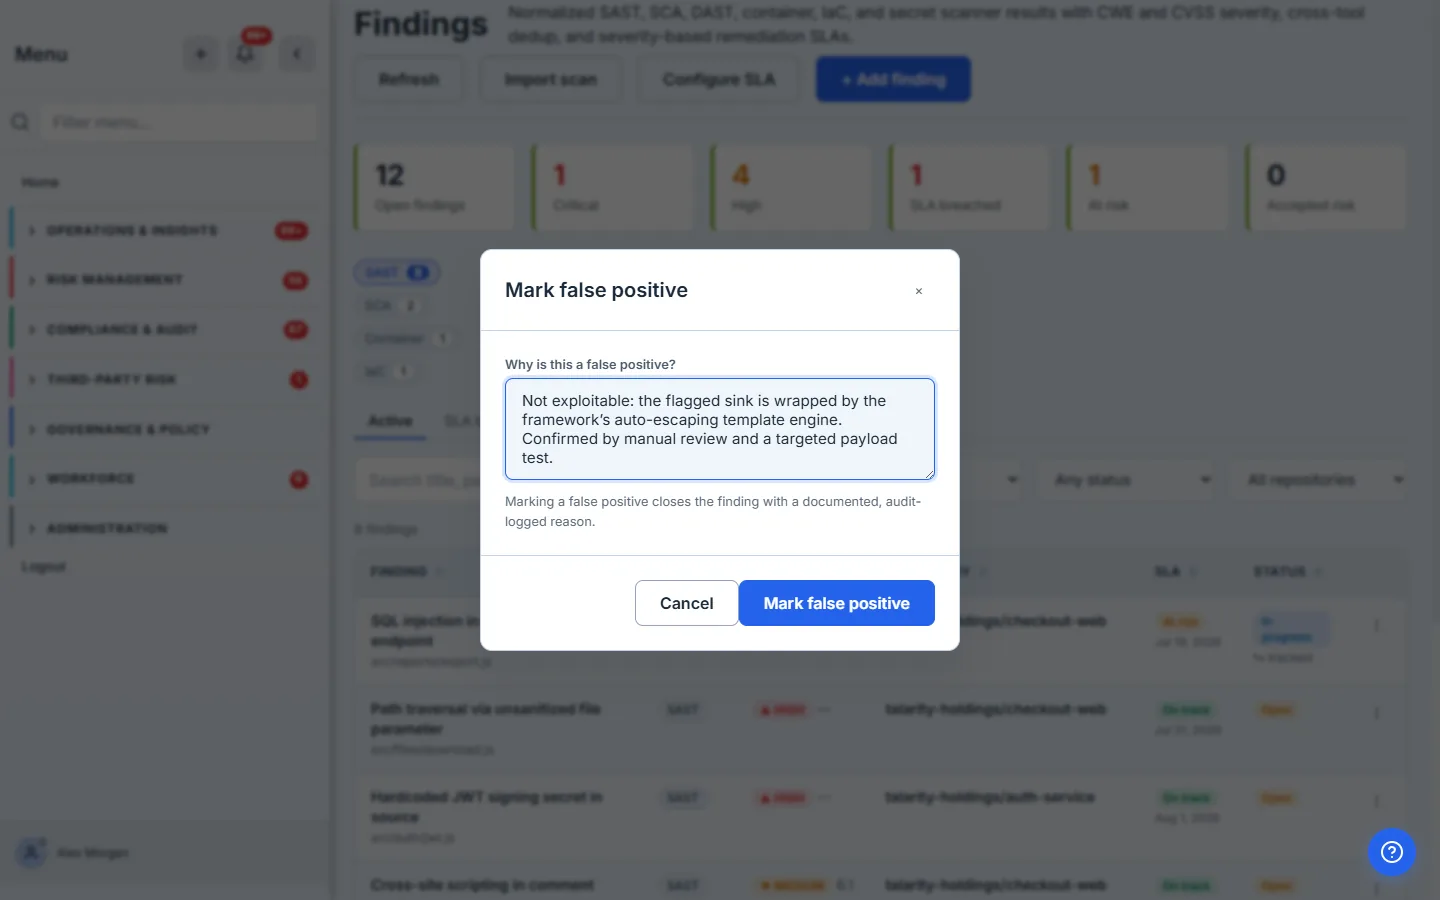
Mark false positive closes it with a documented reason too — because “we looked and it isn’t exploitable” is a decision your auditor will ask you to justify, and Talarity keeps the justification. It is the one destructive item in the menu, and its confirming button is styled as one.
Step 6 — Find the work that matters
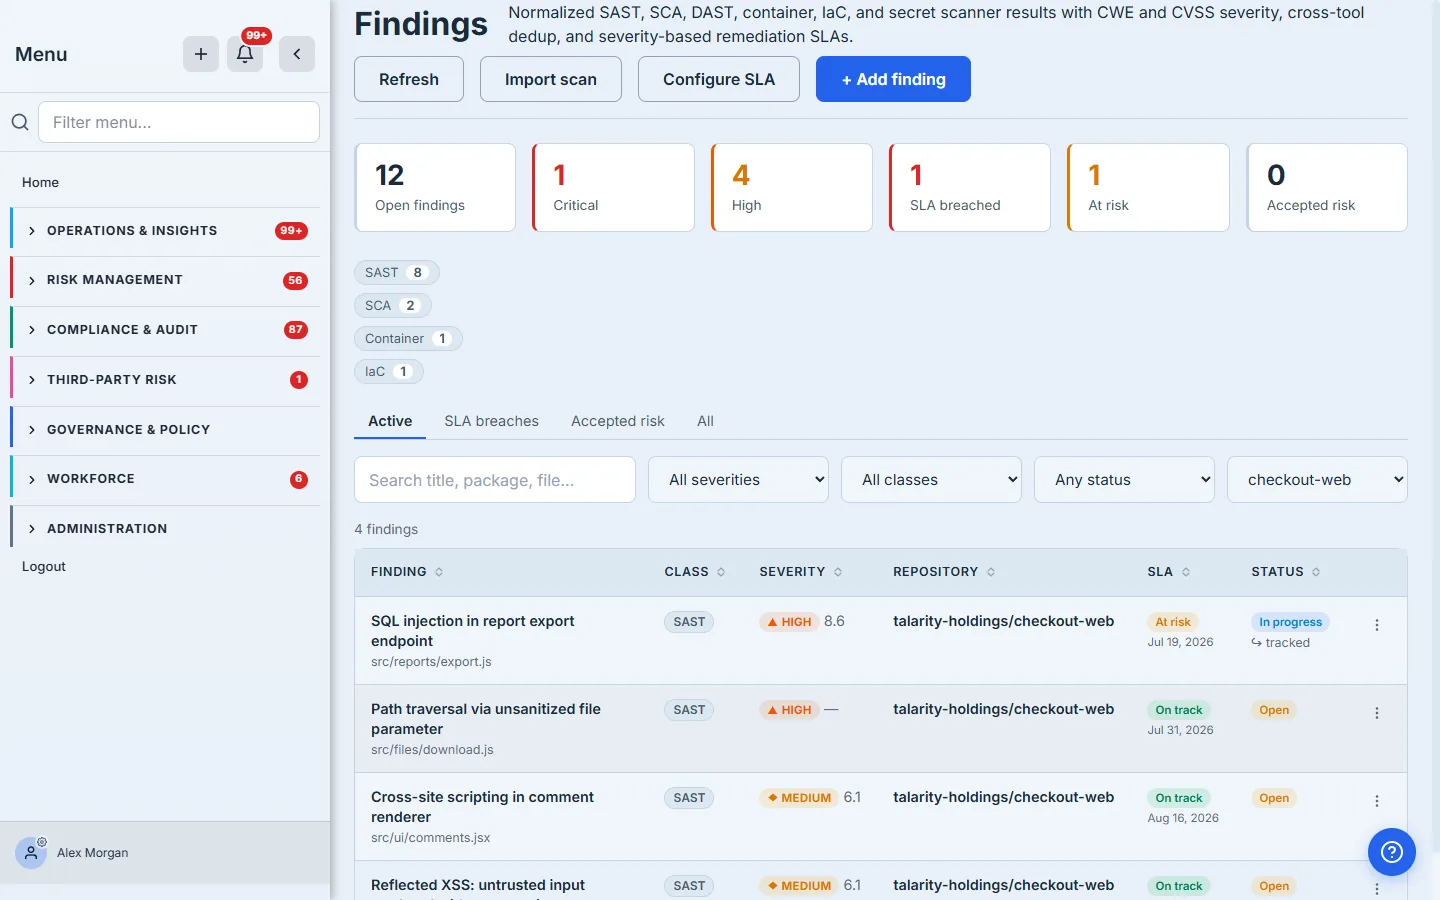
A large register needs to narrow fast. Filter by severity, class, status, repository or the tool that reported it — so you can pull “every open finding in the checkout service” in one click. When a filter is on, the count line above the table restates what you are looking at, and Export CSV takes exactly that view out of the product.
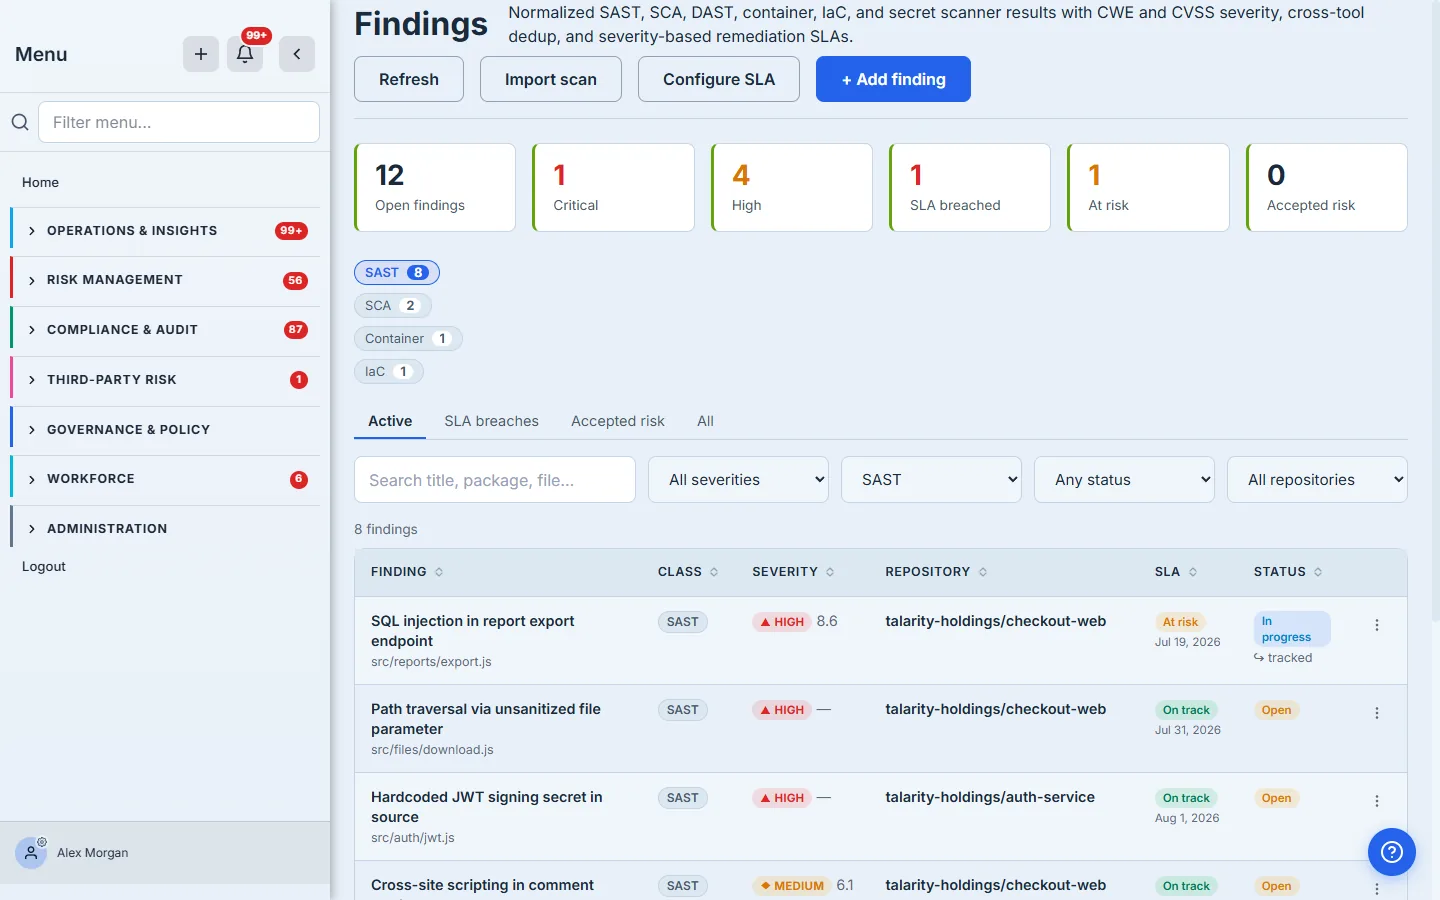
The posture-by-class chips are filters too: click SCA and the register narrows to your dependency findings, with the chip lit to show it’s the active filter and the Class select following it. The strip only renders classes you have open findings in, so on the Active tab — which is what it counts — it never offers a filter that would return nothing. It stays on screen on the other tabs, where that guarantee does not hold: the counts are still the open ones, so a chip pressed on Accepted risk narrows an already-closed population and can legitimately come back with none.
Two more controls matter once the register is big. The search box matches a finding’s title, package or file path; and the table pages, with a selectable page size and the range it is showing stated above it — so the count line means the same thing on a register of eight findings and on one of several thousand.
What you walk away with
A single register that every scanner feeds, deduped to one row per real issue, each with a status, its repository where it has one, and a one-click path to a tracked work item. A rated finding also carries a remediation deadline that a nightly sweep enforces; an Unrated one carries no deadline until someone triages it, so the register tells you what it does not know instead of quietly starting a clock it cannot justify. The two questions leadership asks — how much is open, and are we hitting our windows? — are answered by the headline cards, live, without a spreadsheet, and the view you are looking at leaves as a CSV when someone wants it in a mail.
Findings ingest maps to the OASIS SARIF 2.1.0 standard and preserves each tool’s CWE and CVSS metadata; severity uses CVSS 3.1/4.0 bands; and the remediation windows follow the standard practice of tying a fix deadline to severity so the highest-risk issues get the shortest clock.