Every management system asks leadership to look at its measurements on a schedule. ISO/IEC 27001:2022 puts it in clause 9.1 (monitoring and measurement) and clause 9.3 (management review); SOC 2 asks for it in CC4.1 and CC2.2; NIST CSF 2.0 gives it a category of its own, GV.OV. None of them says which measurements. That is decided by the meeting you actually run — a Monday risk review, a quarterly supplier committee — and no delivered dashboard knows its agenda.
So Talarity lets you build your own. A dashboard is kept in the same report library as your report templates, arranged in the same builder, and opened live on your current data — and it says, on the page, when its figures were read. This walkthrough builds one from a blank page — a weekly risk review — then publishes it, opens it, shares it, and shows the other way to start: a copy of a dashboard Talarity delivers.
Who’s involved
- The dashboard’s author — usually the person who chairs the meeting. Building one needs edit access to reports; without it, the library says so where the create buttons would be. The dashboard stays the author’s alone until they share it.
- Colleagues — open it once it is shared with them, each seeing the figures their own access allows.
- People outside the organisation — a board member or an assessor can be given a read-only, time-limited link.
- Auditor — once the dashboard is shared with the organisation, reads its version history (who published which arrangement, when, and why) and its Activity log.
Step 1 — Start from the library
Dashboards live in the Report library, beside report templates. Filter it to Dashboards only and the count line says how many there are out of the whole library; Start a blank dashboard is the button above the list.
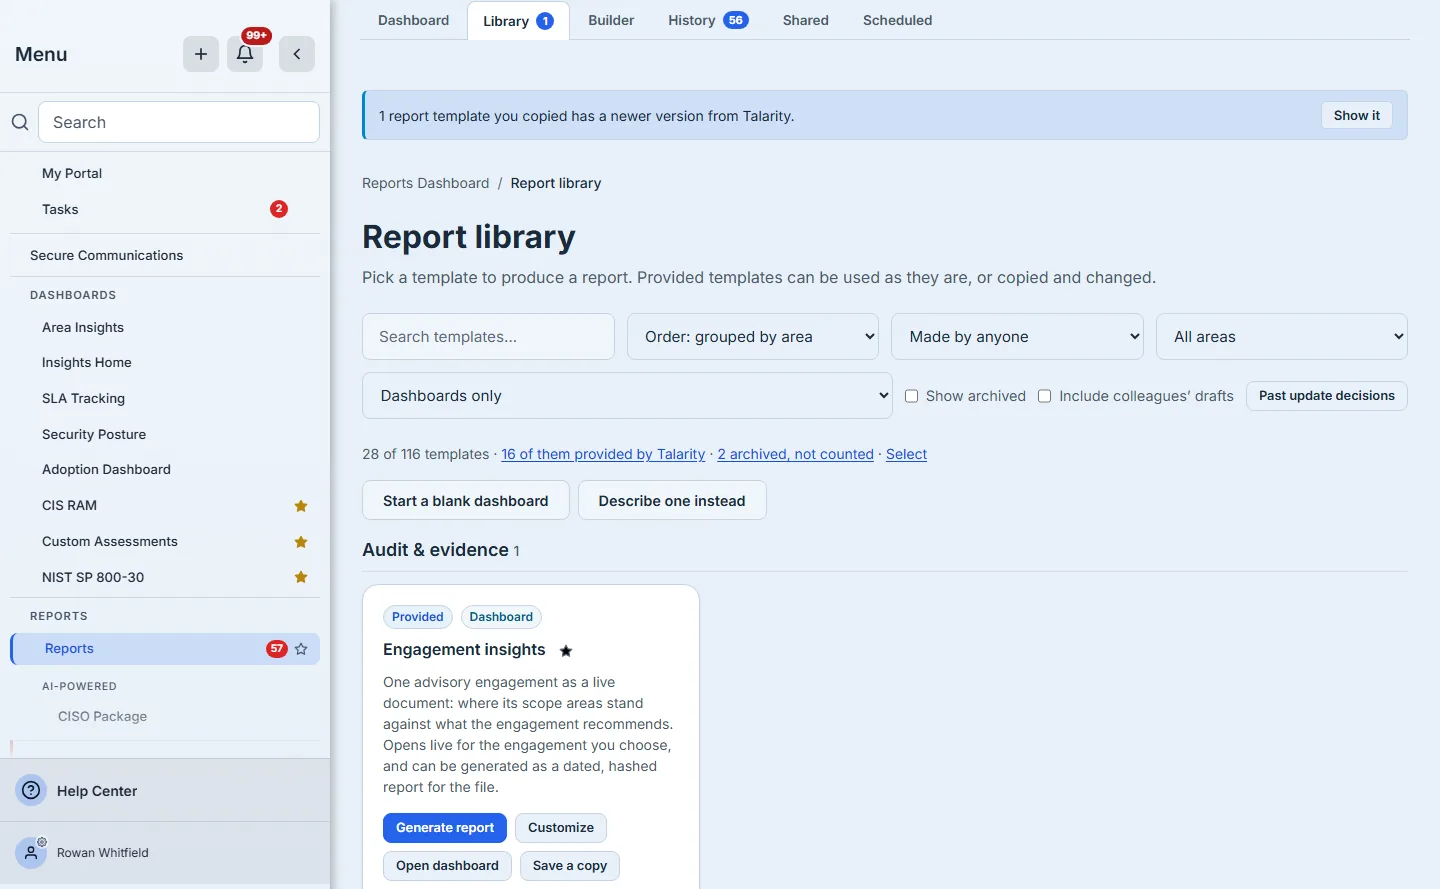
A dashboard and a report template are the same kind of thing in Talarity — a layout of blocks that read your data — with one difference: a report is generated once and becomes a dated record, while a dashboard shows your current figures whenever it is opened. Keeping them in one library means one search, one set of filters and one archive.
Step 2 — Name it
The dialog asks for a name and the area of the programme it is about, and says what you are making before you make it: a private draft that “nobody else can open it until you choose to share it”, and a dashboard that is live — “it shows your current data whenever somebody opens it”.
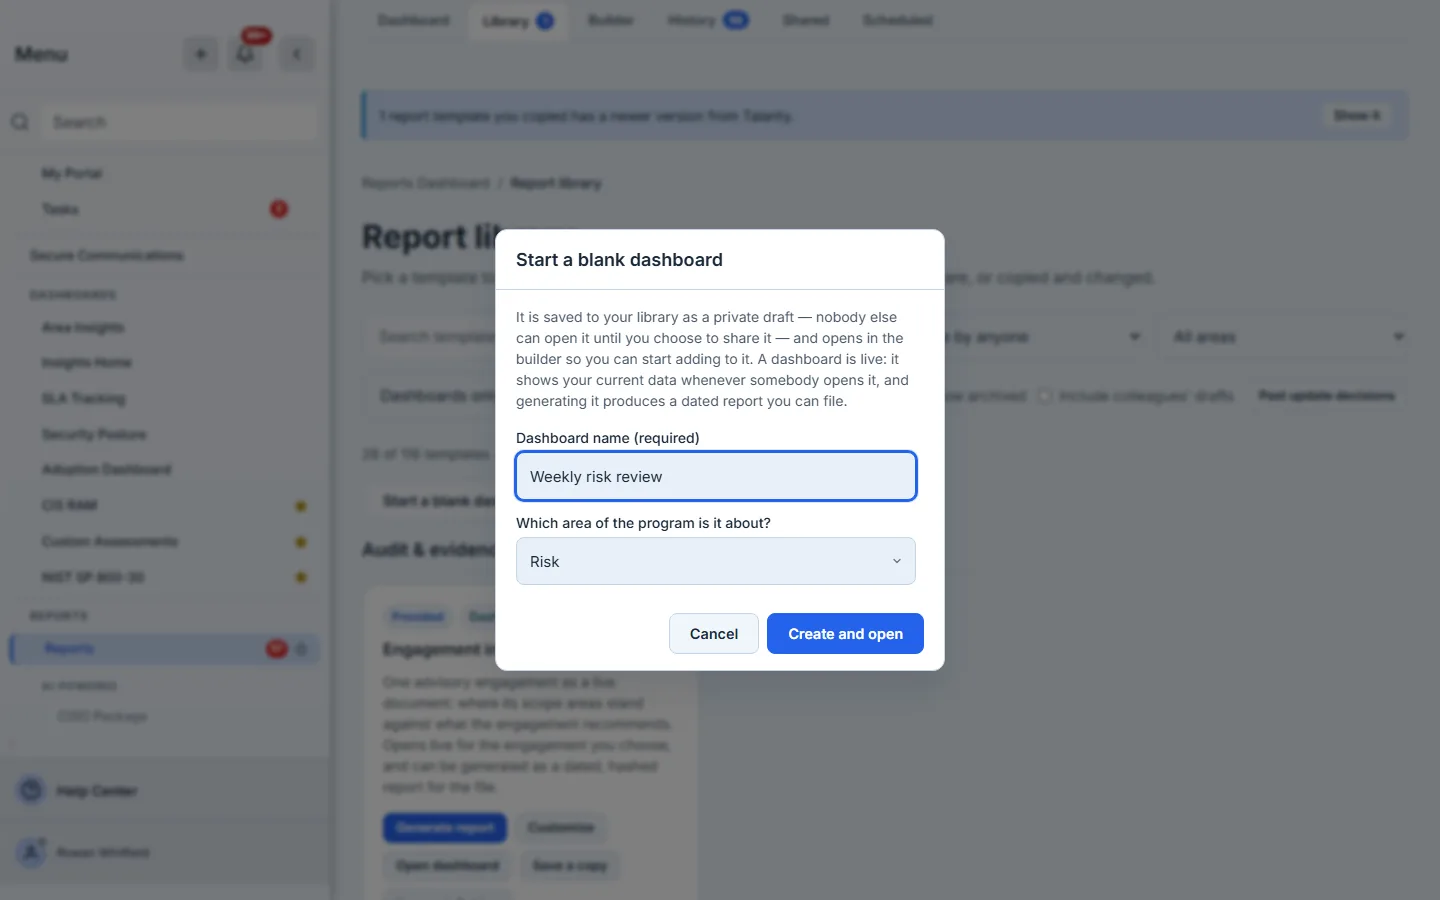
Create and open saves it to your library and opens it in the builder.
Step 3 — An empty dashboard in the builder
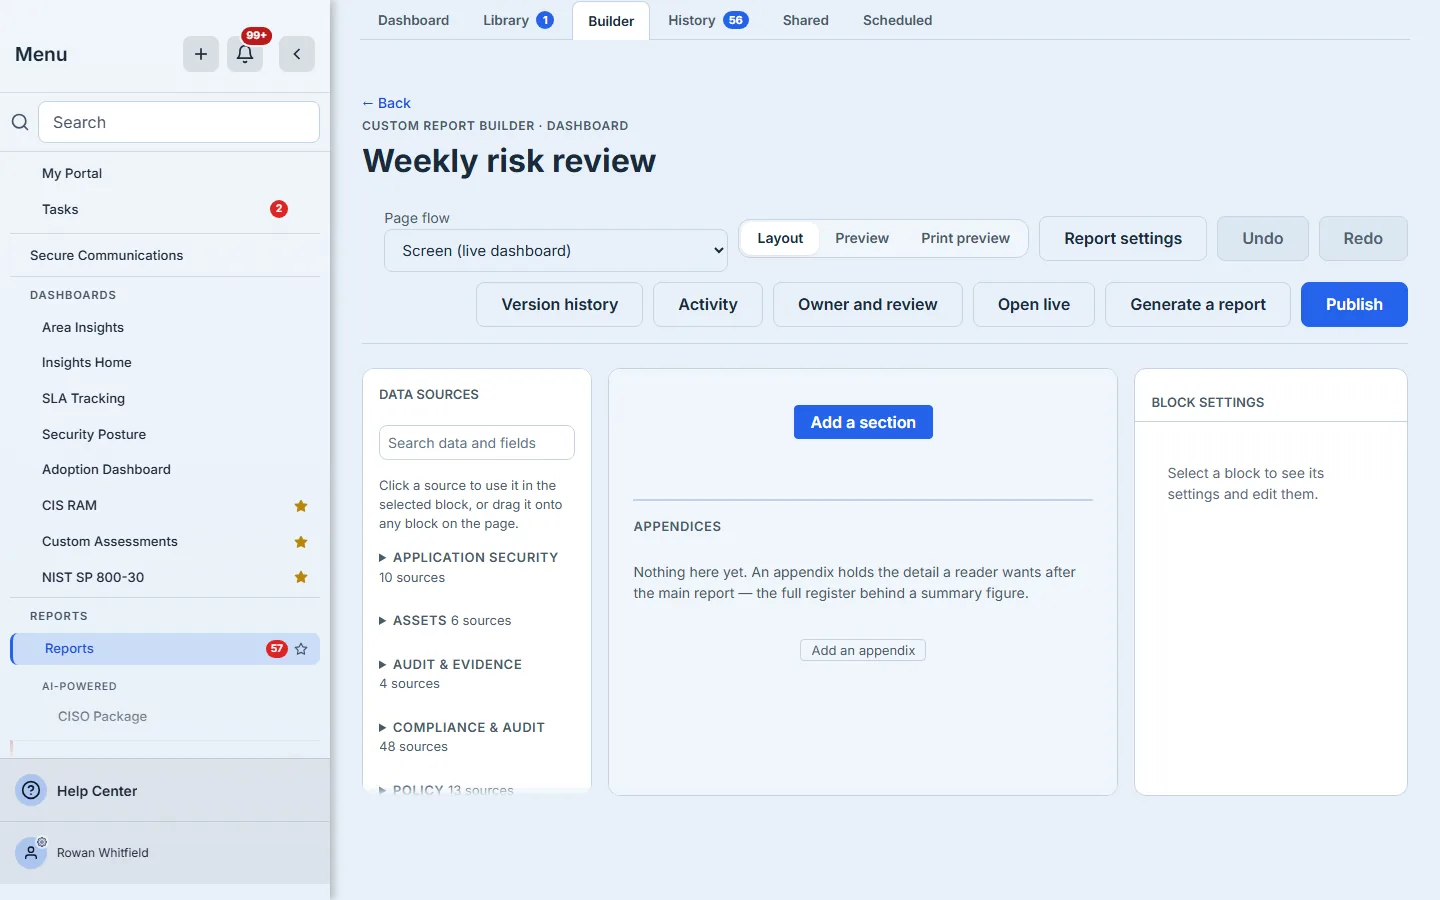
The builder opens with the page flow already set to Screen (live dashboard) — the setting that makes this a dashboard rather than a printed report — and nothing on the canvas but Add a section. Open live is already in the toolbar: the dashboard can be opened from the first minute, and shows whatever it holds when you do.
Step 4 — Add a block, and choose a widget
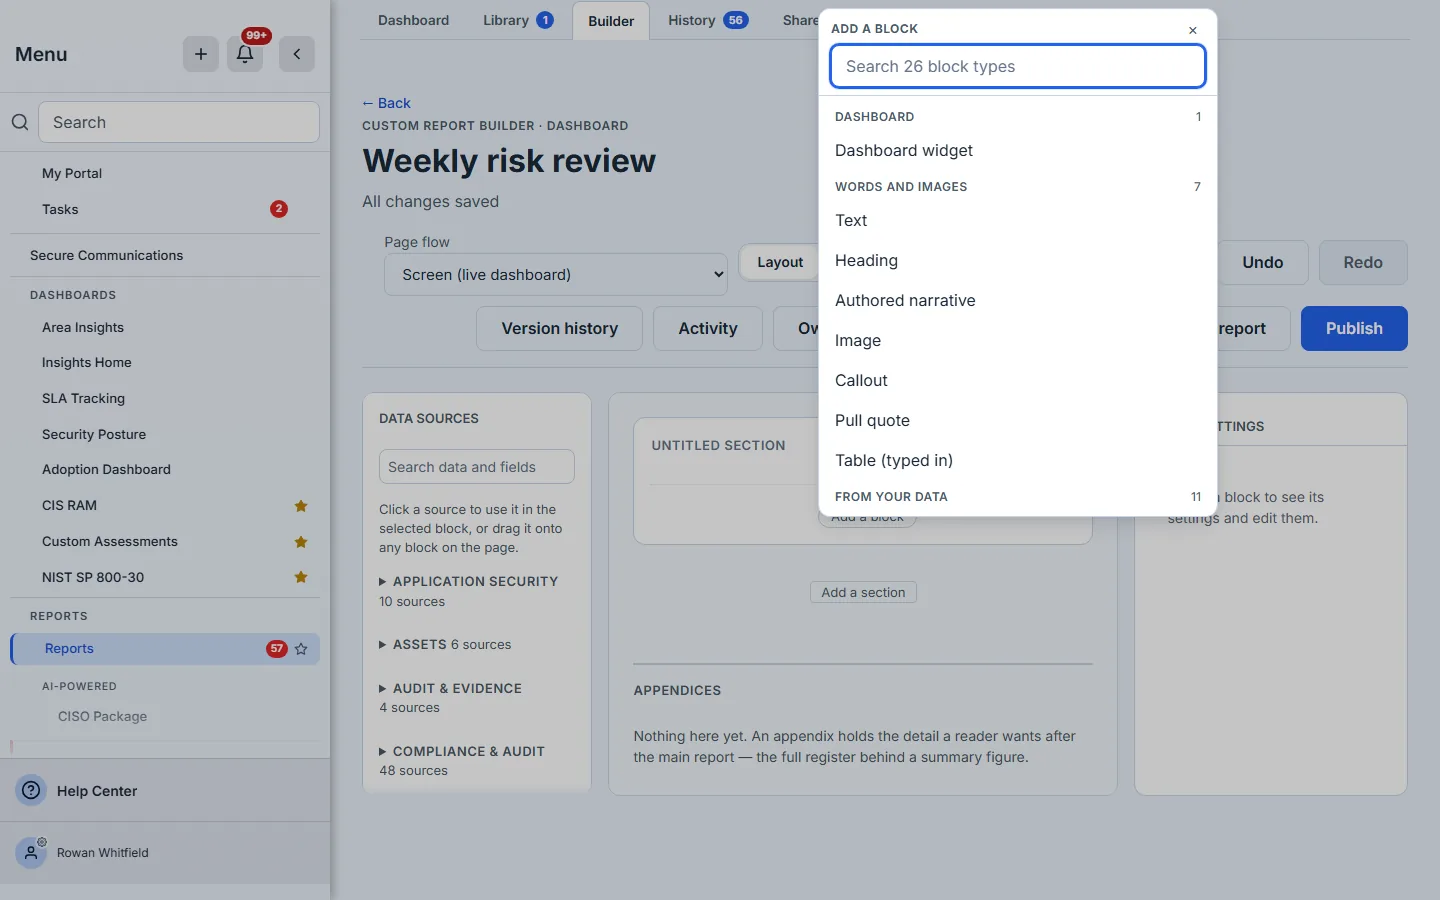
A section holds blocks. On a dashboard the block picker leads with Dashboard widget, because that is what most dashboards are made of; text, headings and the data blocks used in reports follow it.
A widget block starts empty. Its settings open the widget catalog, which is the same library of widgets the delivered dashboards are built from — and its count line tells you up front how many of the widgets it lists can be placed. Where a card has a picture, it is drawn from sample data, and the catalog says so: once placed, a widget shows your organisation’s own figures.
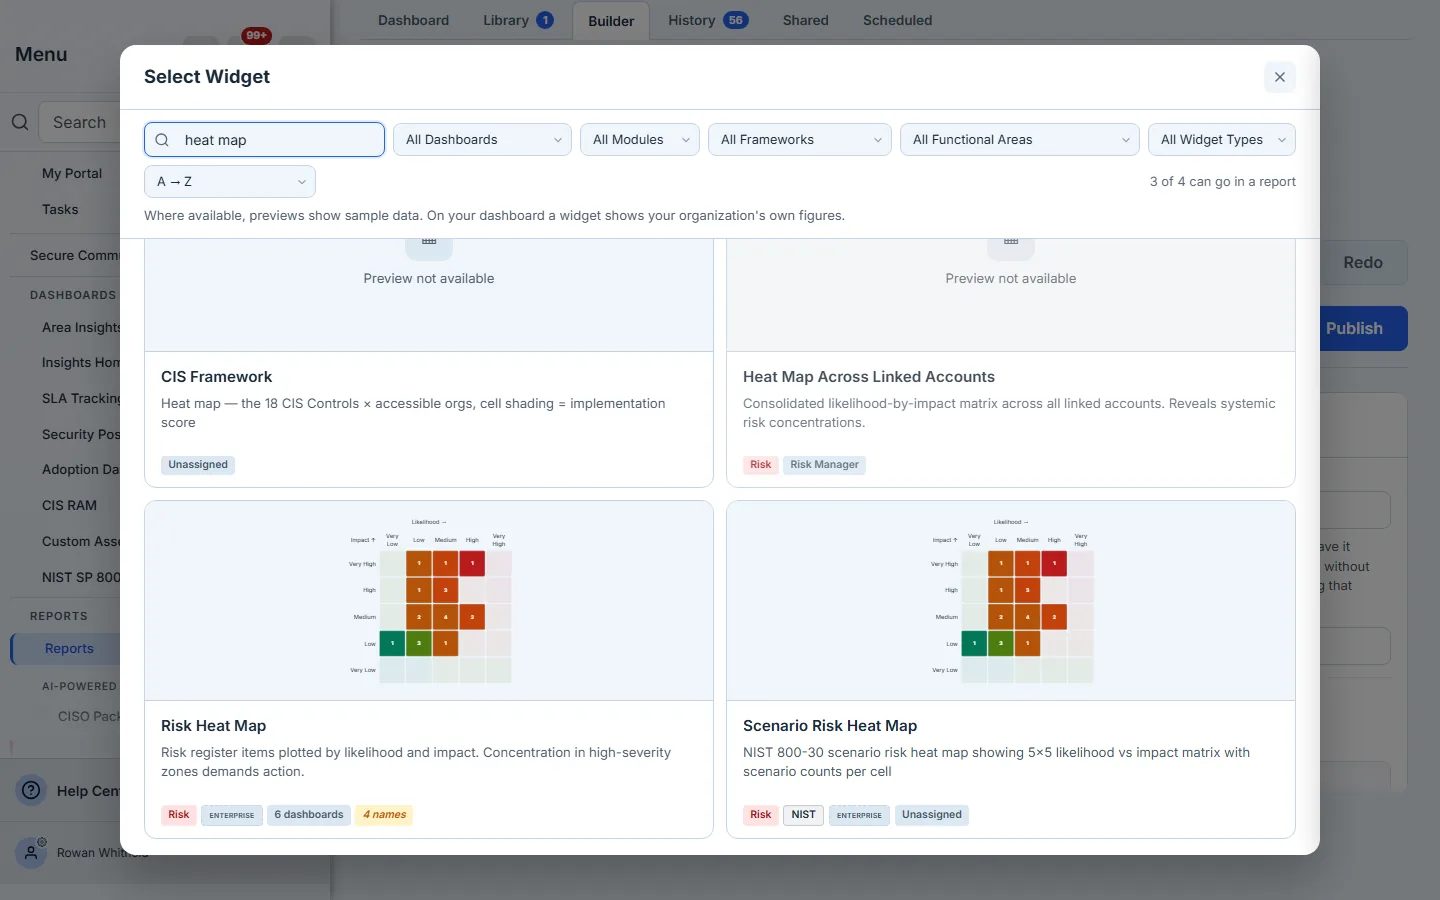
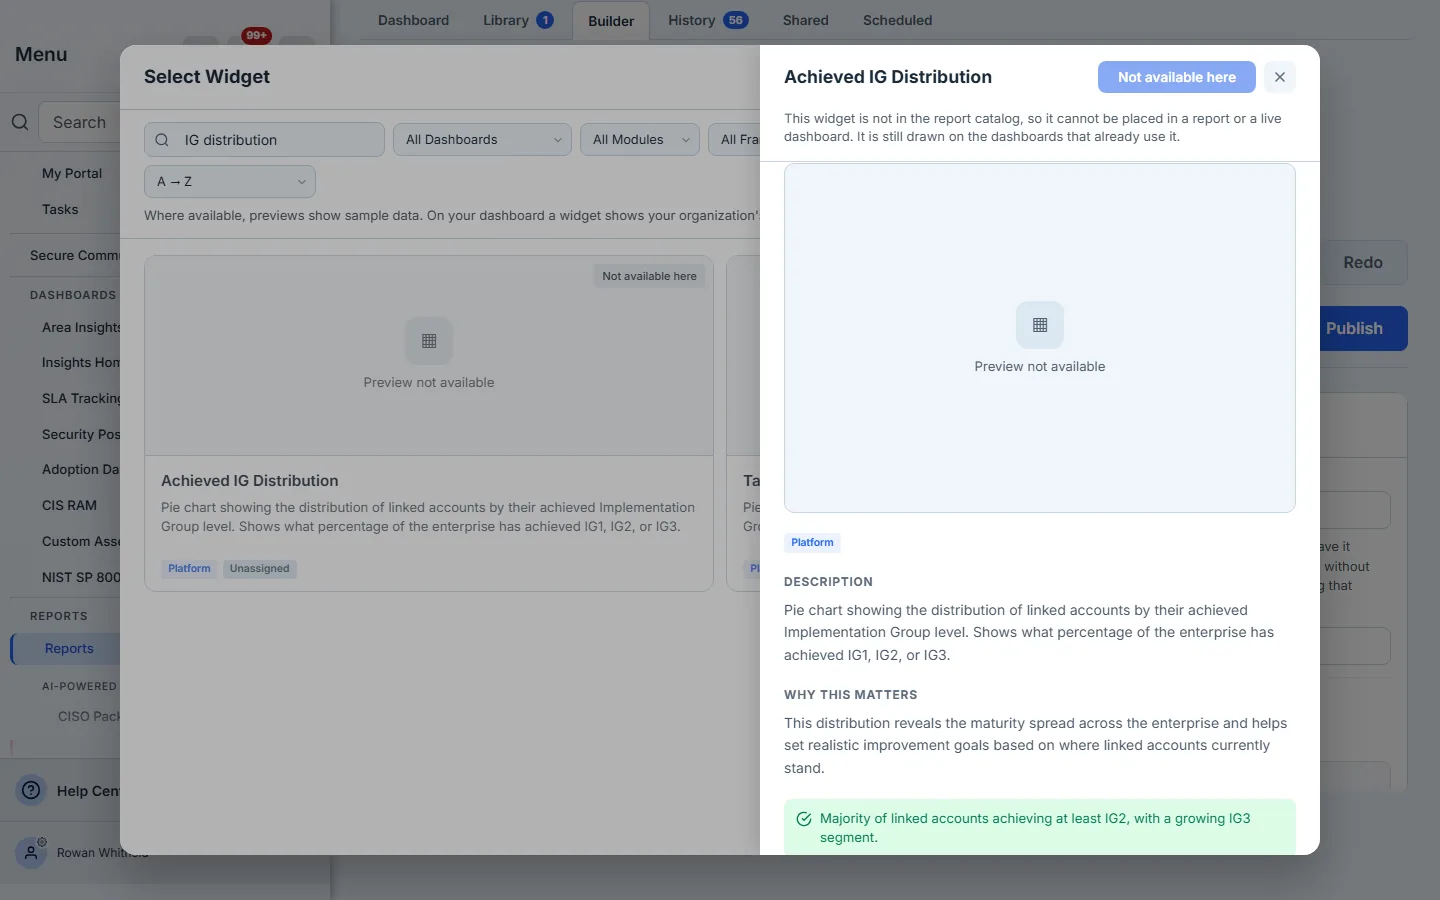
Not all of them can. A widget that draws only on the dashboard it was built for is marked Not available here, and its details say why, rather than letting you place it and find an empty box later. A widget from a module your organisation does not have is marked with the module it needs, and is not counted as one you can place.
Step 5 — Arrange it
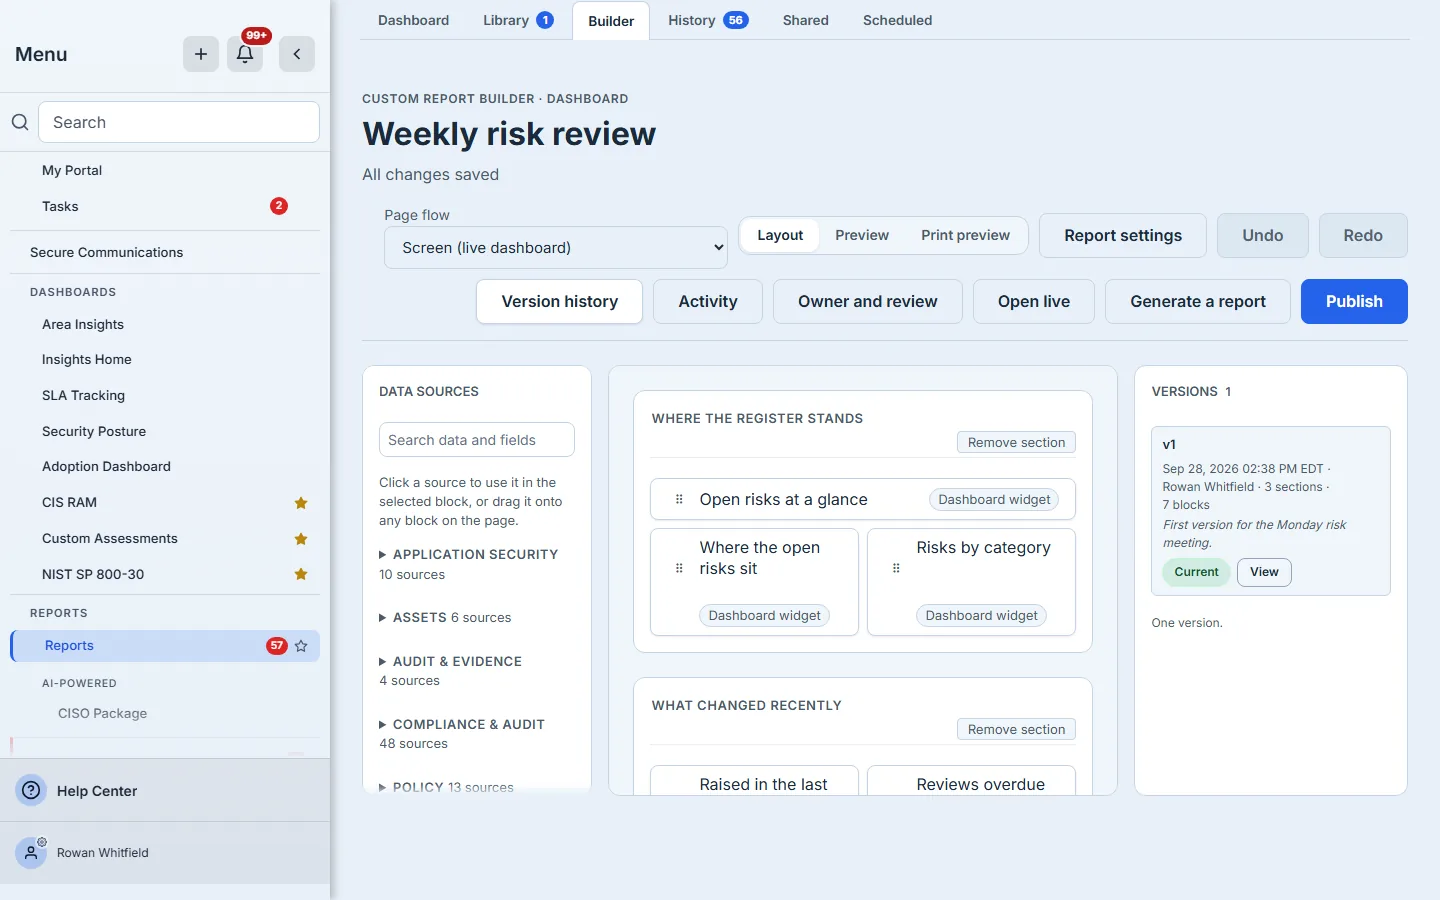
Add sections for each part of the meeting and give every block a title — the title is what a reader sees above the widget. This dashboard has three sections: where the register stands, what changed recently, and the key risk indicators.
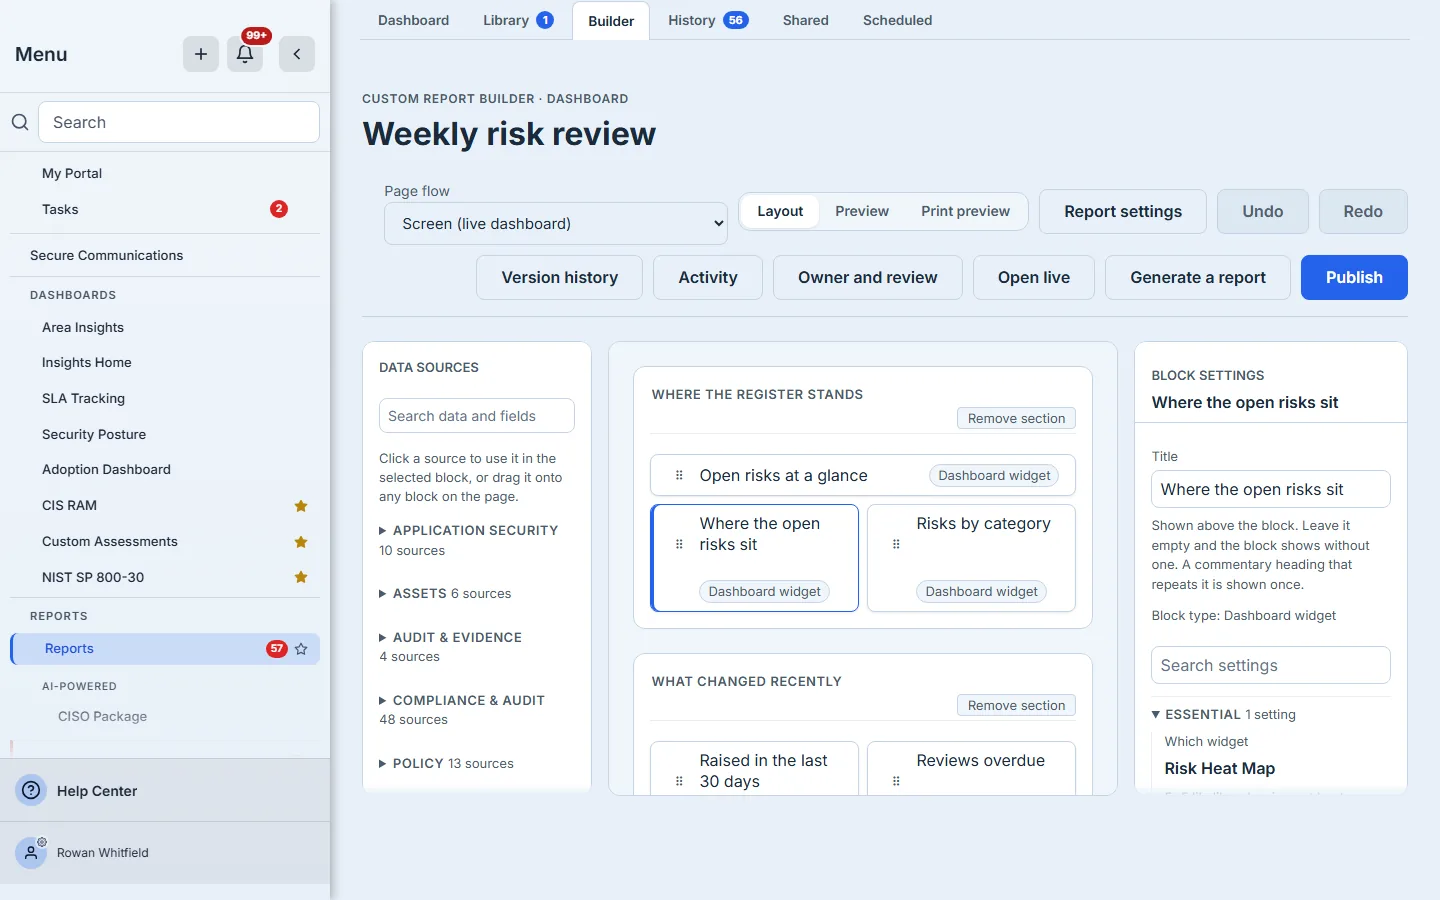
Every change saves as you make it, and Undo and Redo work across them. A saved change is on the live dashboard the next time anyone opens it — so arrange a dashboard before you share it, not in front of its audience. The builder’s Preview and Print preview show the dashboard as the dated report it would generate, page by page; to see it as a dashboard, use Open live. Nothing you arrange changes any delivered dashboard: this one is yours.
Step 6 — Publish a version
Publish records the arrangement as a numbered version, with an optional note saying what changed. A private dashboard stays private when you publish it, and the live dashboard shows your latest saved arrangement whether or not you have published it — publishing is about the record, not the audience.
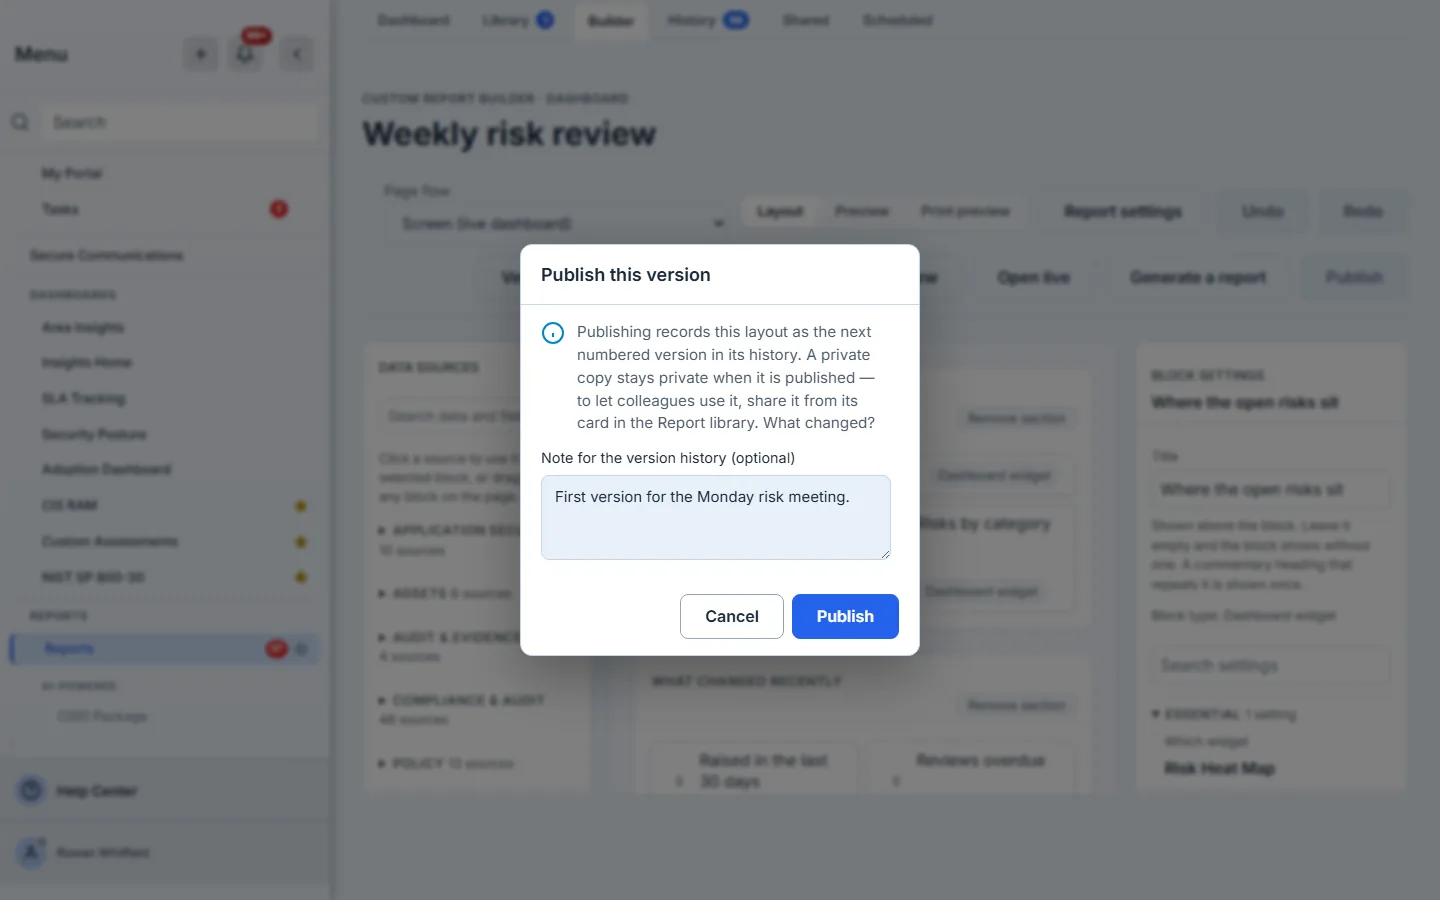
The note is worth writing. Six months on, it is the note in the version history that says why the dashboard your committee looks at stopped showing a figure it used to.
Step 7 — Open it live
Open live — or Open dashboard on its library card — opens the dashboard on your current data. Under the title it states when its figures were read, so anyone looking at it knows how current it is.
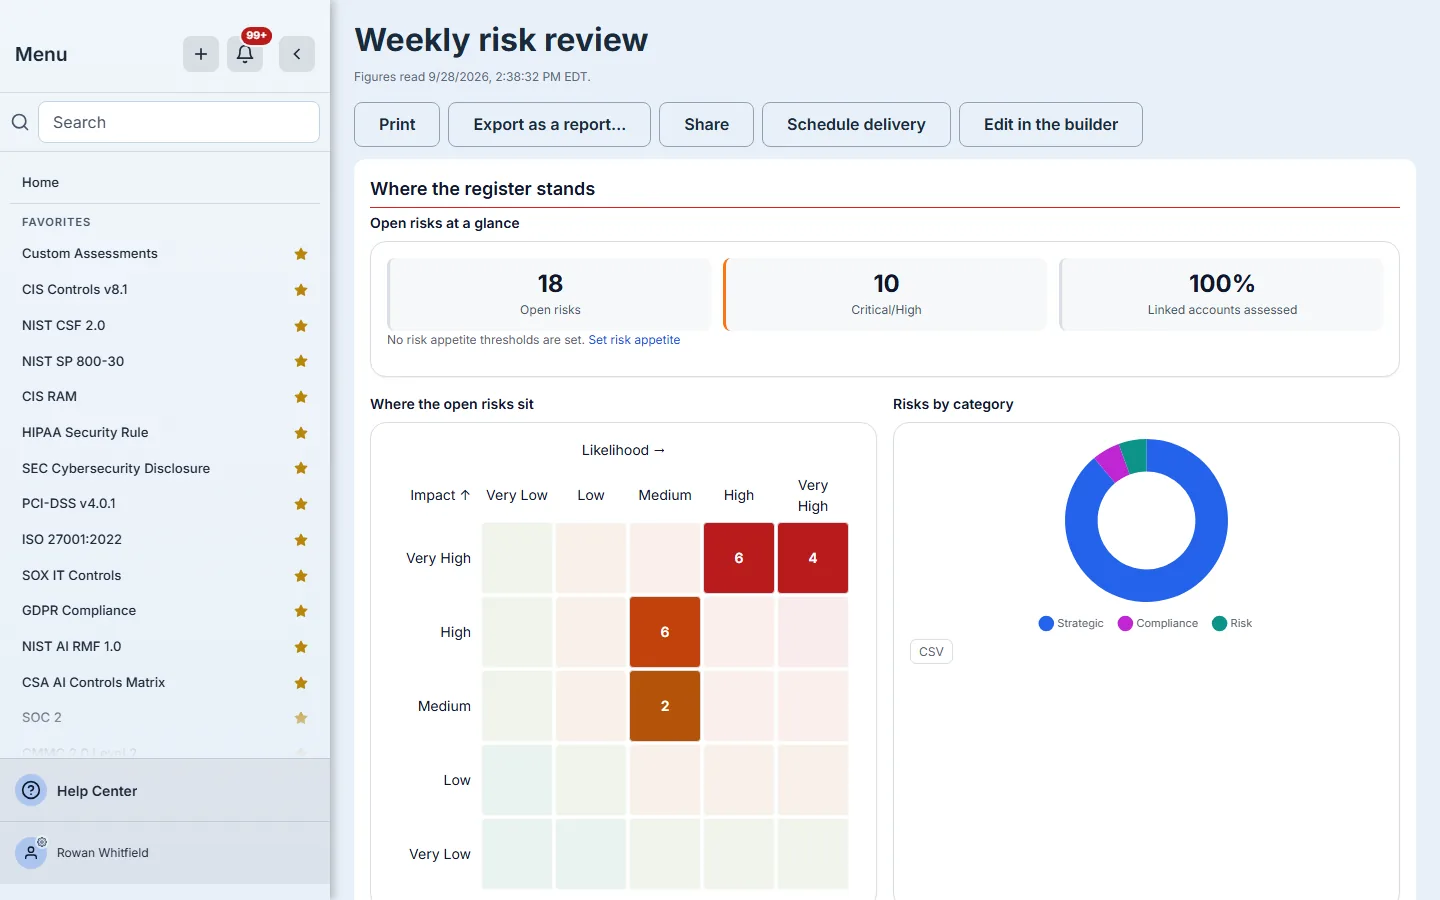
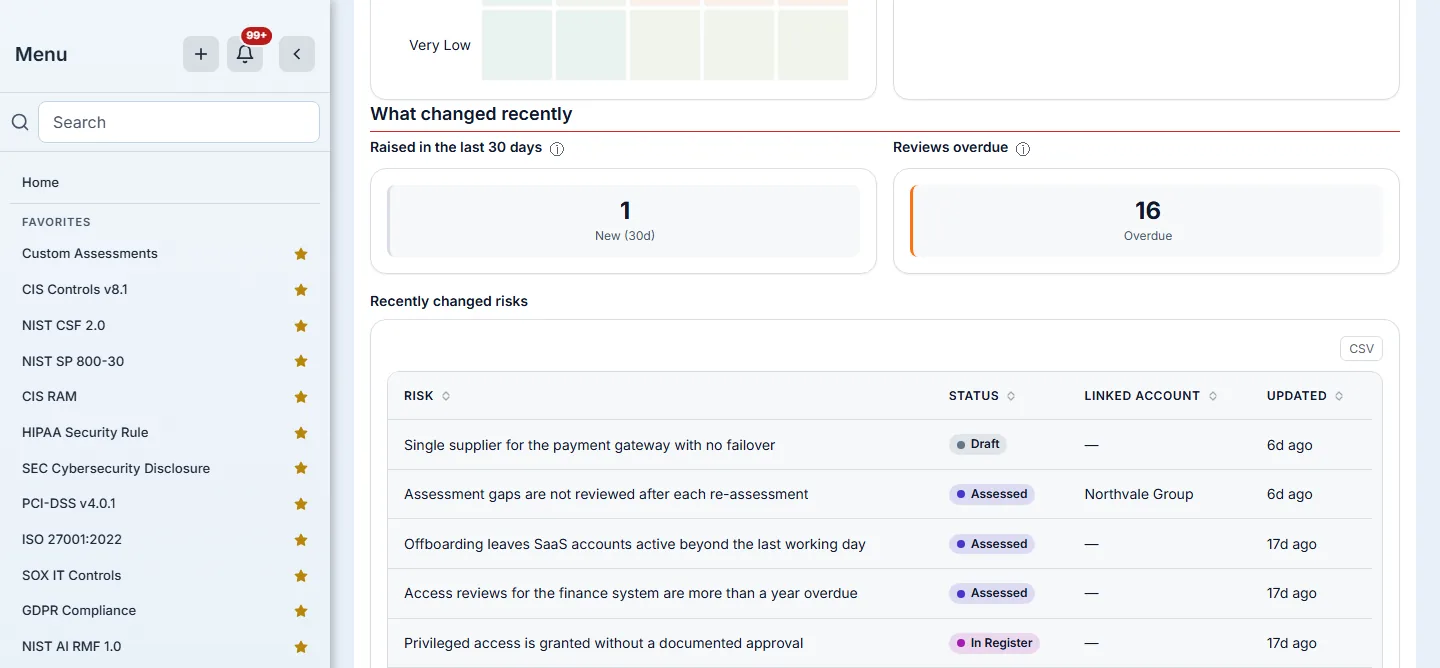
The action row turns the live page into something else when you need it. Export as a report… generates a dated report from it — the thing you file, sign and cite as evidence, because a live dashboard proves nothing about a particular day. Schedule delivery sends that report on a timetable. Edit in the builder goes back to the layout.
Step 8 — Share it
There are two kinds of sharing, and they are for different people.
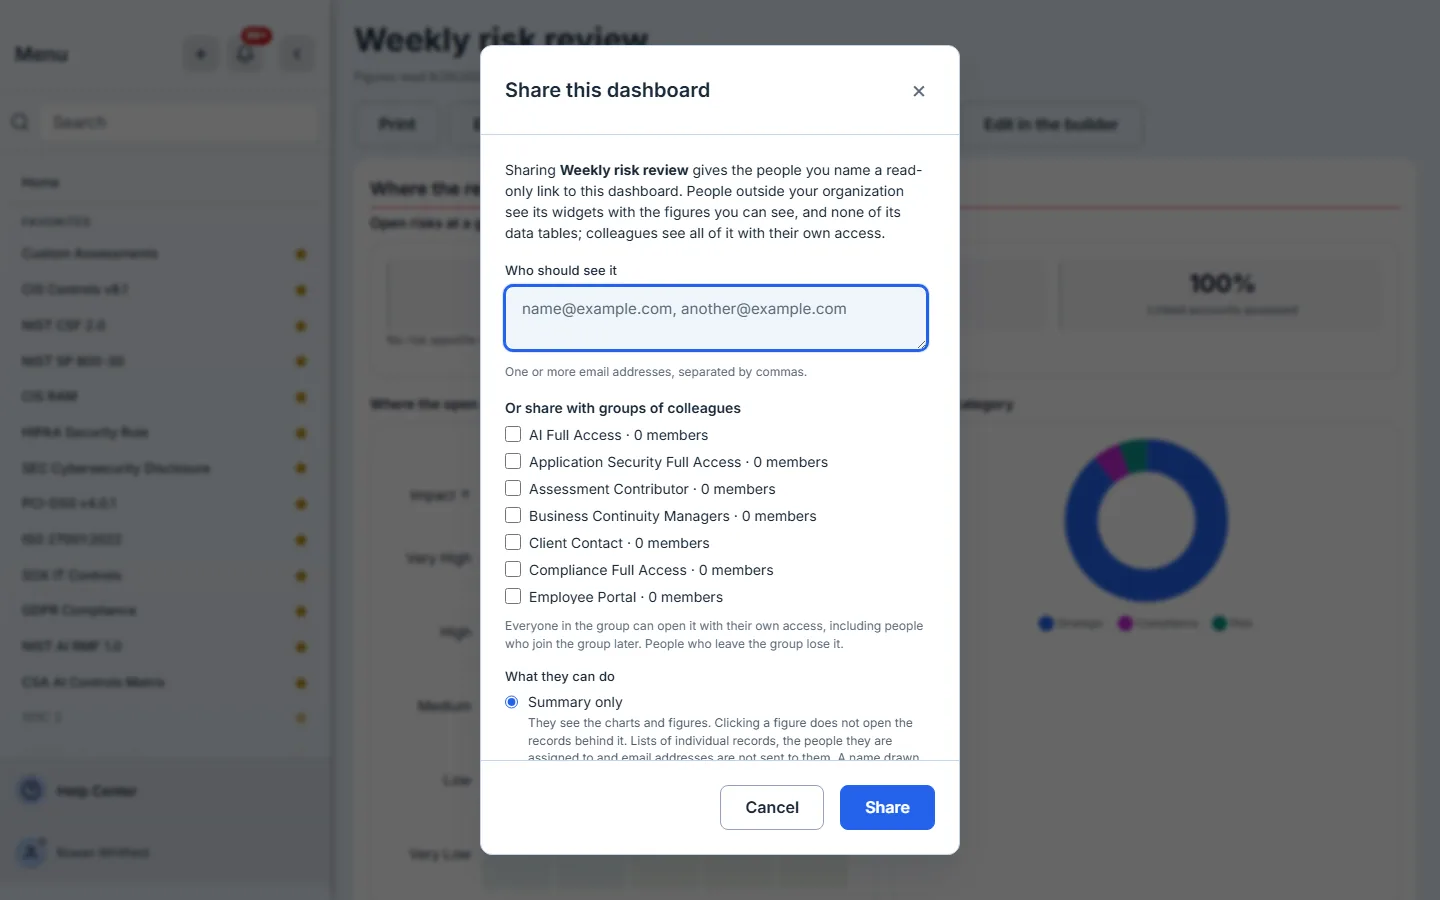
Share, on the live dashboard, gives named people a read-only link, or a group of colleagues at once — everyone currently in the group, and anyone who joins it later. Colleagues see it with their own access. People outside your organisation see its widgets with the figures you can see — but none of its data tables — and you choose whether they get the summary only or the records behind each figure as well, and how long the access lasts. Every link is listed in the same dialog with how many times it has been opened, or that it has not been yet, and you can withdraw it there.
Share with my organization, on the dashboard’s library card, moves it into your organisation’s library so colleagues can find it. You stay its owner — now its accountable owner: you and any editors you name are the only people, besides an administrator, who may change, publish or archive it afterwards — everyone else in the organisation opens it read-only. The confirmation is plain that this is one-way: a shared dashboard cannot be made private again. Archiving it later takes it out of the working library.
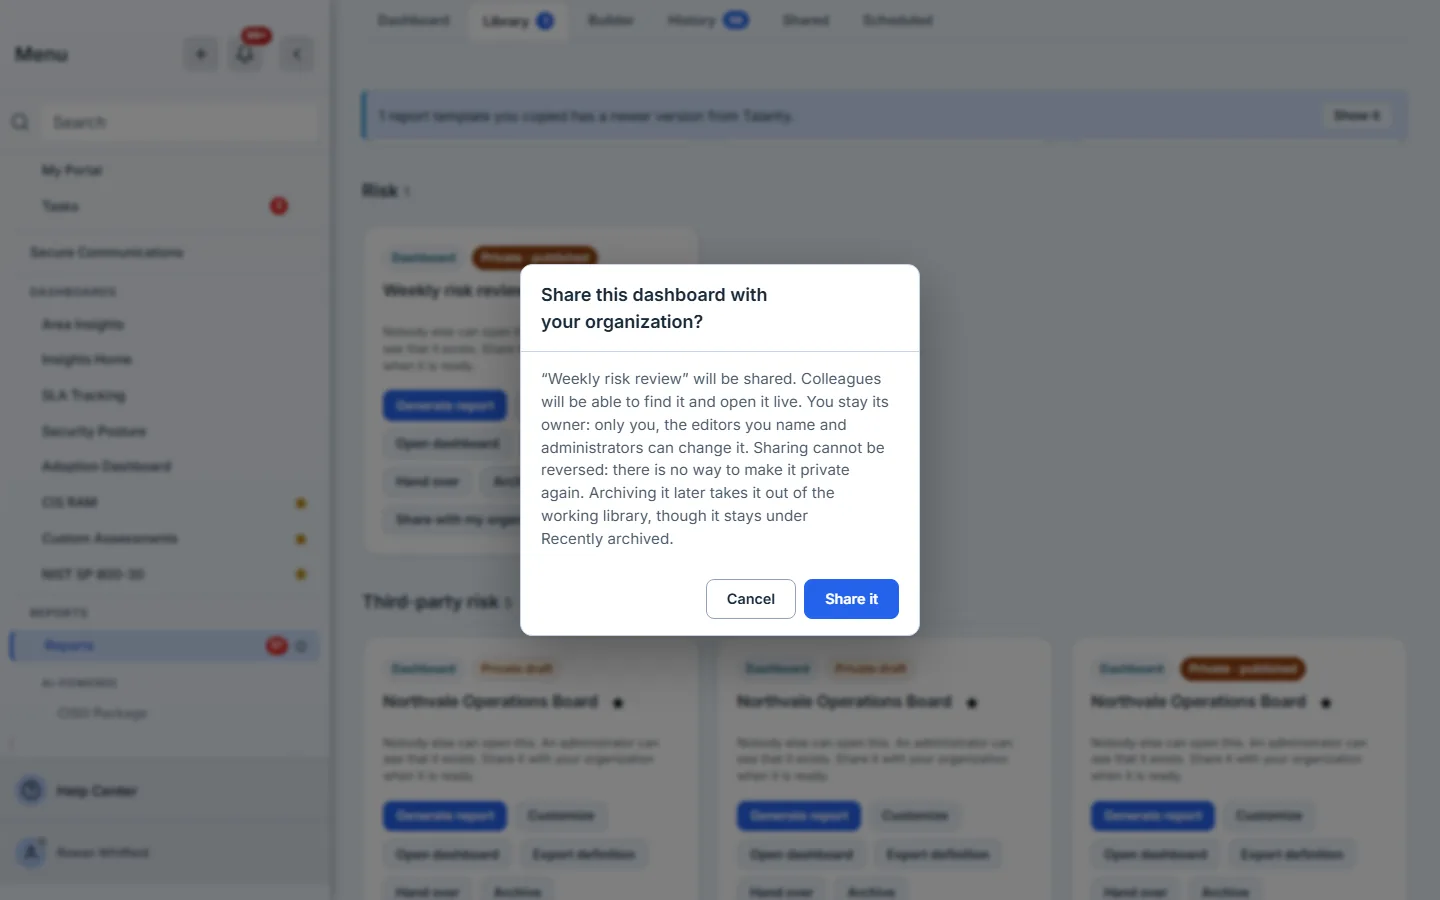
Share with named people first. A link to the two or three people who will use it costs nothing to withdraw. Sharing with the organisation is the step to take once the dashboard has settled — because it cannot be taken back.
Step 9 — Keep it accountable
Any dashboard — private or shared — can carry a review cadence of its own. A new one has none until you choose it: Owner and review, in the builder’s toolbar, opens a pane where you set how often it is due (monthly through every two years) and record who last reviewed it and when. Past due, the library and the builder both say so instead of staying silent.
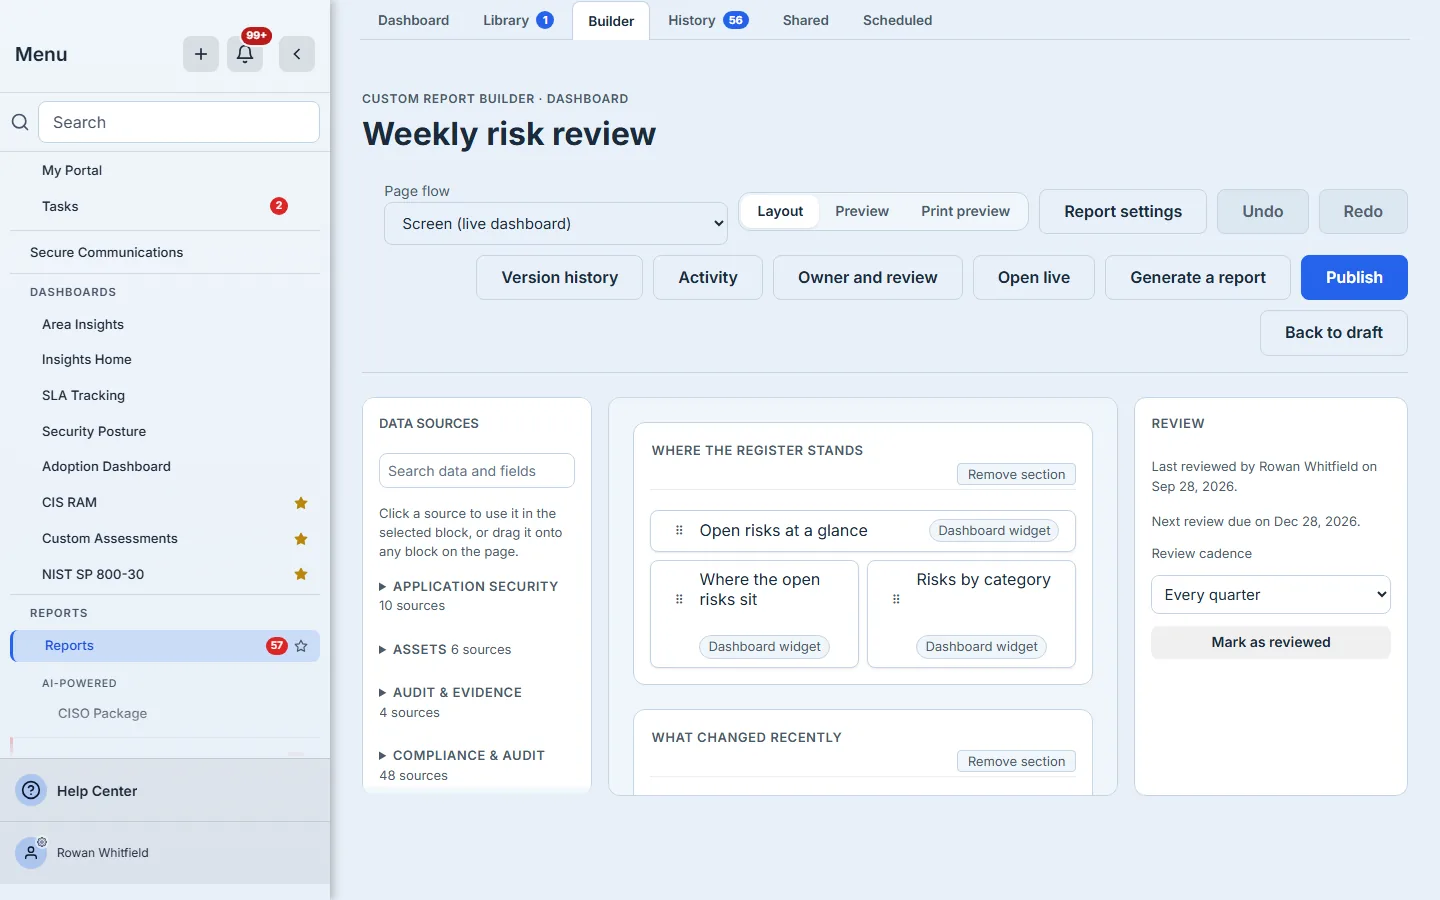
Once a dashboard is shared with the organisation, the same pane names its owner and editors — the only people, besides an administrator, who may change it — and lets the owner hand it to a colleague or add another editor. Anyone following the dashboard, because they starred it or help maintain it, is told through the bell when it is republished, rolled back to an earlier version or archived. Everyday edits in between are not announced — which is why the arrangement is worth settling before you share it.
Step 10 — Or start from a copy
You do not have to start blank. Every dashboard Talarity delivers opens in the builder read-only, with Save a copy on the banner — the same label the library card and the live dashboard both offer for the same action.
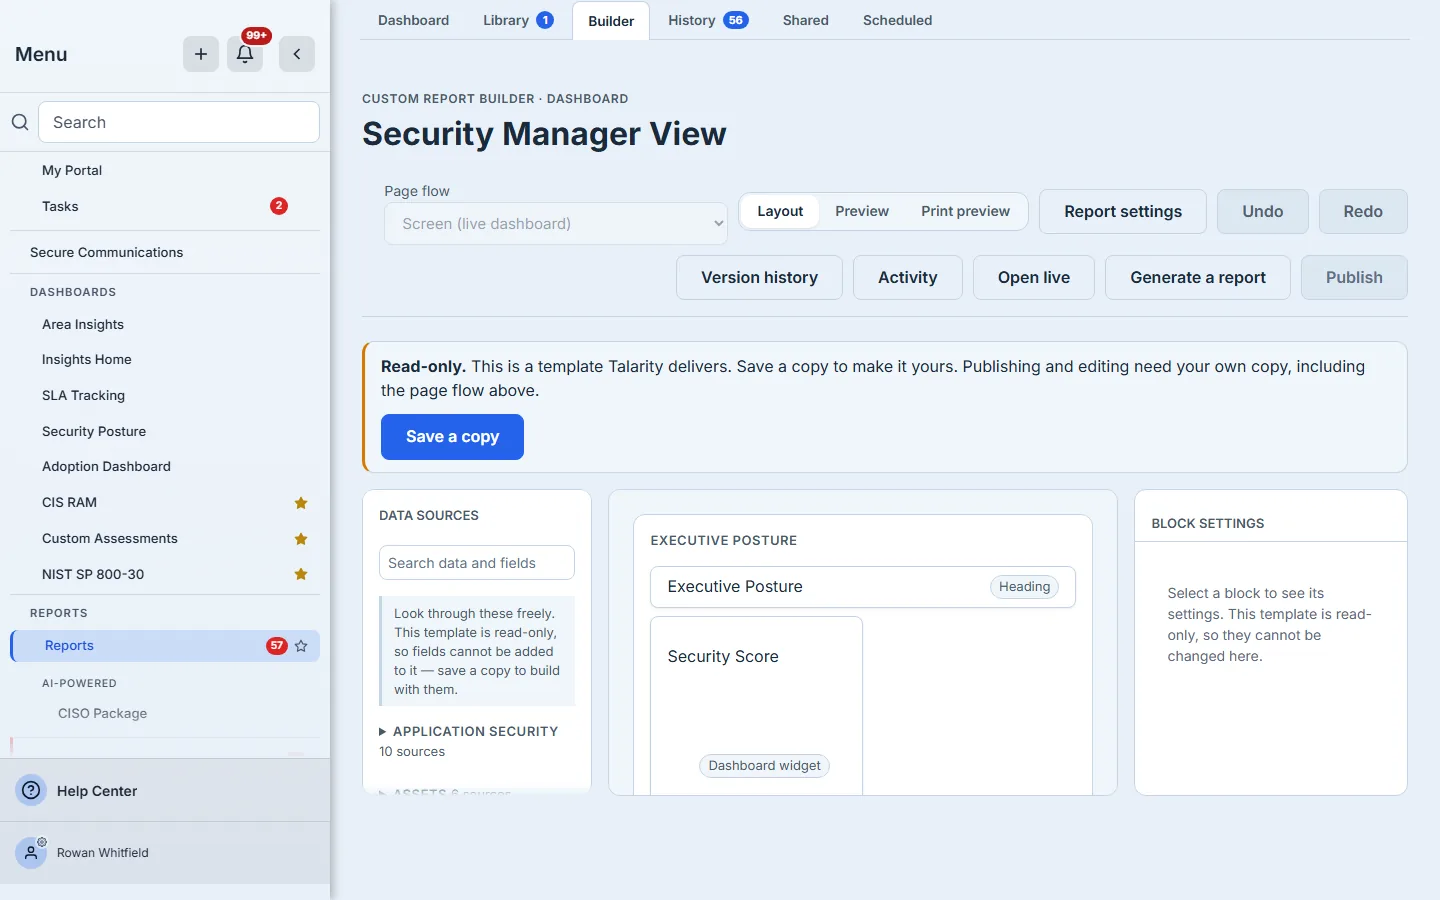
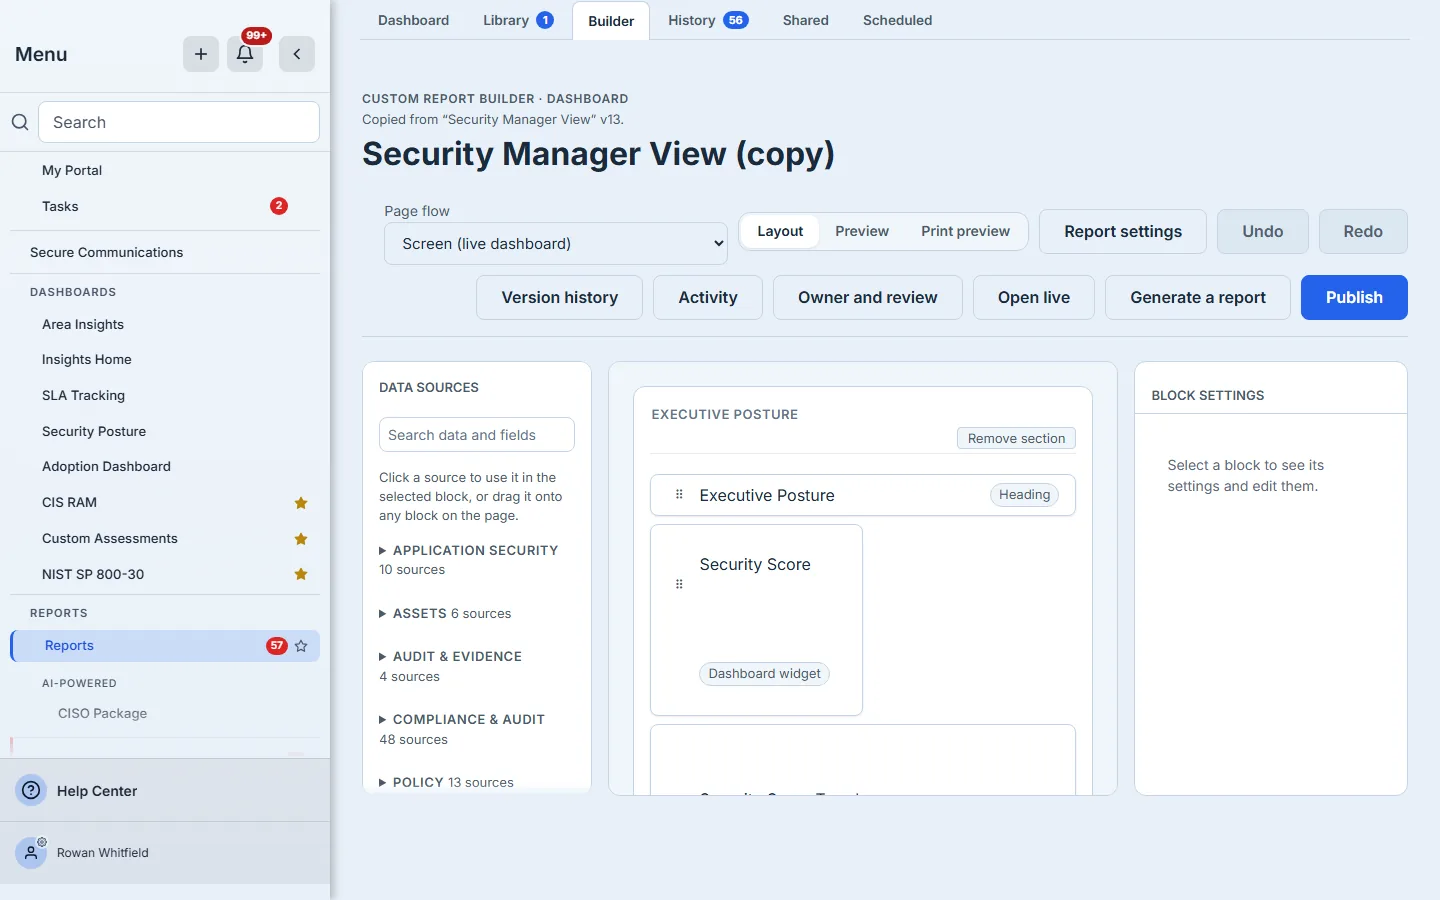
The copy is yours to change, and it says what it was copied from and which version. When Talarity later improves the original, your library tells you a newer version exists and lets you compare it with yours, so a copy does not have to fall behind.
Changing your mind
Back to draft takes a published dashboard back to a draft. It does not change who can open it, and its version history is kept. It is refused while an active scheduled delivery points at the dashboard, because the schedule would go on sending it as you rework it: pause the schedule first.
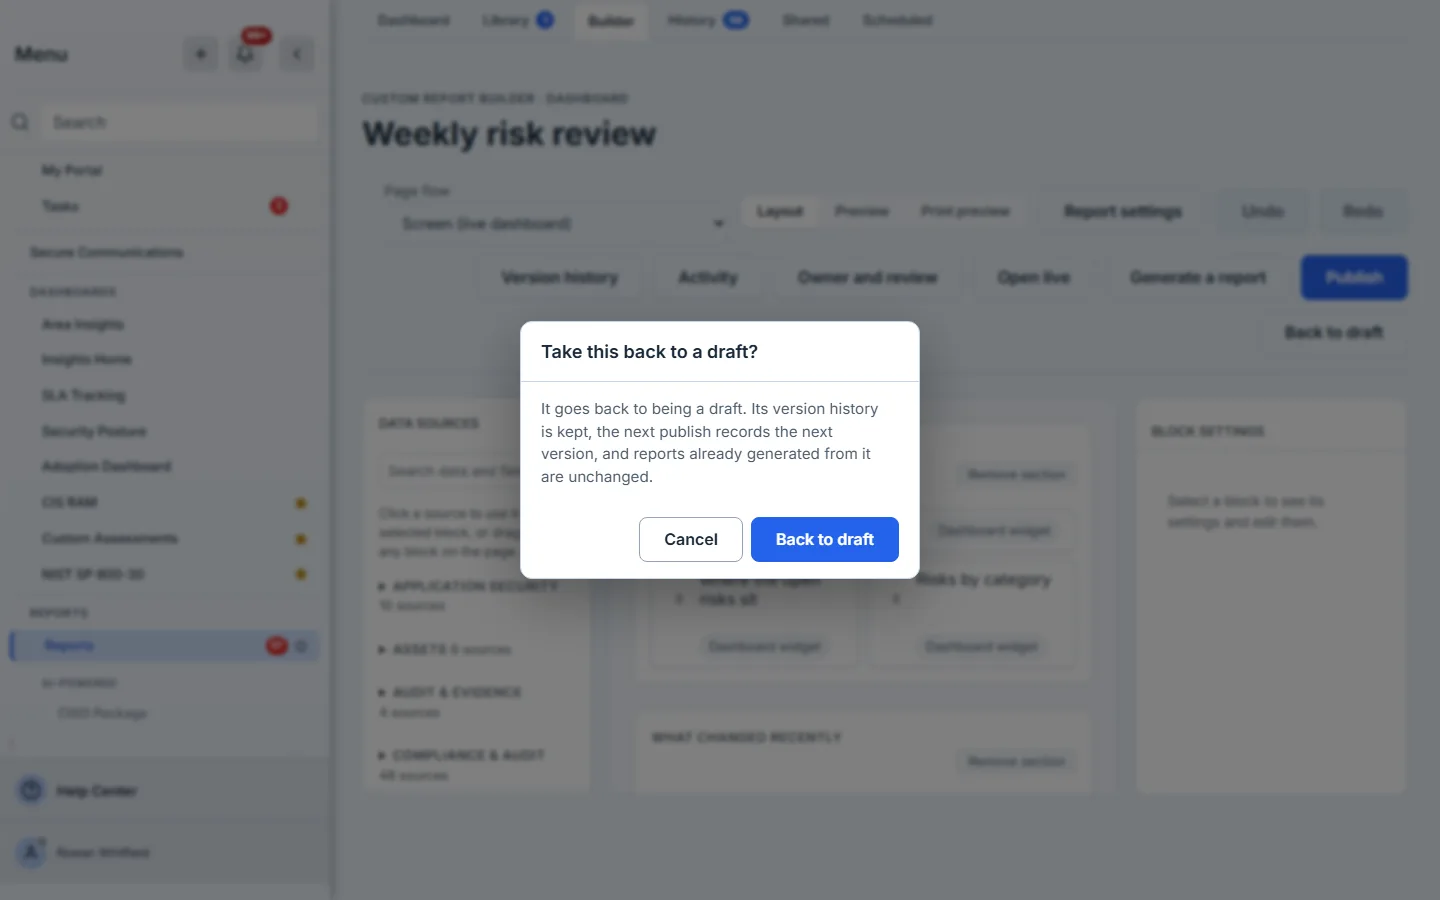
Version history lists every published version with who published it, when, and the note, and can restore an earlier one.
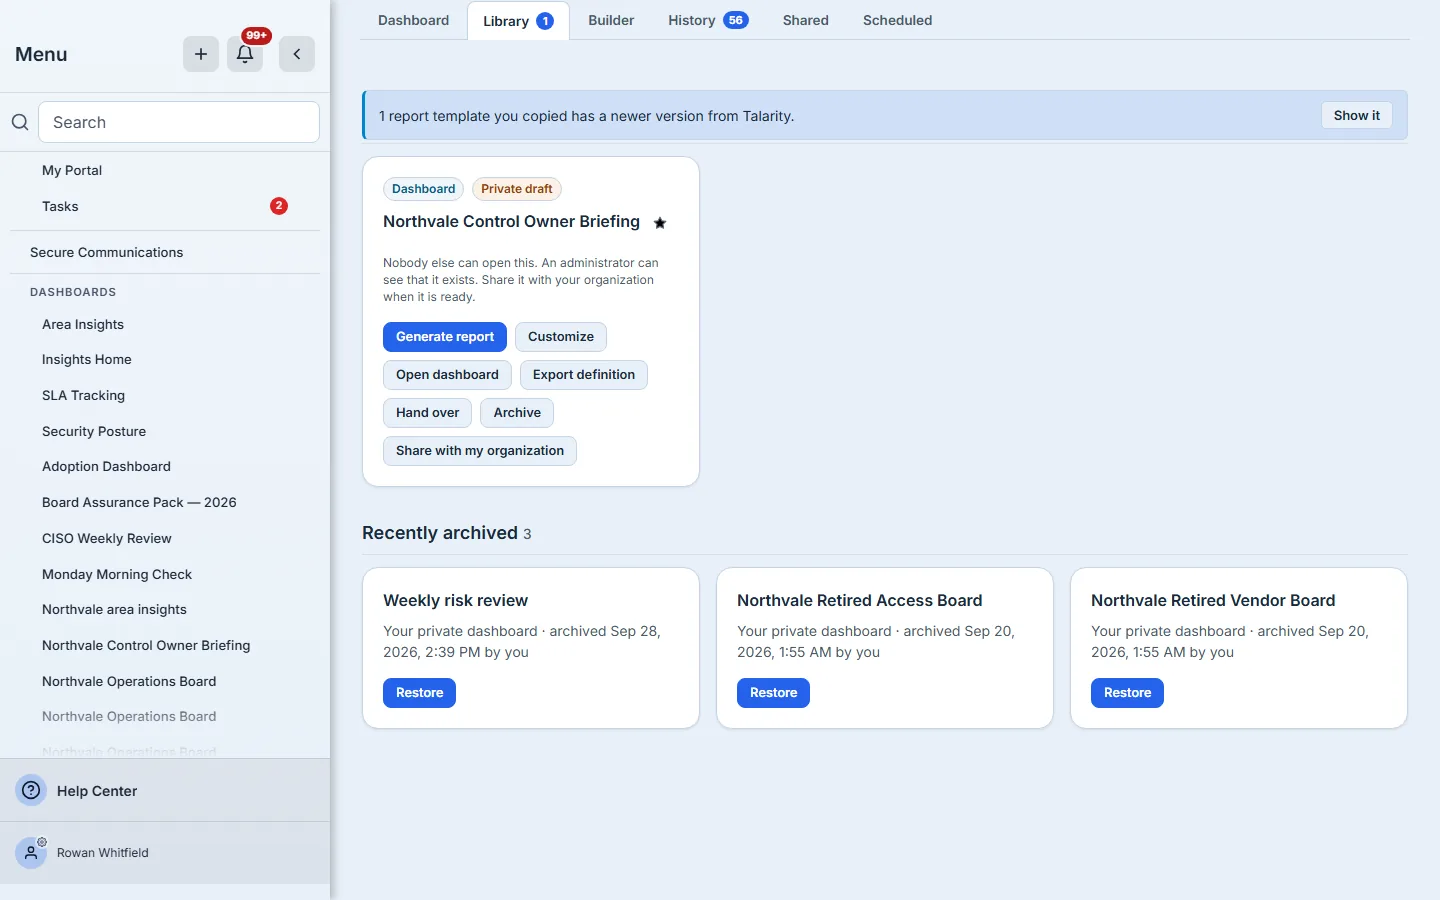
Archive retires a dashboard from the library without destroying it, and pauses any scheduled delivery of it. Archived dashboards are listed under Recently archived, newest first, with when each was archived, and Restore puts one back under the same address; a paused delivery stays paused until you resume it. Only an archived dashboard that no report still names can be deleted permanently.
What you walk away with
- A dashboard shaped like your meeting, built from the same widgets as the delivered ones and opened on your current data.
- A dated statement of when its figures were read, on the page itself.
- A version history of every published arrangement — who, when and why.
- A review cadence you choose, and a named owner and editors once it is shared, so it never becomes nobody’s job.
- Sharing you control: read-only, time-limited links for named people or a group, and a deliberate, one-way step into your organisation’s library.
- A way to a record: any dashboard can be exported as a dated report that is filed, signed and cited.
Build yours this week. Open the Report library, choose Dashboards only, and press Start a blank dashboard. After that, the Monday meeting opens on this week’s figures without anyone preparing them.