Every incident program gets asked the same questions, usually by someone holding a report you wrote. Leadership asks whether response is getting faster. Auditors ask whether every resolved incident got a post-mortem. And since the SEC’s cyber-disclosure rule, counsel asks a fourth with a clock attached: has anyone determined whether this one is material — and if it is, how many of the four business days are left?
The Incident Response Dashboard (/app/incidents/dashboard) answers all of them continuously, from the same records your responders already maintain. Nothing on this page is entered here — it reads the incident log, the RCA register, and the annual IR program, which means every number is exactly as honest as your status discipline. This article walks the page section by section: what each number measures, which timestamp feeds it, and the workflow that moves it.
Who’s involved
- Incident commander / responders — drive each incident through its lifecycle; their status transitions are the metrics.
- Security leadership — reads trend, backlog, and program health; owns the corrective-action queue.
- Legal / compliance — owns materiality determinations and the disclosure clock.
The clocks, before anything else
One vocabulary decision explains most of this page, so it comes first. Every response-time number starts its clock when the incident was reported — the moment a record exists. From there the page measures three things:
- Acknowledge — reported → someone began investigating.
- Contain — reported → the bleeding stopped.
- Resolve — reported → the incident ended.
What the page deliberately does not show is time to detect. An incident records when it was reported, not when the event actually occurred, so the gap between compromise and discovery is not measured anywhere in the record — and the dashboard refuses to invent it. The trend section says exactly this, on screen: “Time to detect is not shown — an incident records when it was reported, not when the event actually occurred, so there is no honest way to measure the gap between the two.” That refusal is worth internalizing, because most incident tooling quietly labels the acknowledge latency “MTTD” and lets you believe you’re measuring detection. Here the case file, the dashboard, and the annual program all use the same three honest names.
The KPI hero
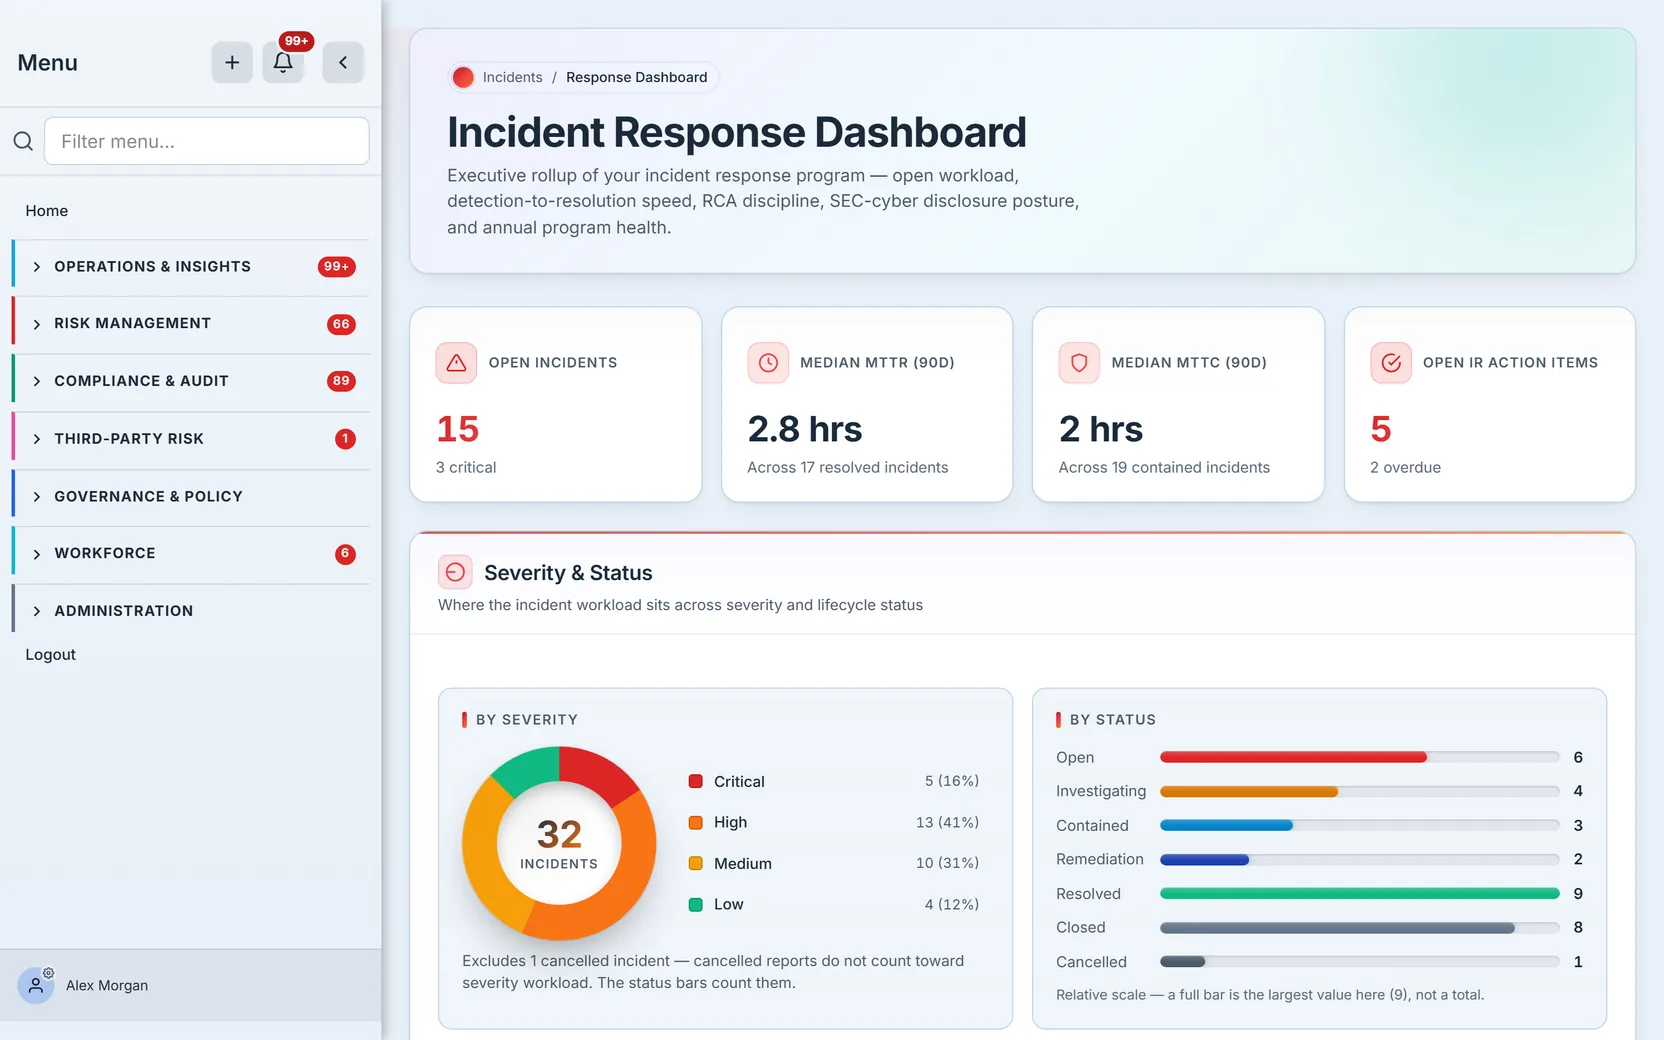
Four cards, each naming its own window and denominator. Open incidents carries a critical sub-count; median MTTR and MTTC are each stamped “(90D)” and “Across N resolved / contained incidents”; open IR action items shows how many are overdue.
The subtitle under each median is load-bearing: “Across 17 resolved incidents” tells you the sample size behind the number. A median over three incidents is a fact about three incidents, not a program benchmark — the card gives you the denominator so you can weigh it. When nothing has resolved in the window, the card says so instead of showing a zero, because “we resolve incidents in zero minutes” and “no incidents resolved lately” are very different claims. And the two medians genuinely differ — MTTR 2.8 hrs against MTTC 2 hrs — because containing an incident and resolving it are different milestones with different timestamps.
Severity and status distribution
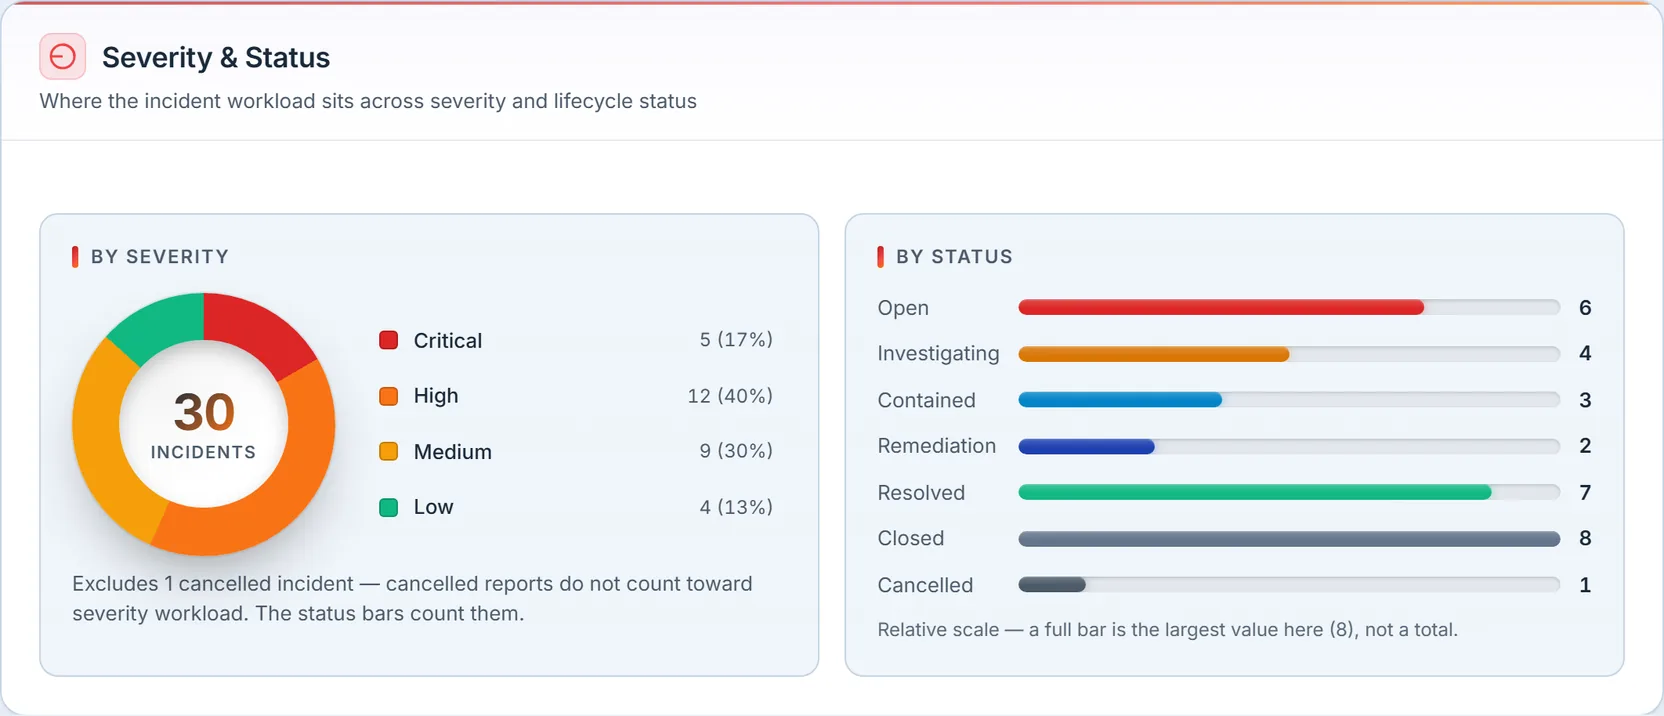
Two panels under one header, and they must reconcile. The donut counts 32 incidents by severity; the status bars sum to 33. The one-incident difference is deliberate and stated on screen: “Excludes 1 cancelled incident — cancelled reports do not count toward severity workload. The status bars count them.” A cancelled report shouldn’t inflate your severity workload, but it’s still a real row in the log — so the two panels use different populations, and the page says which is which rather than leaving you to cross-foot a mismatch.
The status bars use the real lifecycle vocabulary — open, investigating, contained, remediation, resolved, closed, cancelled — the same statuses responders click through on the case file. That’s not cosmetic: each transition stamps the timestamp a metric upstream depends on.
Response-time trend
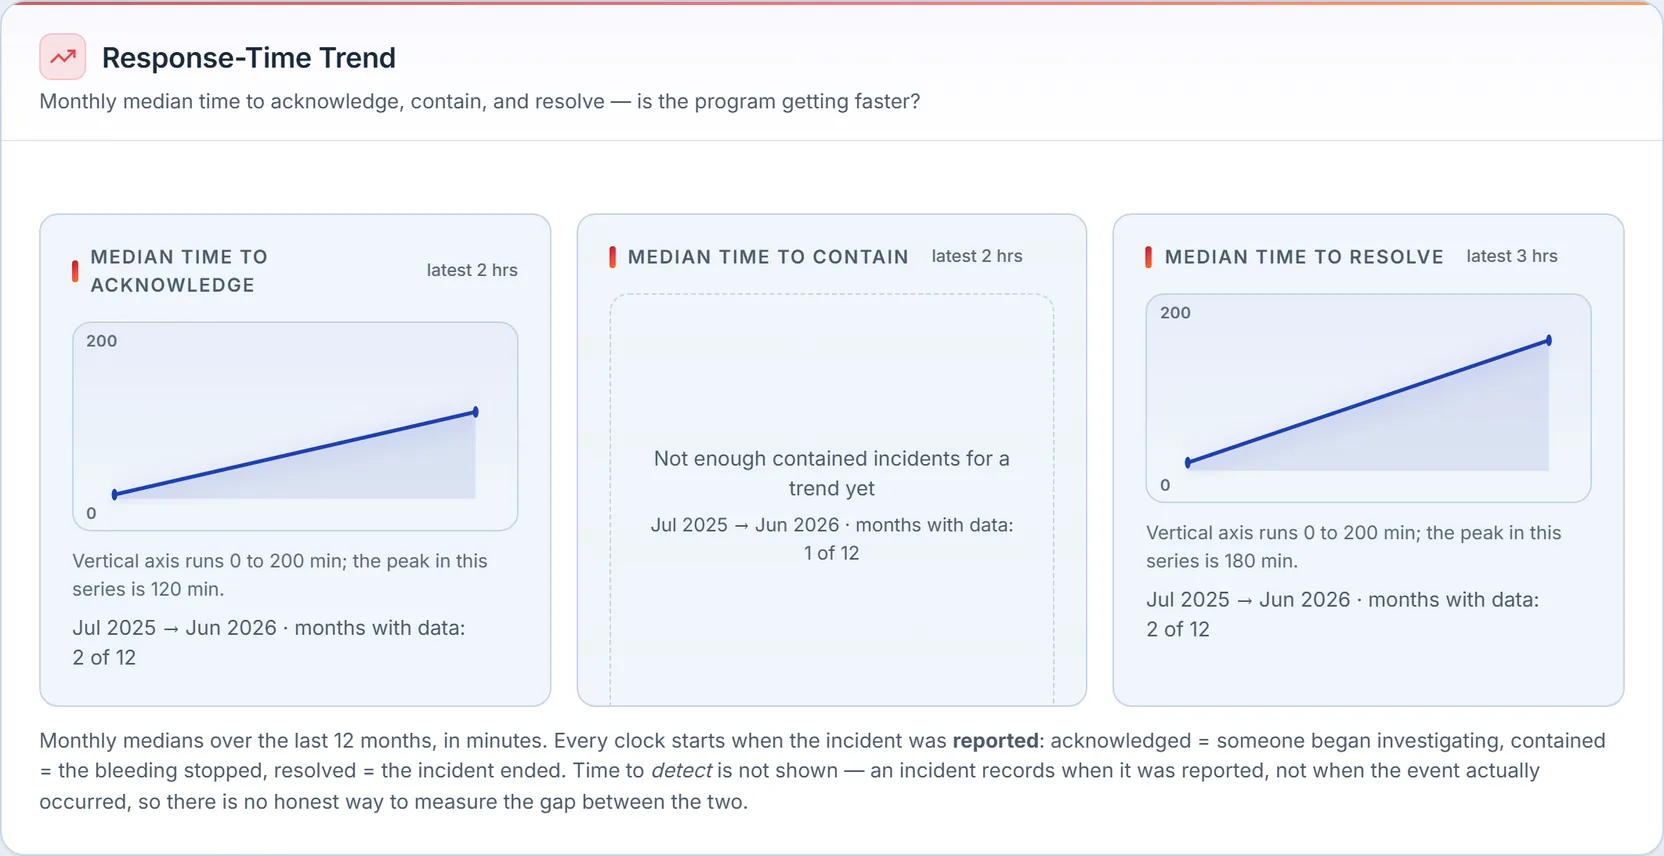
Three monthly-median panels — acknowledge, contain, resolve — each bucketed by its own milestone month, each stating its month range (“Jul 2025 → Jun 2026”) and its own coverage (“months with data: N of 12”). Months with no qualifying incidents show gaps, not zeros; a metric with fewer than two data months says “Not enough … incidents for a trend yet” instead of drawing a line through two points and calling it a trend. The axis notes carry the unit (“min”), so a resolve axis that runs 0–500 can’t be misread as hours.
Inflow versus resolution
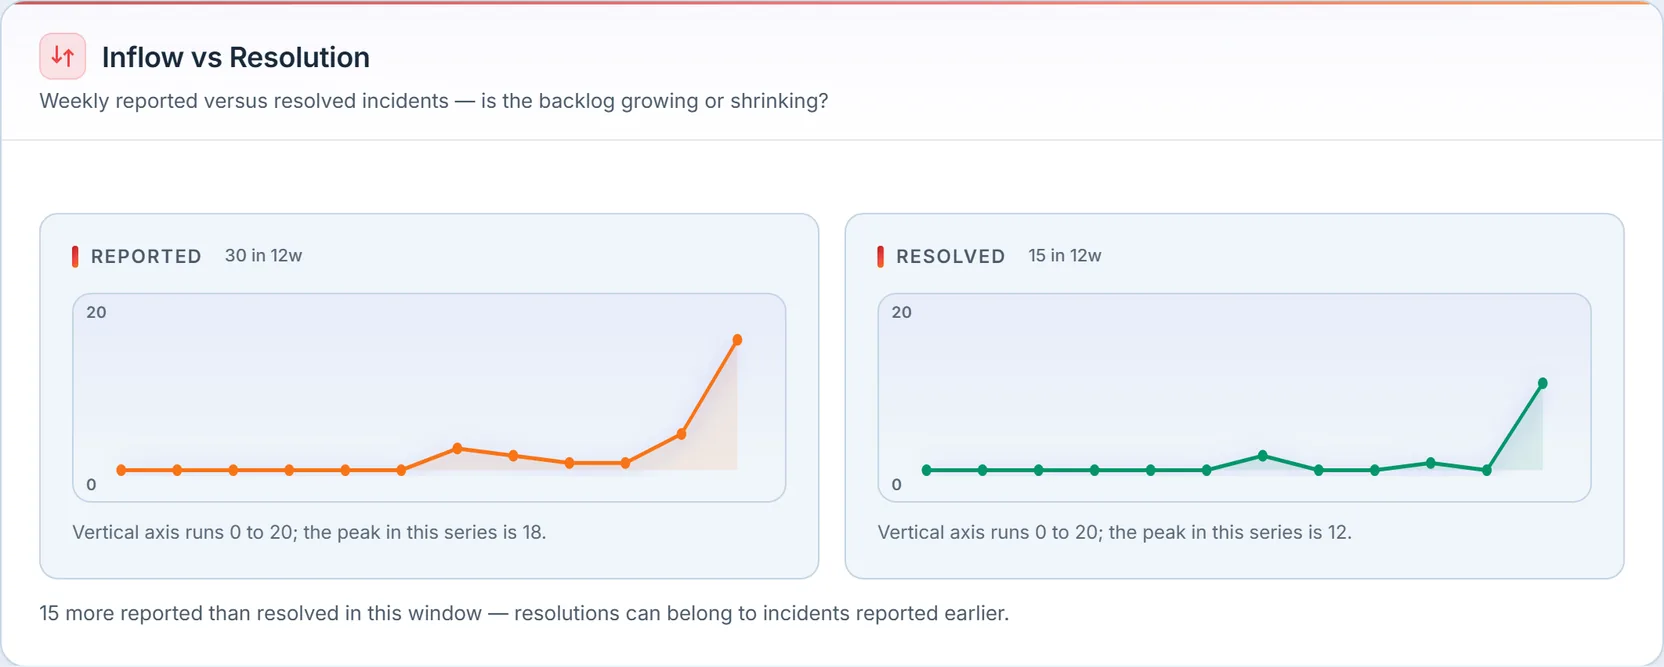
This is the “are we keeping up” chart: weekly incidents reported against weekly incidents resolved, each with its 12-week total. When the reported line runs above the resolved line for weeks, the backlog is growing regardless of how good the medians look. The footnote is careful about what the difference means — “resolutions can belong to incidents reported earlier” — because the two counts are not the same incidents, and presenting the gap as a clean backlog delta would be a small lie.
Aging open incidents
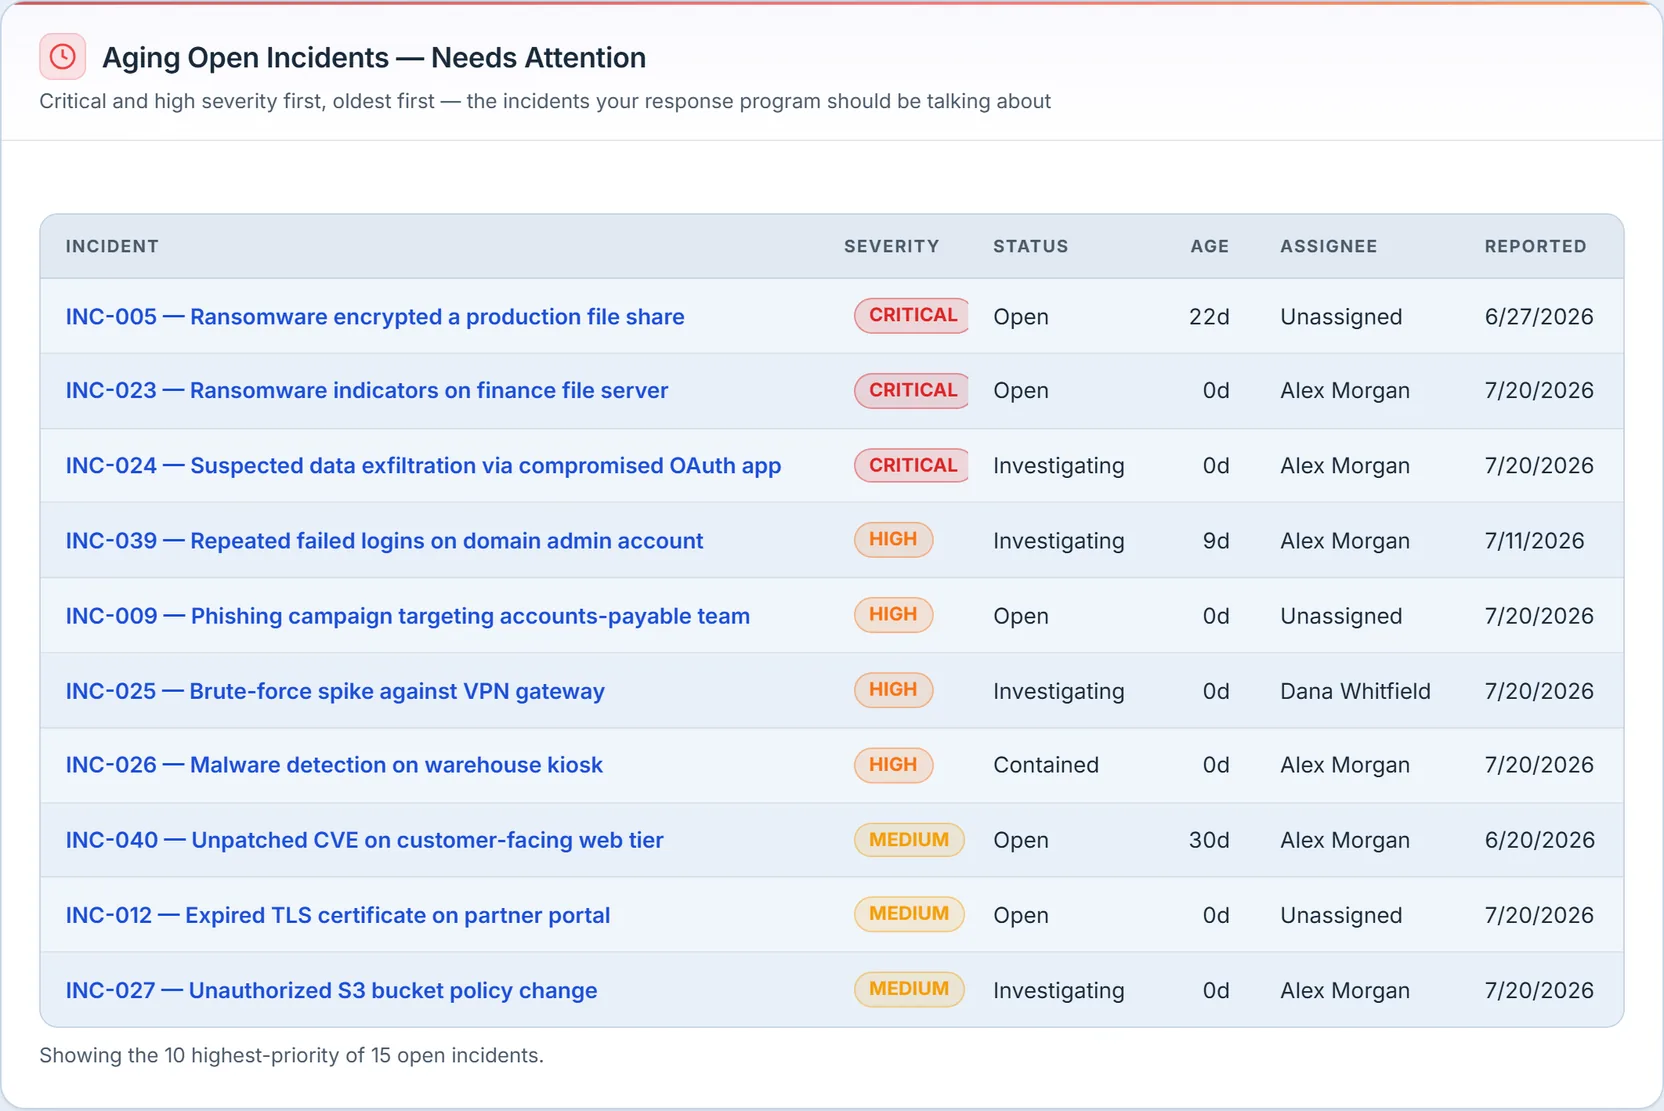
The attention table: open incidents ranked critical-first, then oldest-first. Every row shows its age, its assignee (or an honest Unassigned), and links into its case file — the table exists to be worked, not admired. The footer, “Showing the 10 highest-priority of 15 open incidents,” tells you it’s a ranked slice, not the whole queue, so a 22-day-old critical at the top can’t hide a longer tail.
RCA discipline, as a number
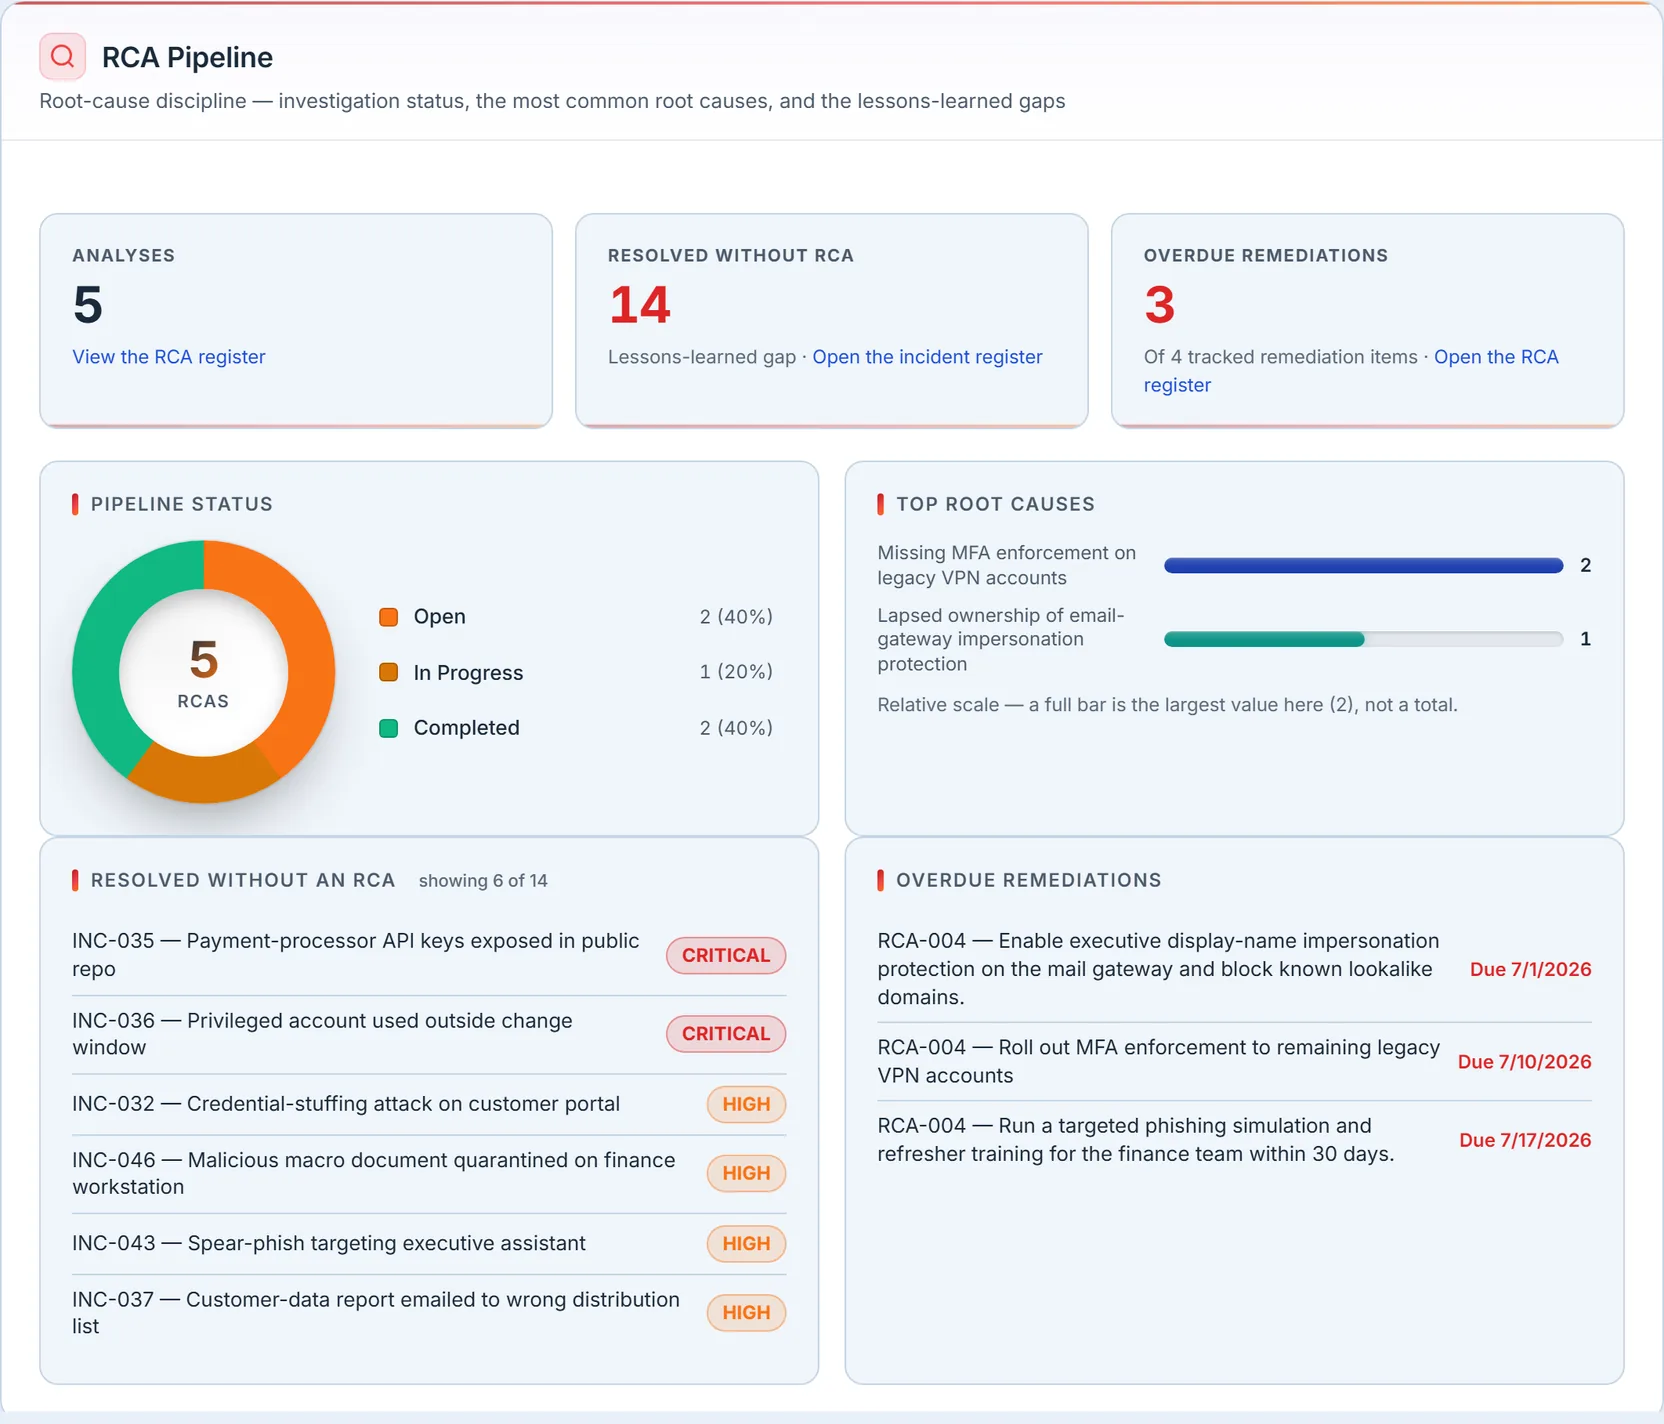
Post-mortems are where incident programs quietly fail: the incident closes, everyone moves on, and the lesson evaporates. This section makes that failure visible in three ways — a status donut, the most common root causes, and two attention lists.
The recurring-causes bar deserves a pause: when the same root cause appears under multiple incidents, that’s not two coincidences — it’s one unfixed problem billing you twice. And Resolved Without an RCA names the specific incidents that ended without a lesson, so “we do post-mortems” becomes checkable. Overdue remediations show their due dates in red, because a corrective action past its date is the program’s own broken promise.
Materiality and the SEC clock
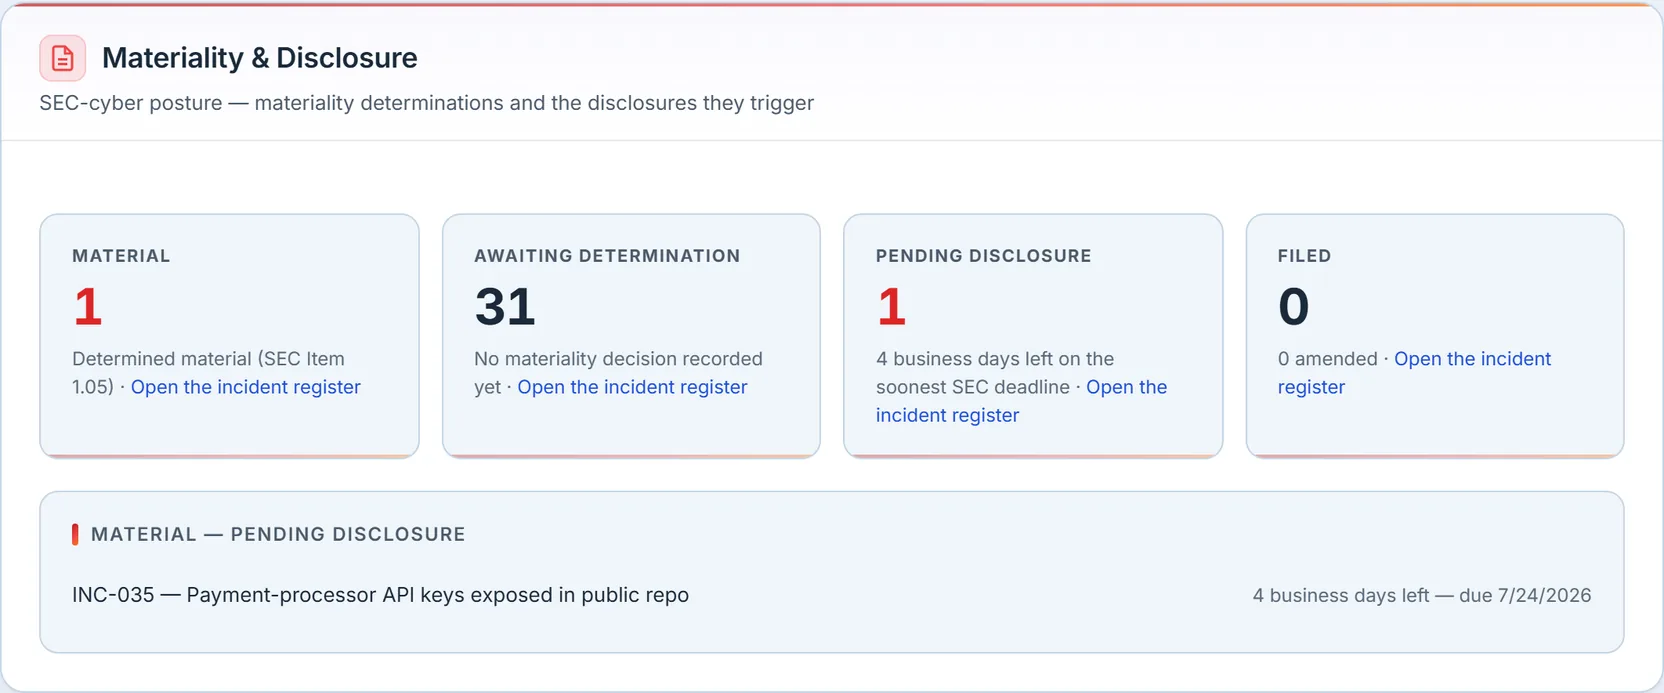
Since the SEC’s cyber rule, a public company that determines a cyber incident is material has four business days to file. This section tracks that pipeline: how many incidents are material, how many are still awaiting a determination, how many are material and pending disclosure — with a live business-day clock counting down the soonest deadline — and how many have been filed. Every tile links to the register, so the 31 incidents still awaiting a determination are one click from the list.
A determination is a recorded decision, not a dropdown:
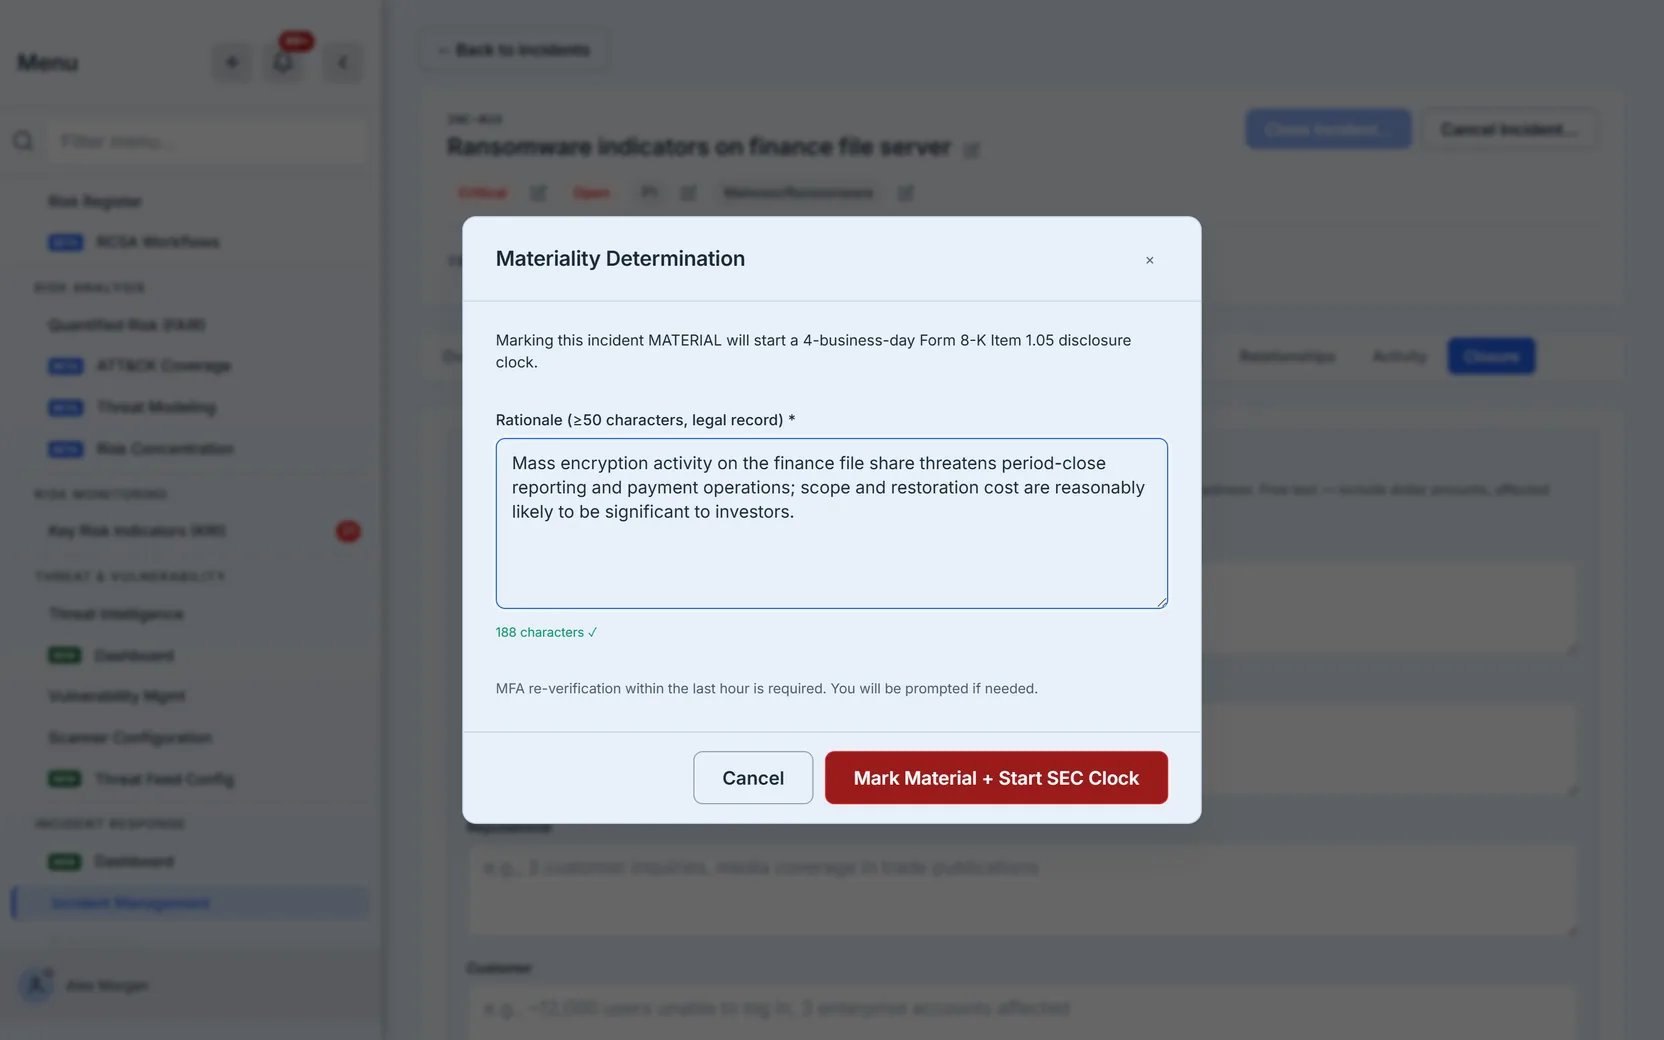
Marking an incident material requires a written rationale (fifty characters minimum, shown as a live counter against the threshold), stamps who decided and when, requires recent MFA re-verification, and starts the disclosure clock. Filing itself runs through the disclosure workflow with legal review — the queue shows what’s pending until that completes.
The annual IR program
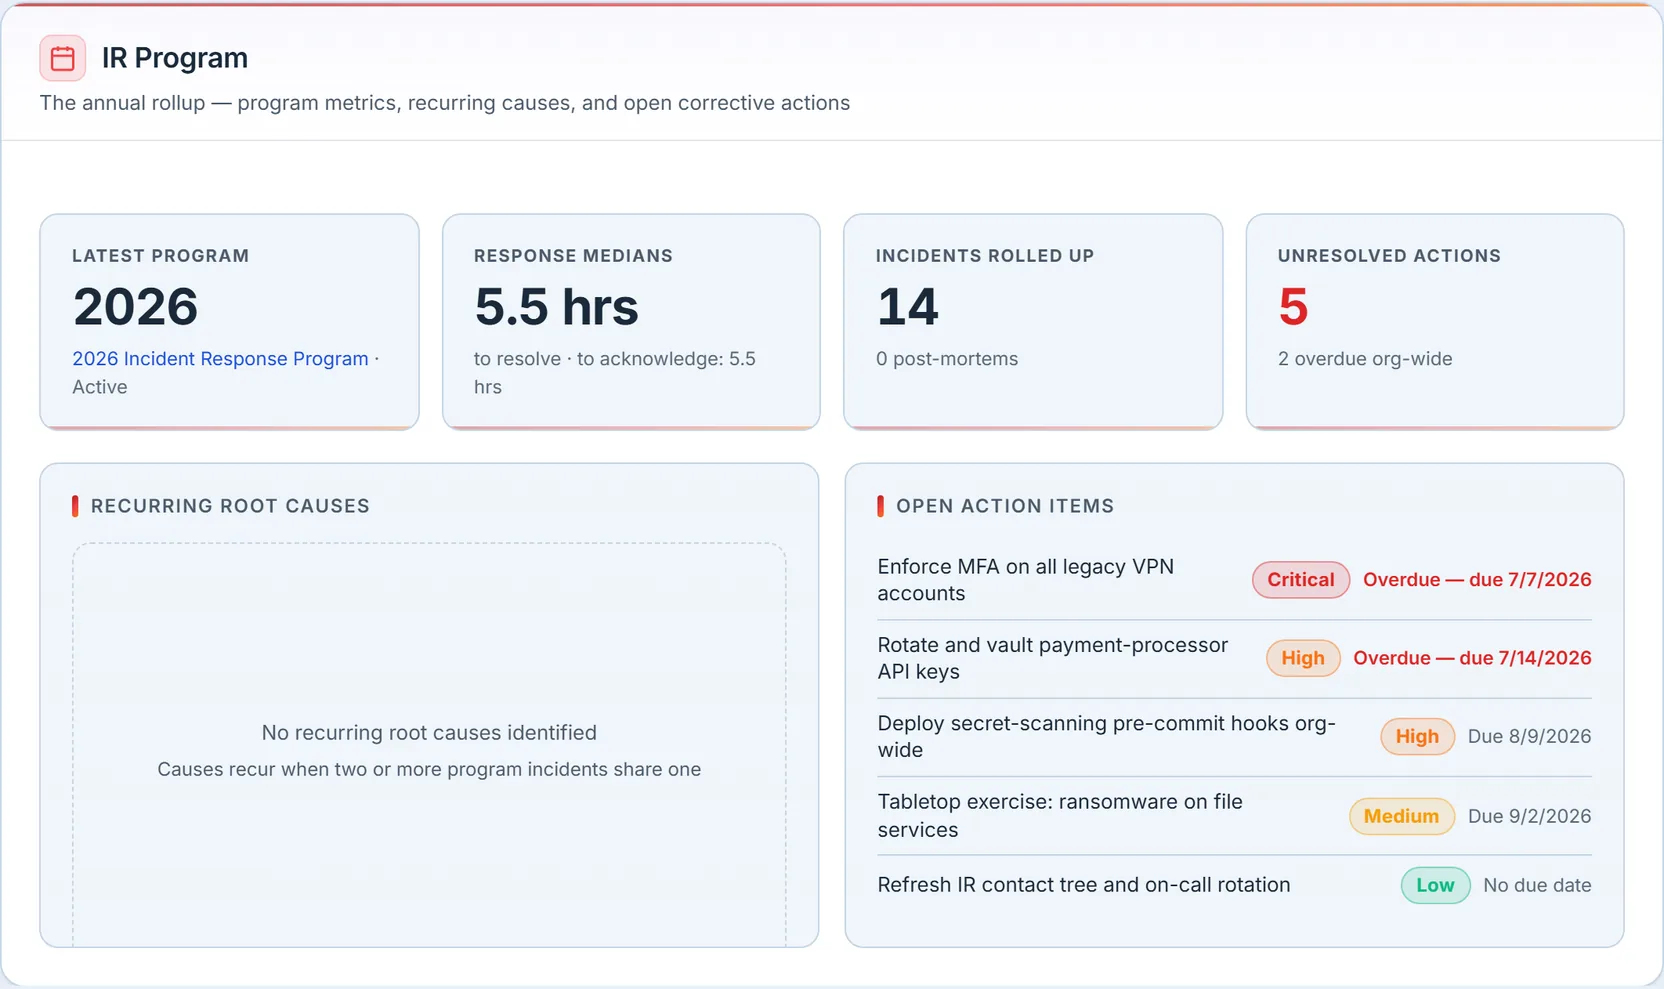
Individual incidents prove you responded; the program proves the capability. The panel carries the program year, its response medians (resolve and acknowledge, each self-named), the incidents and post-mortems rolled up, and the open corrective actions with an overdue count. That corrective-action queue is the part auditors check: findings from post-mortems become dated, owned action items, and the overdue count on the hero card comes from here.
Where the numbers are made
The case file is where everything upstream originates.
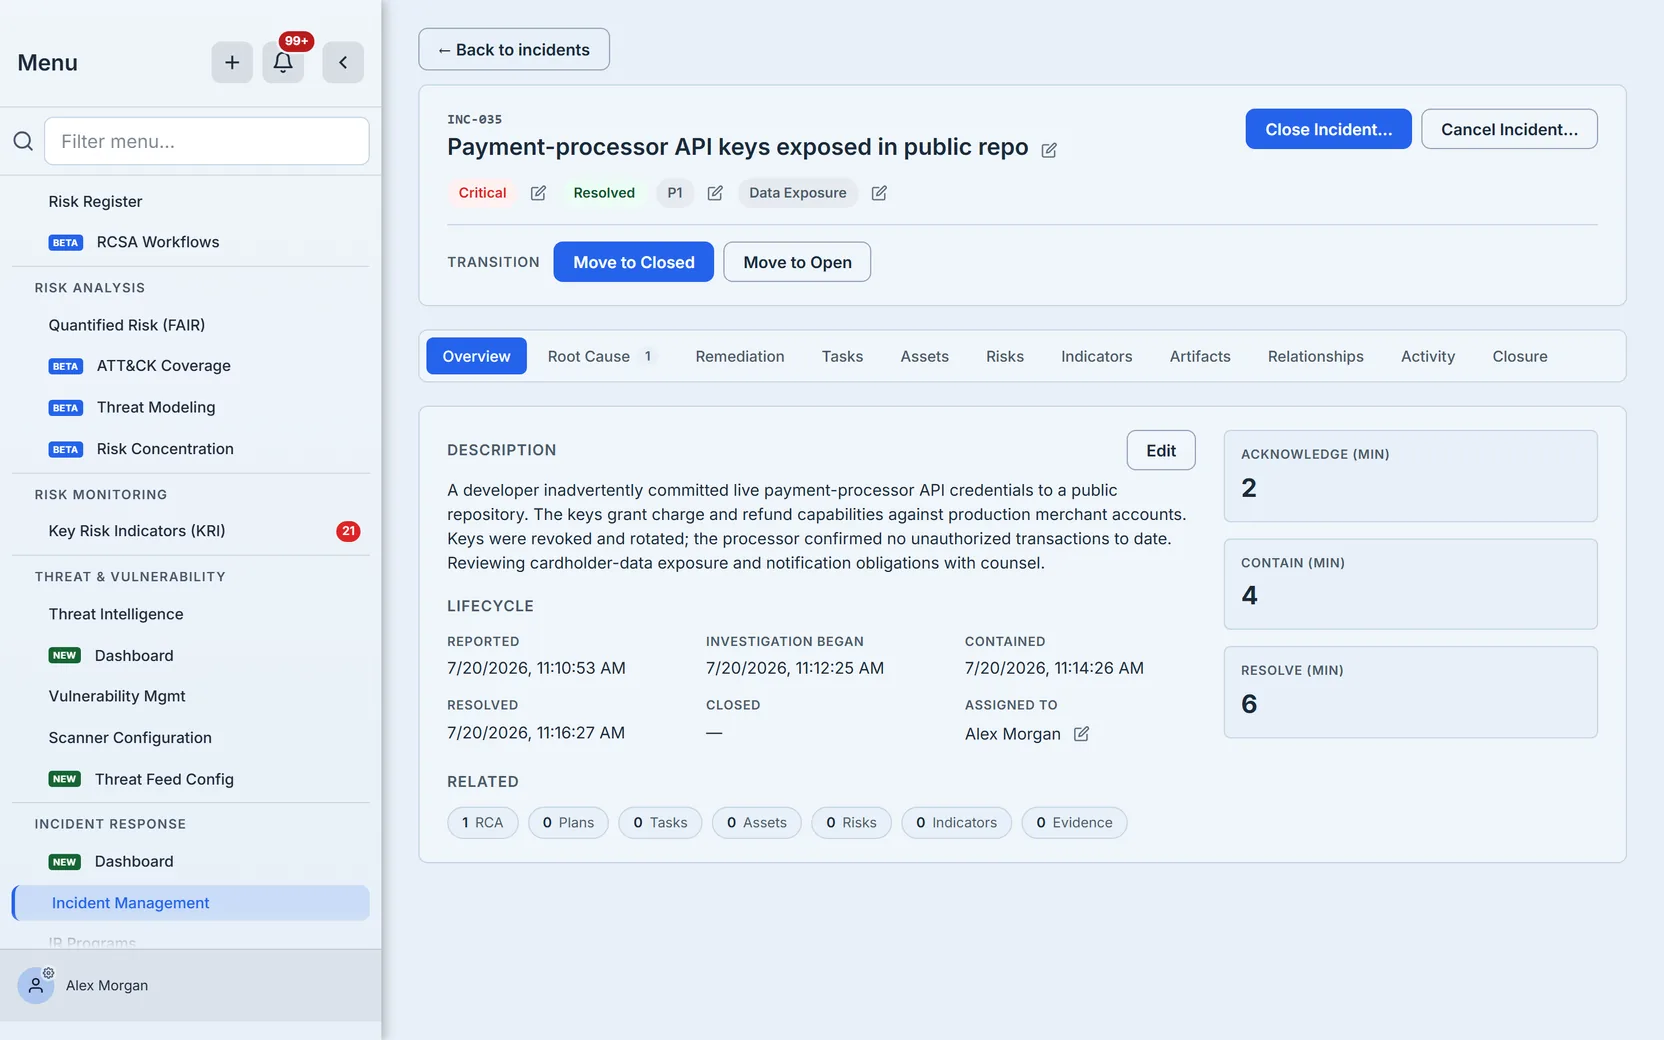
Note the metric labels — Acknowledge / Contain / Resolve (min) — match the dashboard’s vocabulary exactly, and the timeline row reads “Investigation began,” not “Detected,” because that timestamp records when someone started working the incident, not when the event was discovered. One metric, one name, everywhere it appears.
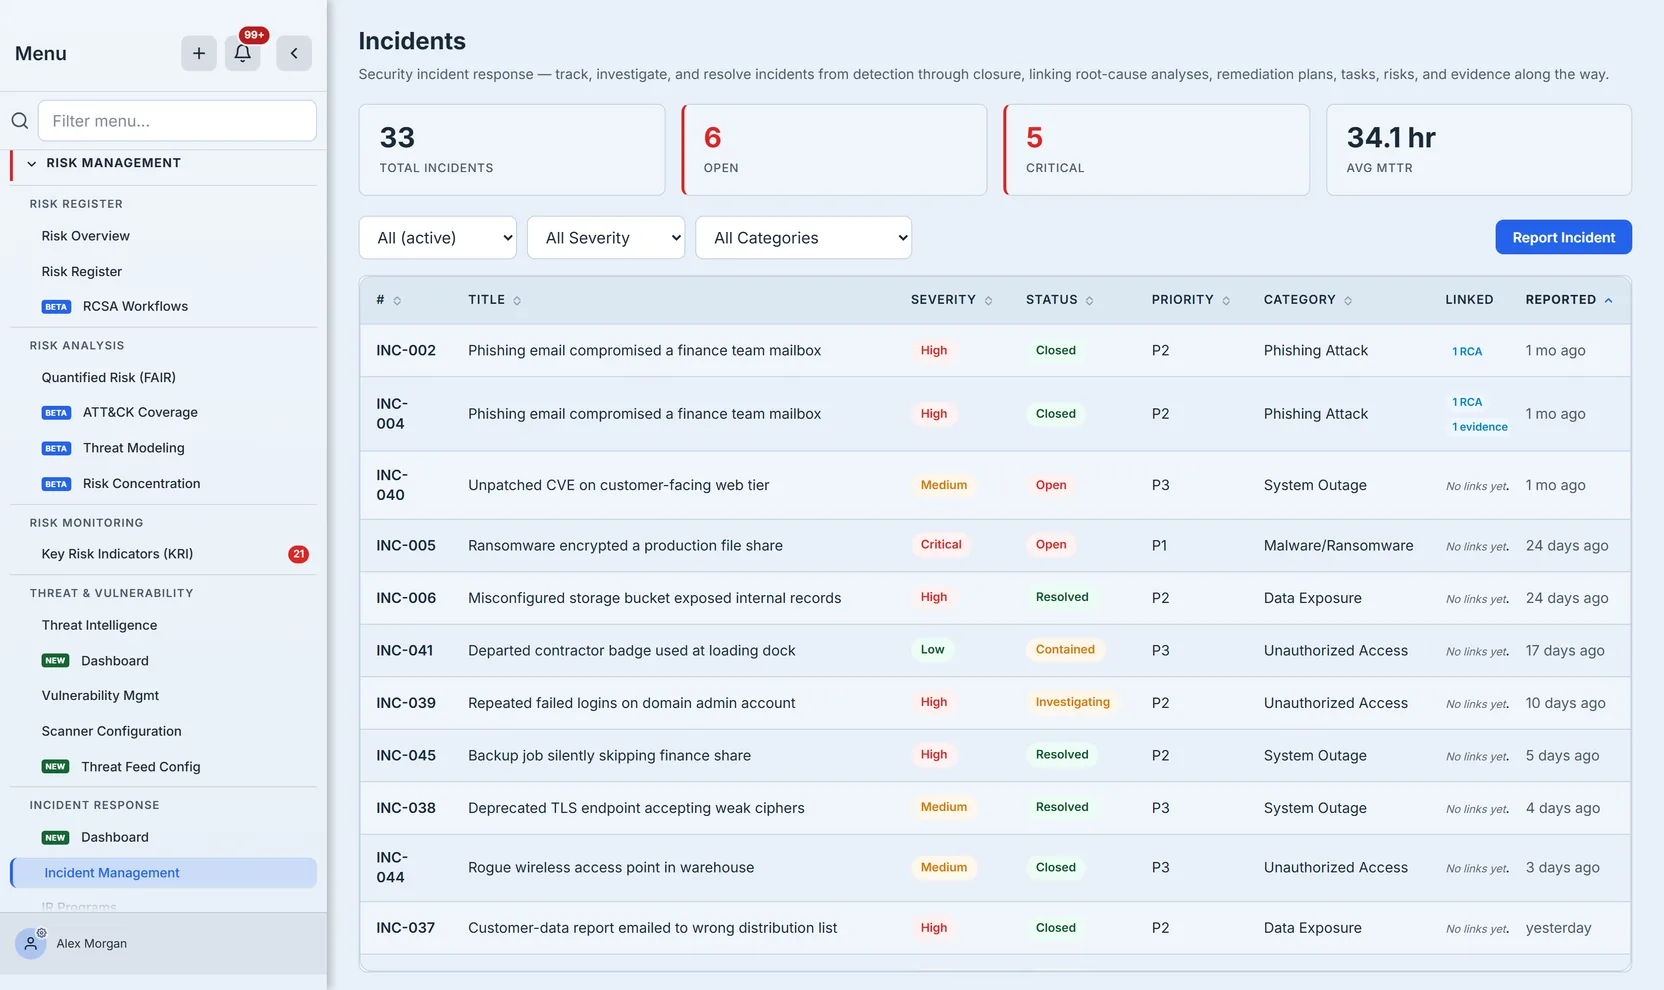
The register is the full log the dashboard rolls up. Each row’s linked column shows the records tied to it — “1 RCA,” “1 evidence,” or an honest “No links yet.” — and the reported dates span real time, from a month ago down to yesterday.
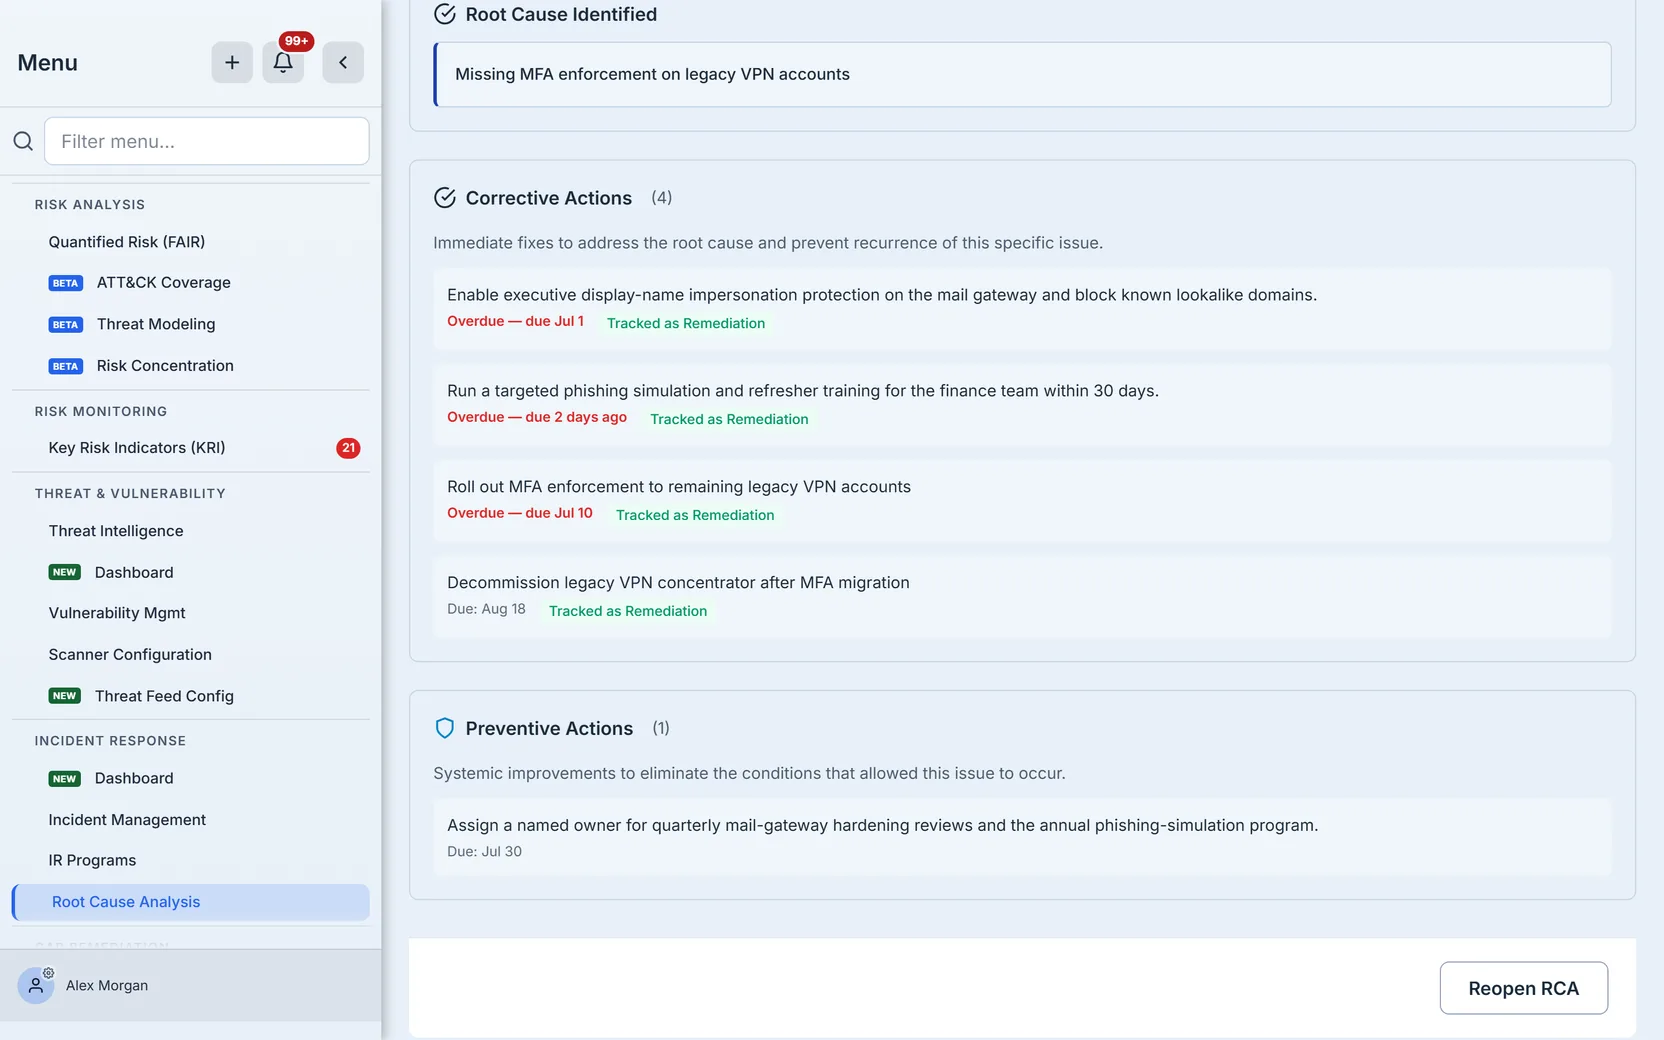
Open a completed RCA and the recorded root cause is right there — “Missing MFA enforcement on legacy VPN accounts,” the same string the dashboard’s recurring-causes bar counts — followed by the corrective actions it produced, each tracked as a remediation and flagged in red when it’s overdue.
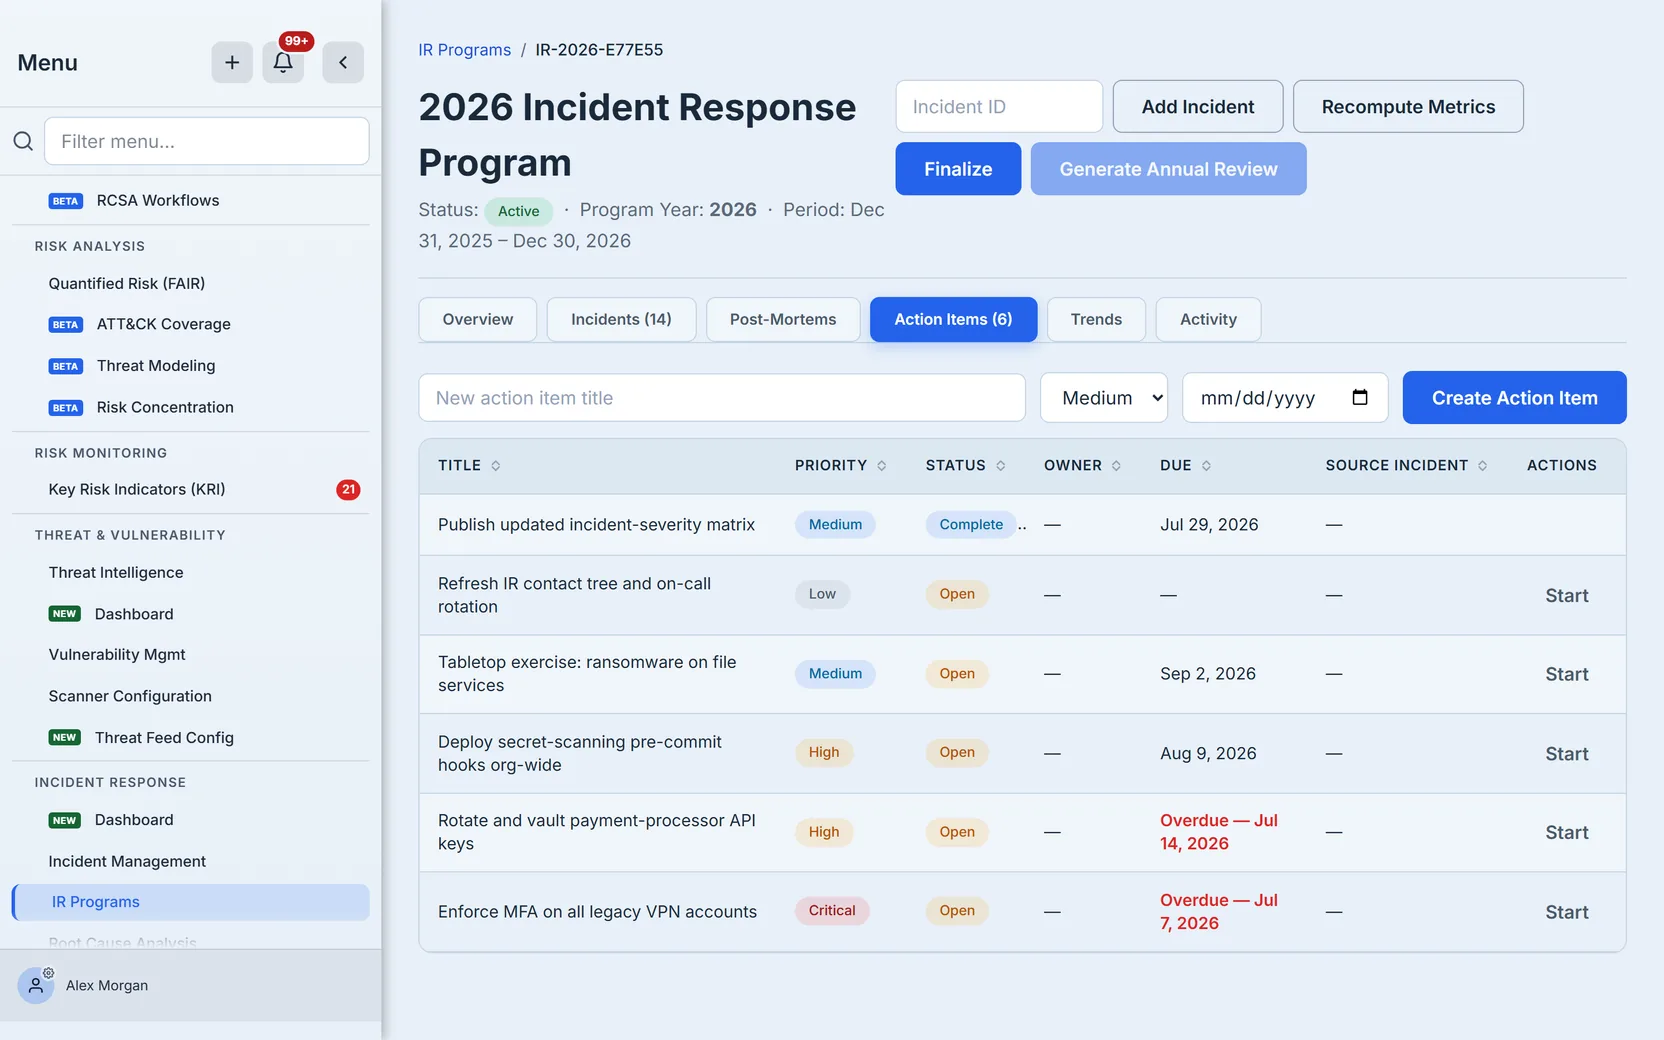
The program detail turns those lessons into a tracked queue: each action item carries a priority, a status, a due date — red when overdue — and the incident it came from.
What you walk away with
- Response-time medians that name their own clock and denominator — acknowledge/contain/resolve from real lifecycle timestamps, never an invented “detection” number.
- A backlog verdict you can’t argue with: reported vs resolved, week by week.
- RCA discipline as a checkable list, not a claim — including the incidents that resolved without one, and the root causes that keep recurring.
- A live SEC disclosure clock counting business days from a recorded, attributed materiality decision.
- An annual program record that turns lessons into dated corrective actions.
The incident lifecycle itself — reporting, triage, and root-cause analysis — is walked in Incident management and From incident to root-cause analysis; this dashboard is where all of it becomes a program you can report on. For the risk register those incidents feed, see Reading the Risk Overview dashboard.