Every risk framework ends at the same place: someone senior has to look at the whole program on a recurring cadence. ISO 31000 calls it monitoring and review, SOC 2 puts it in CC3 (the risk-assessment criteria) and CC4 (monitoring activities), and every risk committee charter says some version of “management shall review the risk register periodically.” What that review actually needs is one page where register health, treatment progress, leading indicators, financial exposure, and the risks you’ve chosen to live with are all current at the same moment.
The Risk Overview (/app/unified-risk) is that page: a read-only executive rollup computed live from the same records your team maintains in the register, the work-item hub, the KRI library, and the FAIR scenario engine. Nothing on it is entered by hand, so nothing on it can silently drift from reality. This article walks the page section by section — what each number measures, where the data lives, and which workflow moves it.
Who’s involved
- Risk lead / CISO — reads it weekly and before every committee meeting; works the top-risks and overdue queues.
- Risk owner — the person a drill-down lands on; keeps their risk’s scores, treatment, and review date honest.
- Treatment owner — shows up in the work-item counts; closes the items that move residual scores down.
- Auditor / examiner — follows the acceptance and exception hygiene panels to the formal decisions behind them.
How this page thinks
Three things to understand before reading any section:
- Snapshots, with one windowed exception. The date-range selector (Last 30 days / 90 days / 6 months / 12 months) re-queries only the Score Trend section — everything else is a deliberate point-in-time snapshot, because “how many risks are critical” doesn’t have a 30-day version. The page is honest about this rather than pretending every chart re-filters.
- Freshness. Every read is served through a 30-second cache; the freshness bar under the header shows when the data was computed and Refresh re-runs everything.
- Sections load, fail, and hide independently. A section whose module isn’t licensed (KRIs, quantified risk, control exceptions) disappears entirely rather than rendering empty; a section whose query hiccups shows its own retry without blanking the page.
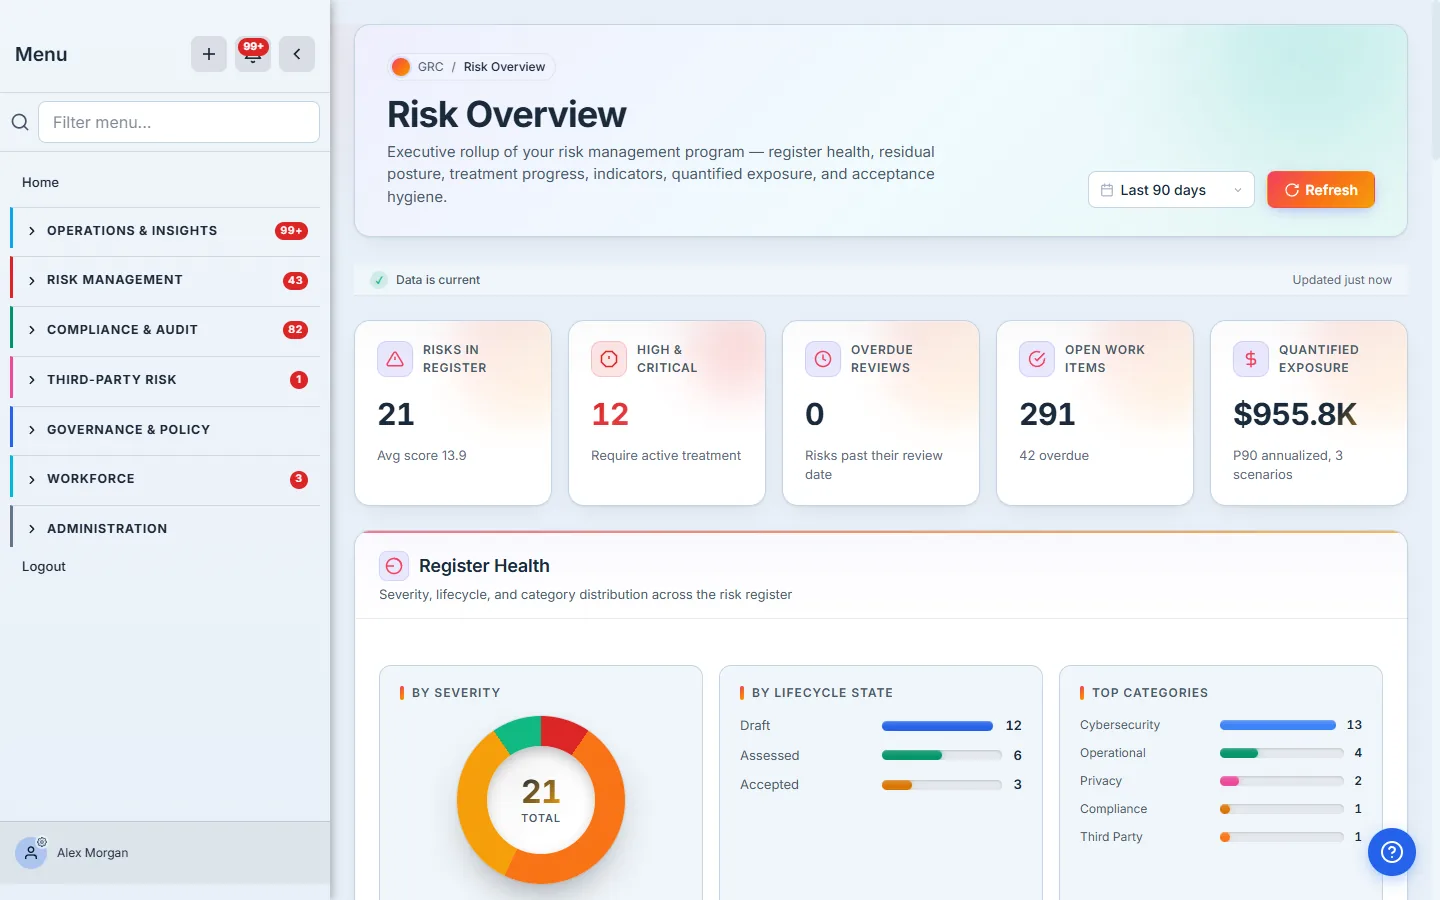
The KPI strip
Five numbers, four sources:
- Risks in Register — every non-watchlist risk, across all lifecycle states, with the average score as the subtitle. Watchlist (emerging, unscored) risks are deliberately excluded from every aggregate on this page. Populate it: The risk lifecycle, identify to quantify.
- High & Critical — risks whose current (inherent) level is high or critical. This is the pre-controls view; the Residual Posture section below shows what your controls buy back.
- Overdue Reviews — risks whose next-review date has passed. Review dates are set per risk (and by the cadence you pick at handoff); this number is the page’s nag counter.
- Open Work Items — treatment and remediation items not yet done, verified, accepted, or closed, with the overdue count as the subtitle. Fed by the work-item hub covered below.
- Quantified Exposure — the 90th-percentile (P90) annualized loss summed across simulated FAIR scenarios: a plausible bad year, in dollars. Only appears when the Quantified Risk module is licensed. Populate it: Quantified risk with FAIR.
Register Health
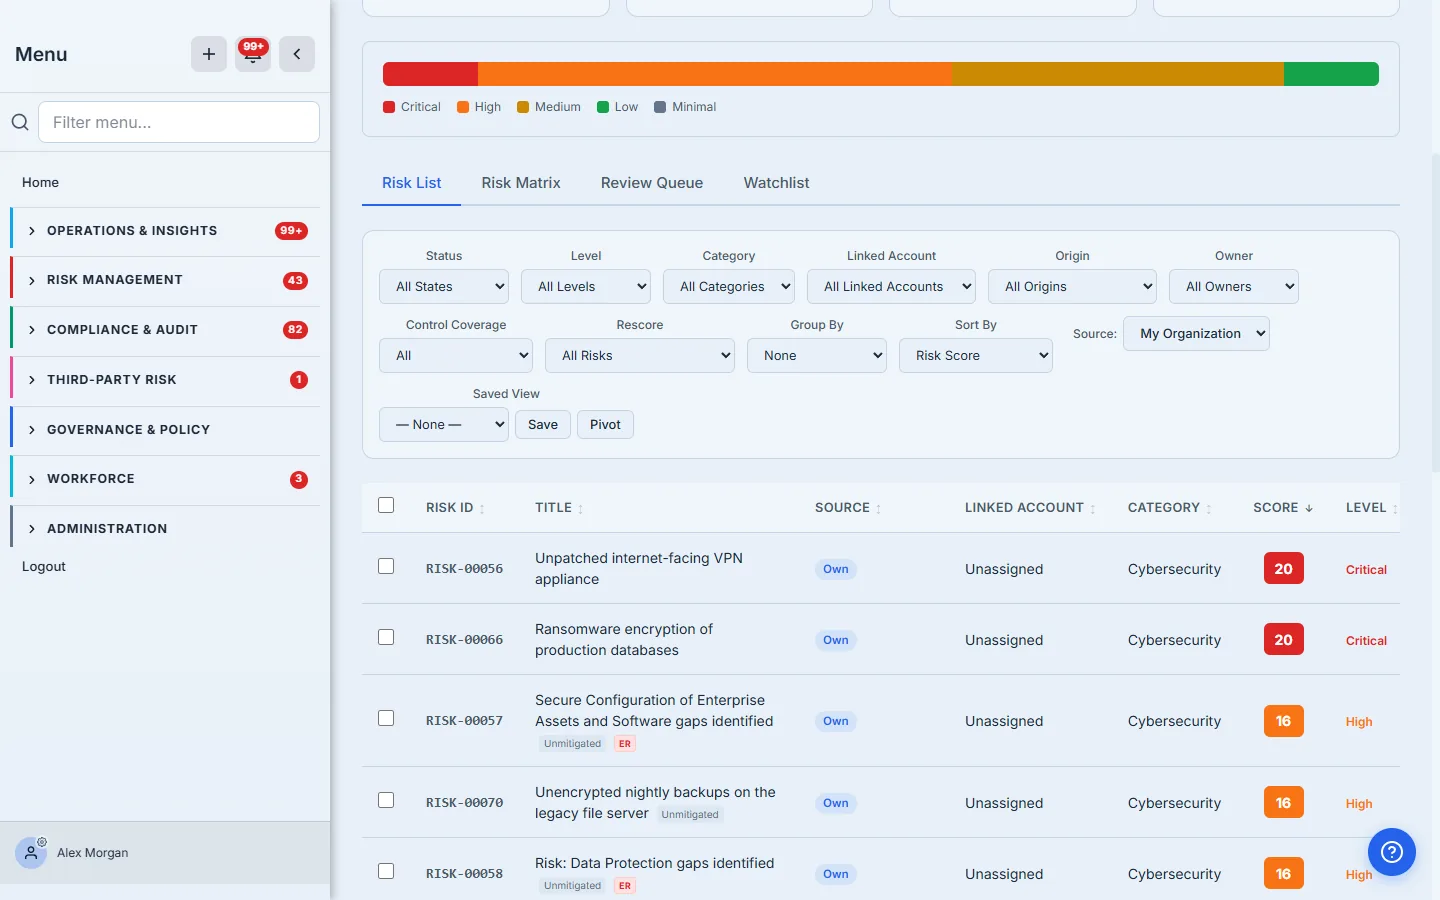
Three charts over the register: severity donut (critical through minimal, by current level), lifecycle-state bars (draft → triaged → assessed → in register → treating → accepted → monitoring), and the top risk categories.
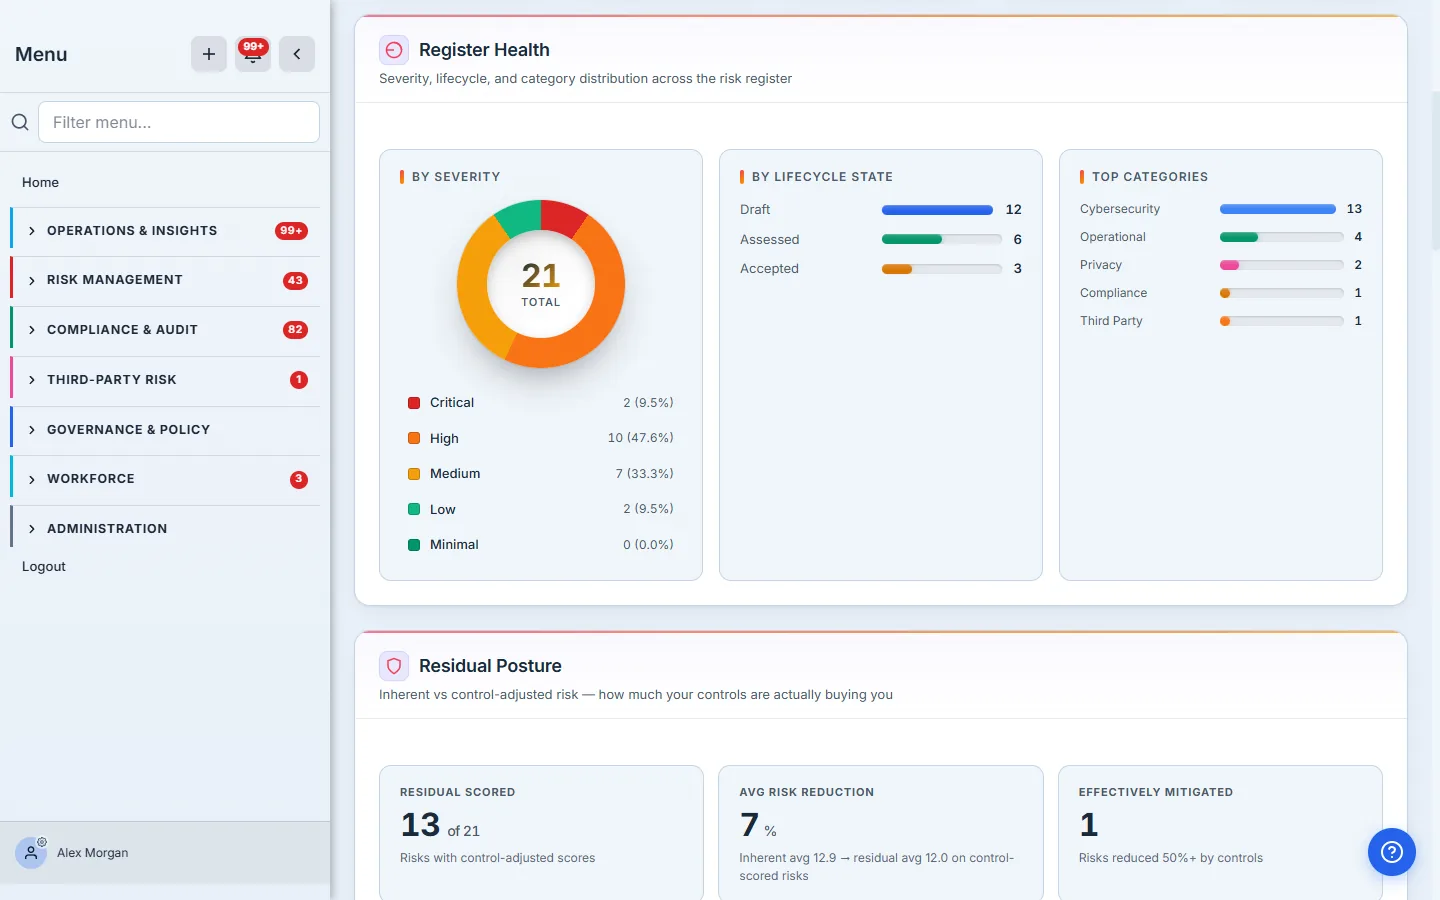
All of it is register data: severity comes from likelihood × impact scoring, lifecycle from the state machine every risk moves through, categories from the risk profile. A register stuck in draft is the chart telling you risks are being logged but never assessed — the lifecycle bars make process debt visible. Populate it: The risk lifecycle.
Residual Posture
The section that answers “what are our controls actually buying us.” Three metric cards — how many risks carry a control-adjusted residual score, the average percentage reduction from inherent to residual (computed over the same control-scored risks on both sides, so the arrow math is honest), and how many risks are effectively mitigated (reduced 50% or more) — plus side-by-side inherent and residual level distributions, each titled with its own denominator so the comparison can’t be misread.
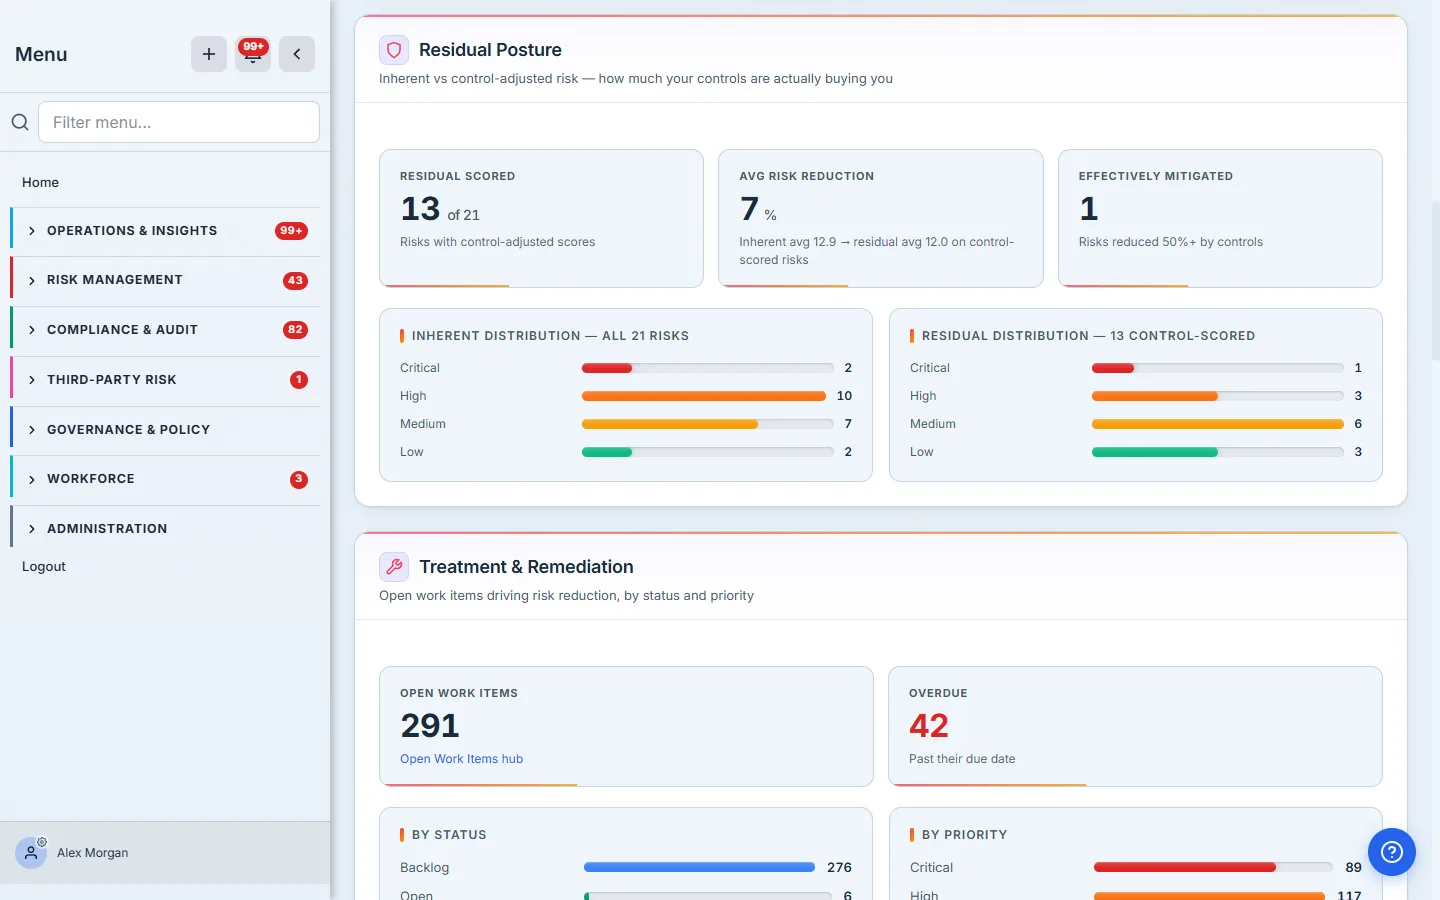
Residual scores exist only where you’ve linked controls to a risk and recalculated — so the “Residual Scored” card is really a coverage metric: 13 of 21 means eight risks have no control story yet. Linking controls on the risk’s case file and recalculating residual is the single highest-leverage action on this page. Populate it: The risk lifecycle.
Treatment & Remediation
Open work items driving risk reduction: total open and overdue cards, then distributions by status and priority. These are the same work items your team manages in the Open Work Items hub — created from risks, assessment gaps, and findings.
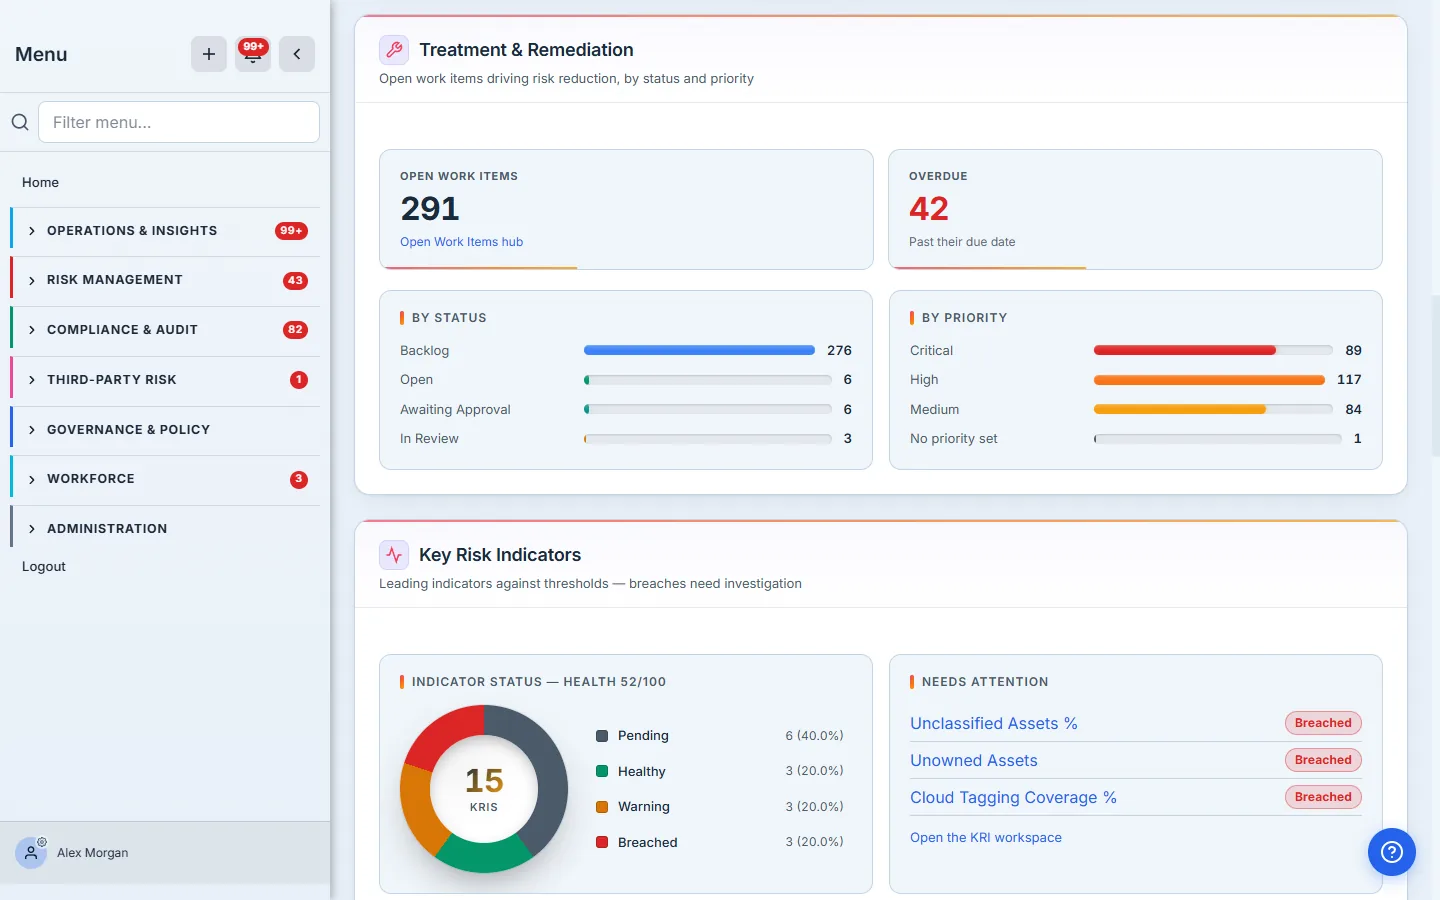
An overdue count in the red card is the earliest sign a treatment program is slipping — before any score moves. Populate it: From risk to verified remediation, Managing the remediation portfolio.
Key Risk Indicators
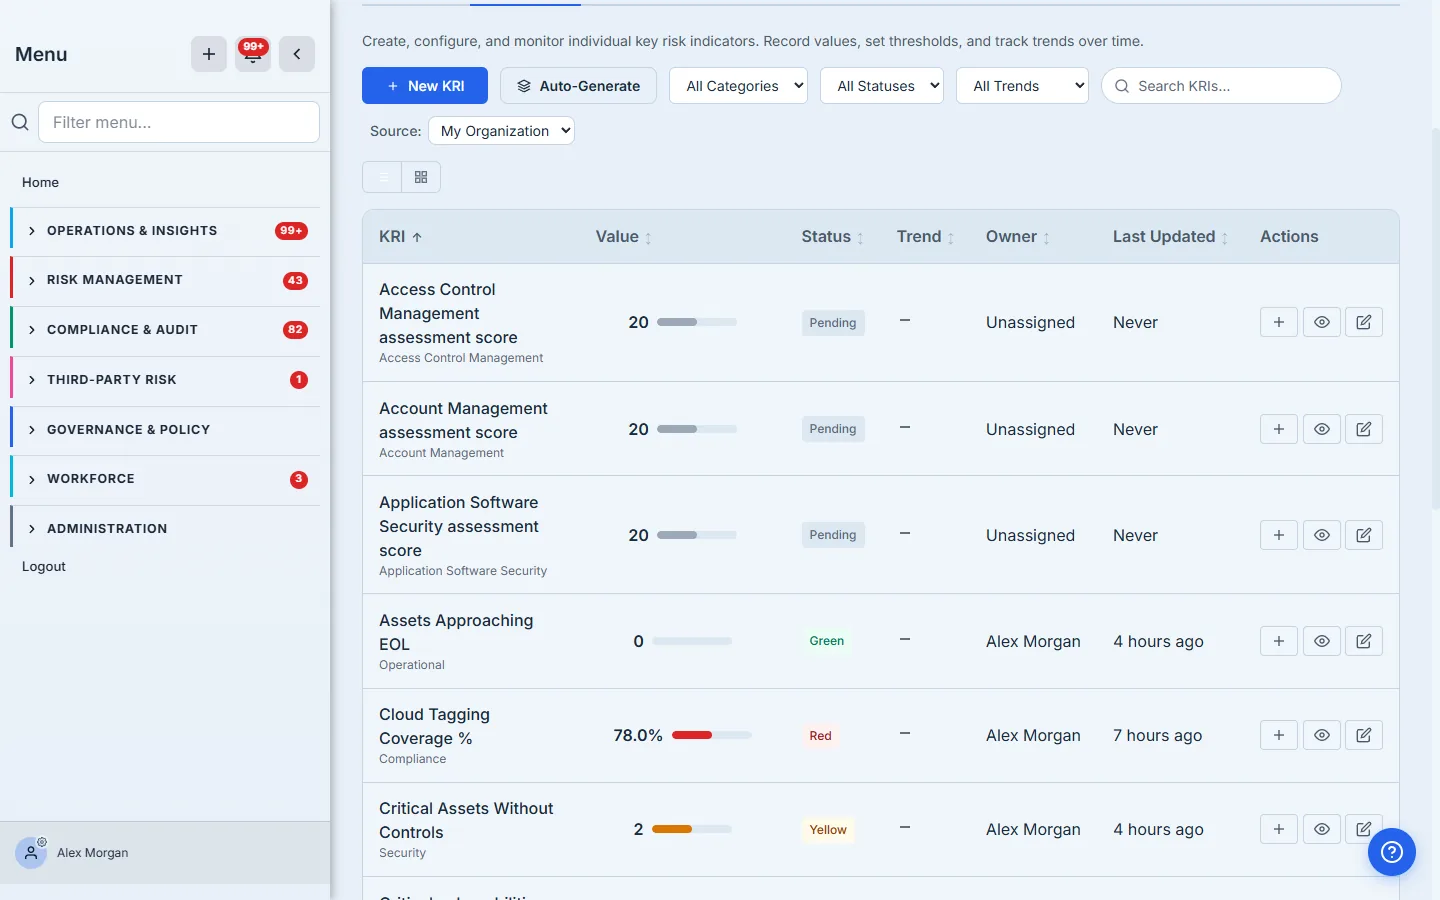
Leading indicators against thresholds. The donut shows every active KRI by status — green, yellow, red, plus pending for indicators awaiting their first measurement — with a 0–100 health score in the panel title. The needs-attention list names the KRIs that are red or have breached twice in a row, each linking to the KRI workspace.
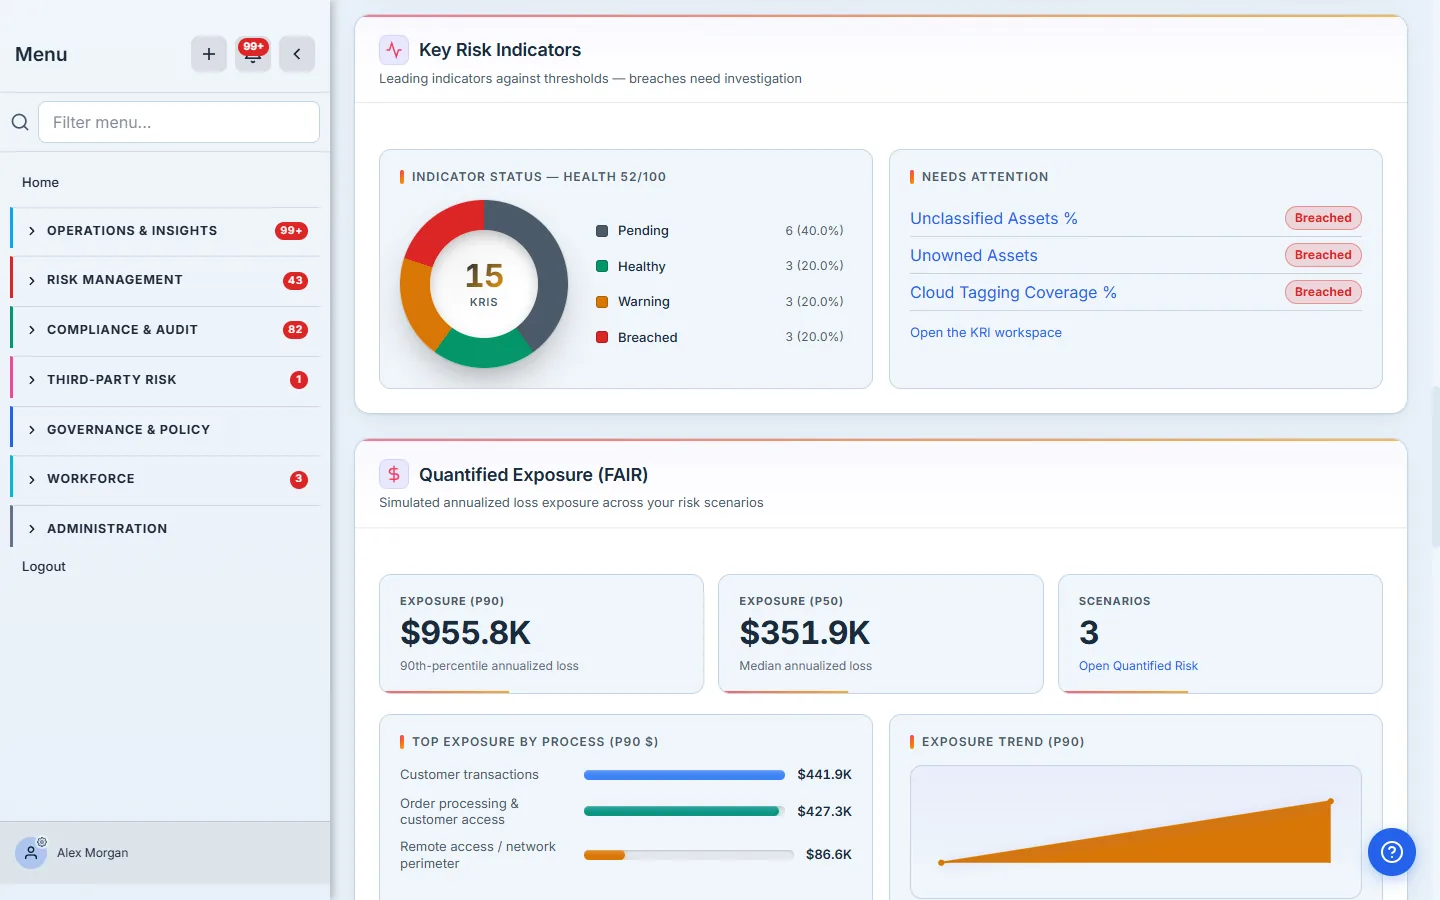
KRIs move when values are recorded — manually, on a collection schedule, or synced from platform metrics. A donut dominated by pending means indicators were defined but measurement never started; that’s a process finding, not a data error. This section only renders for orgs with the KRI module.
Quantified Exposure (FAIR)
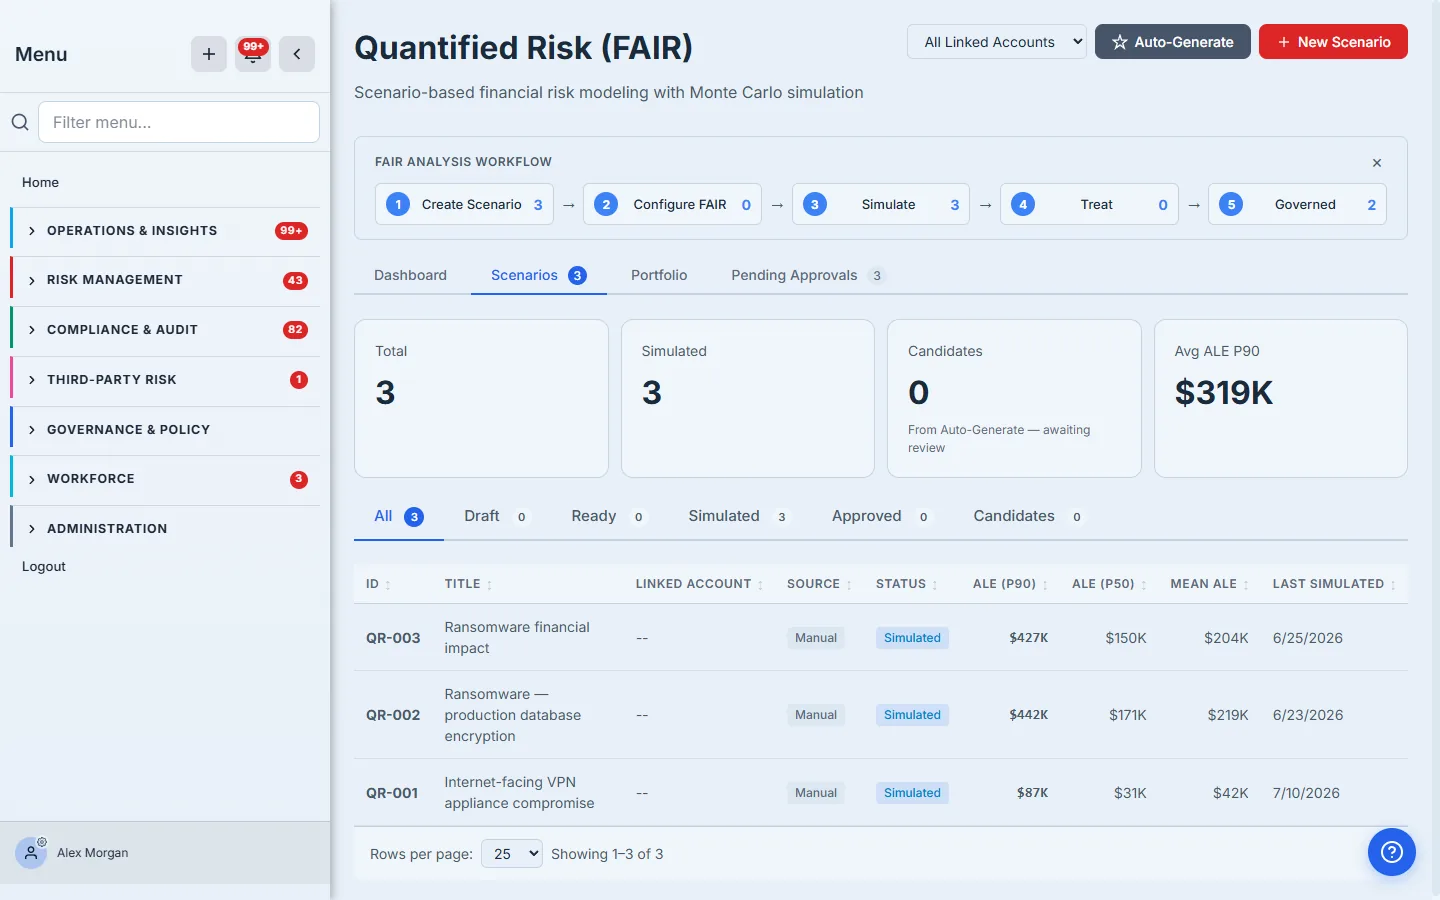
The financial view: P90 (90th-percentile annualized loss) and P50 (median) cards summed across simulated scenarios, a scenario count linking to the Quantified Risk workspace, the top business processes by P90 exposure, and a cumulative exposure trend.
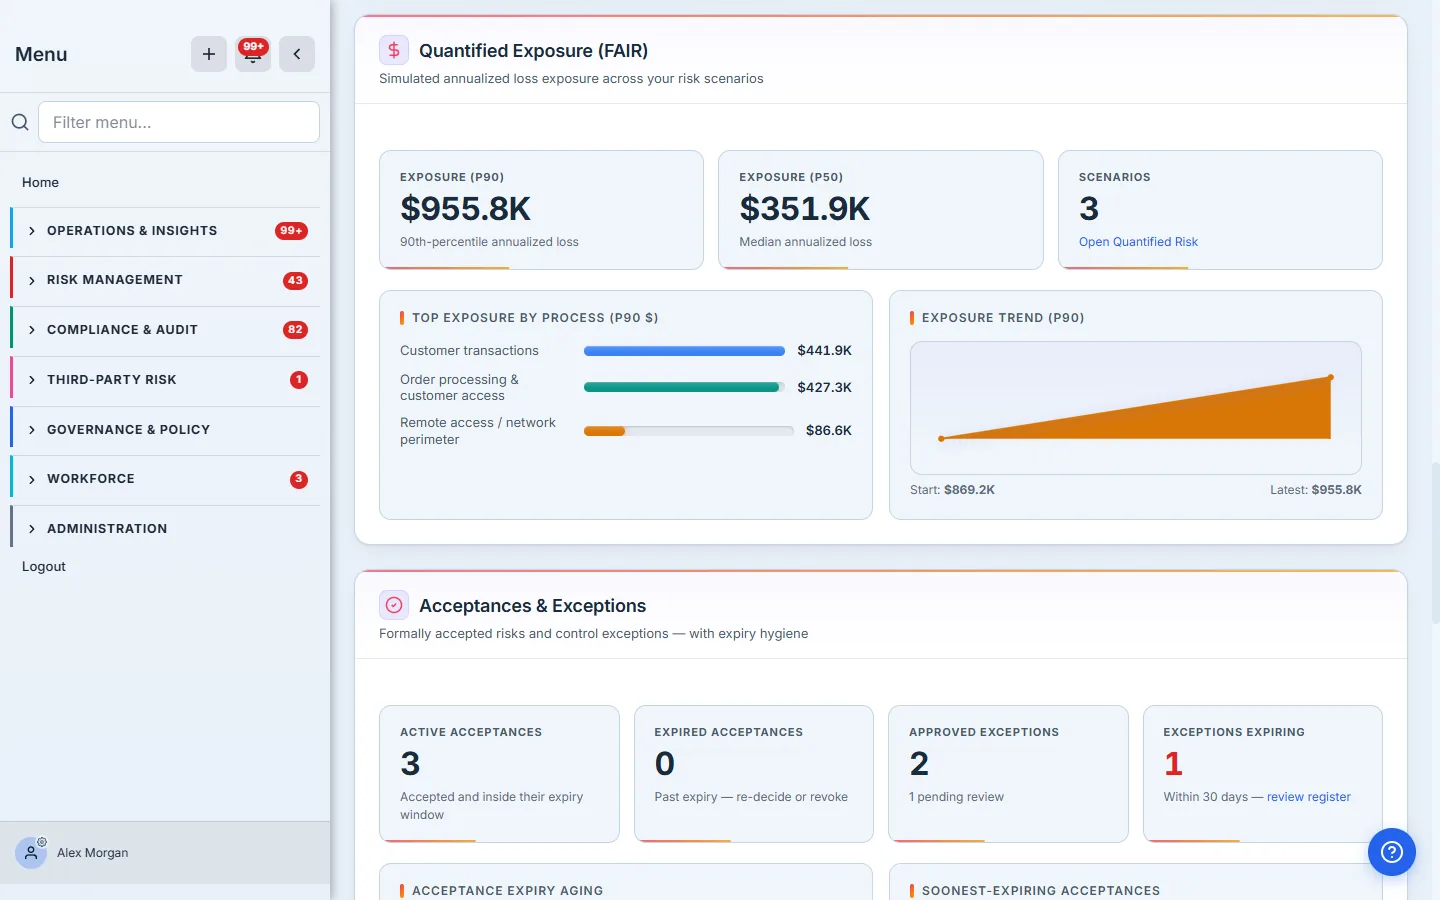
Only simulated or approved scenarios count — a drafted scenario contributes nothing until its Monte-Carlo run completes. The by-process bars read the business process named on each scenario, which is what makes exposure attributable (“order processing carries $430K of our P90”) instead of one blob number. The trend is cumulative as-of each month — every scenario contributes its current value from its latest simulation forward — so the line’s latest point always equals the P90 card, and the Start/Latest values under it anchor the magnitude. Populate it: Quantified risk with FAIR, Scenario analysis.
Acceptances & Exceptions
The governance-hygiene section — the risks and policy gaps you’ve formally decided to live with, and whether those decisions are still in date.
- Acceptances (left half): active count, expired count (red when any acceptance has outlived its expiry without being re-decided or revoked), an expiry-aging bar list (≤30 / 31–60 / 61–90 days), and the soonest-expiring acceptances by name — each linking to the risk’s case file.
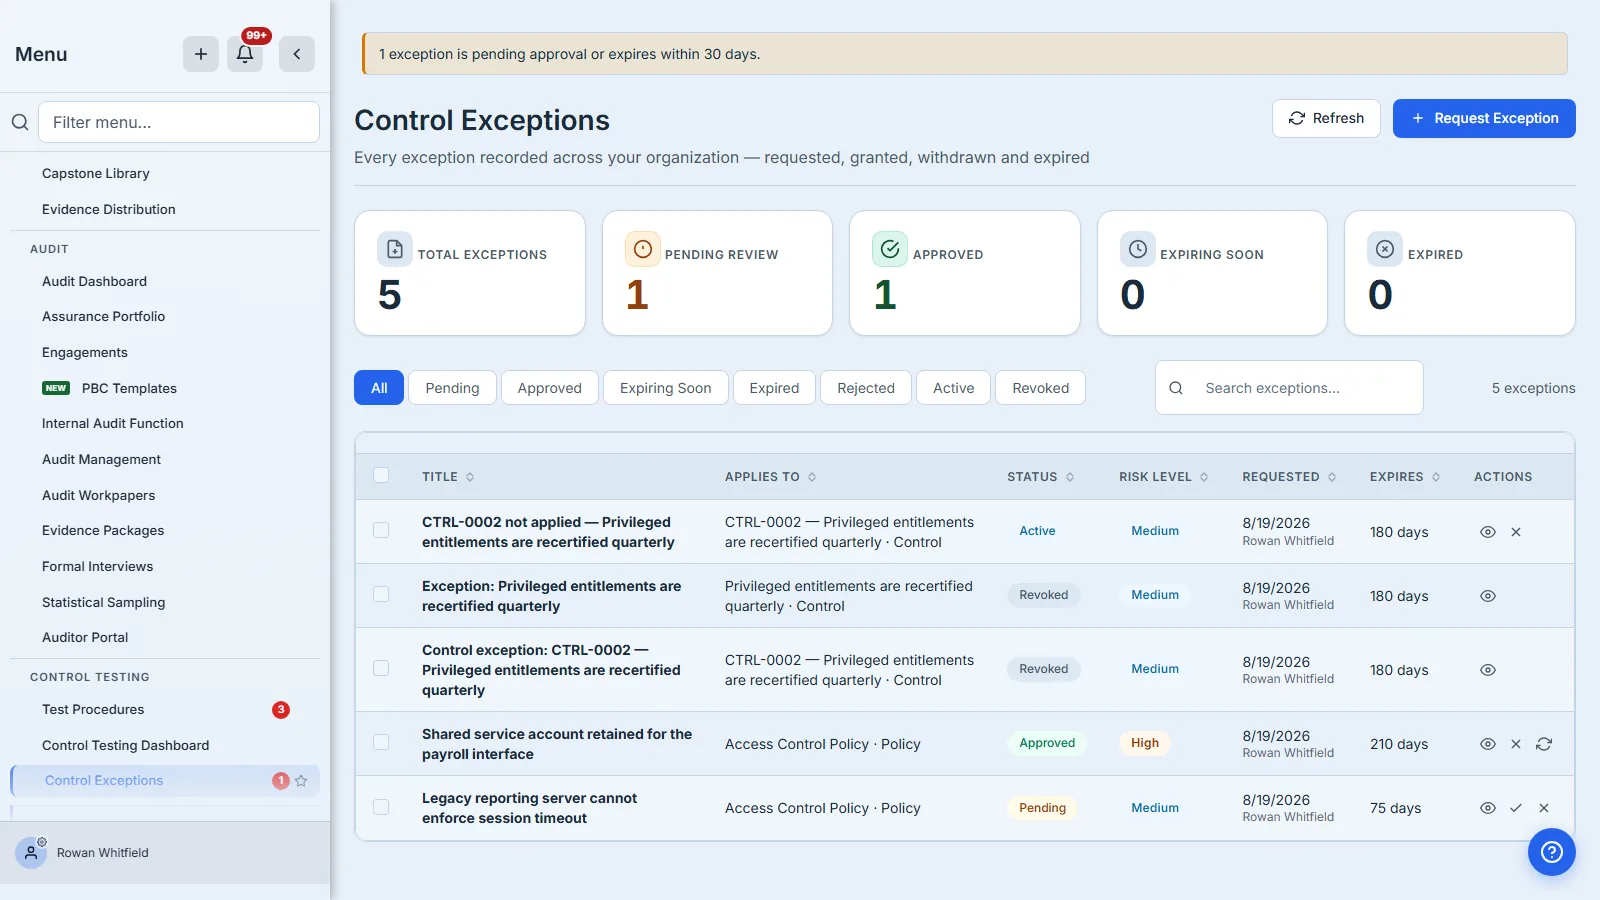
- Exceptions (right half): approved and pending-review counts plus an expiring-within-30-days card linking to the Control Exceptions register.
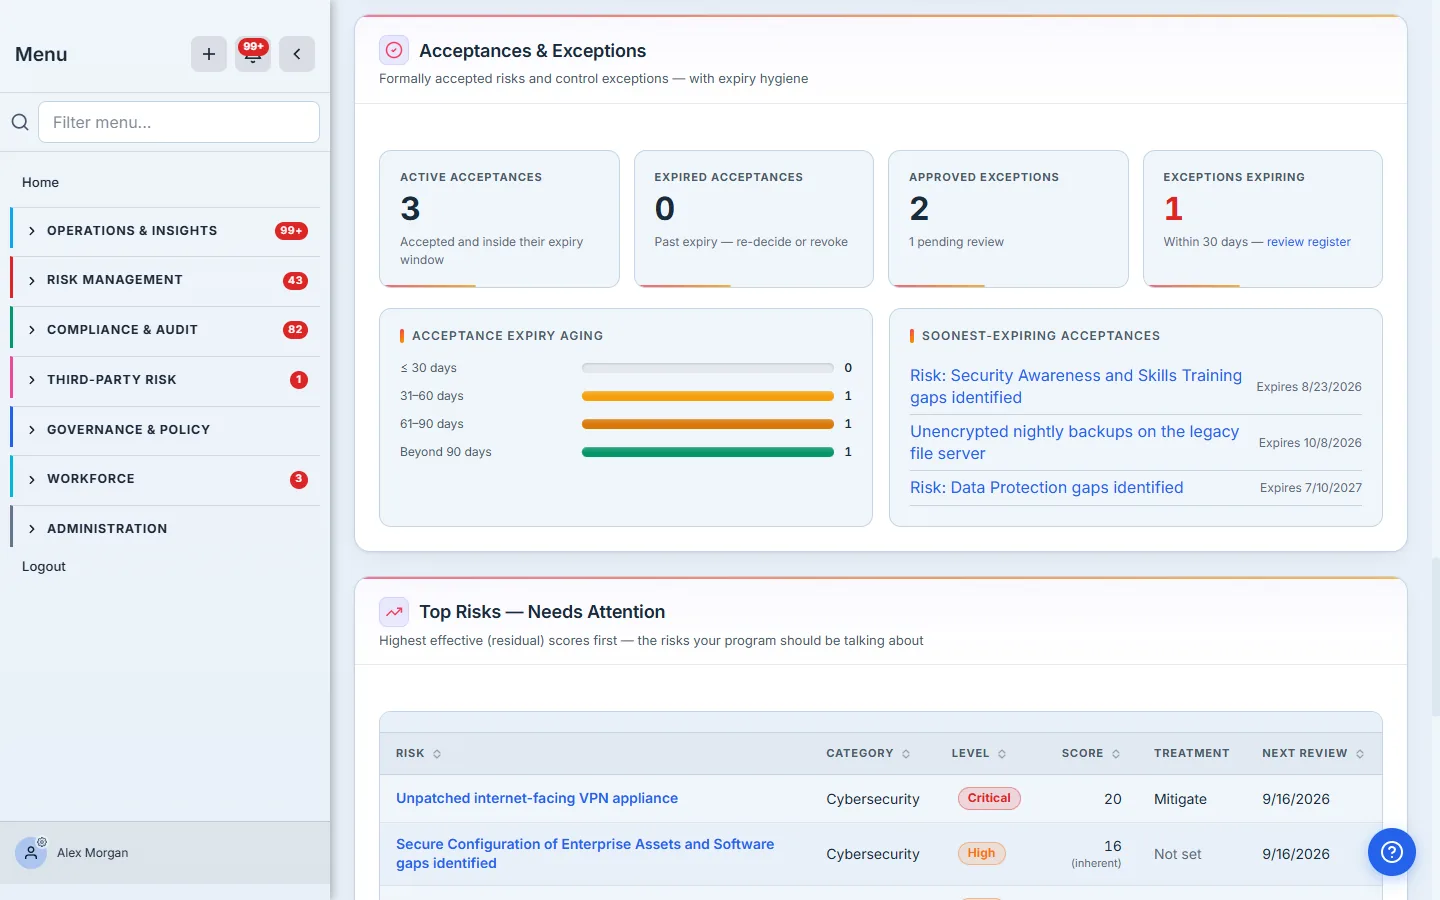
Acceptances are created from the risk case file — either the Accept action on an in-register risk or the accept treatment at assessment handoff — always with a rationale and an expiry, and every acceptance auto-drafts a Risk Acceptance Memo for the audit trail. Exceptions come from the Control Exceptions register, where requests carry a business justification and compensating controls through an approval flow. A dedicated guide to acceptance and exception governance is in our writing queue; until it lands, the accept decision is covered in The risk lifecycle.
The discipline this section enforces is simple: accepted is a state with a clock on it. An expired acceptance isn’t a formality — it’s a risk nobody is currently accountable for.
Top Risks — Needs Attention
The ten highest risks by effective score — residual where it exists, inherent otherwise (rows scored only inherently say so with an “(inherent)” hint). Columns cover category, level, score, treatment strategy, and next review date, with overdue reviews in red. Closed risks are filtered out; every title links to the risk’s case file.
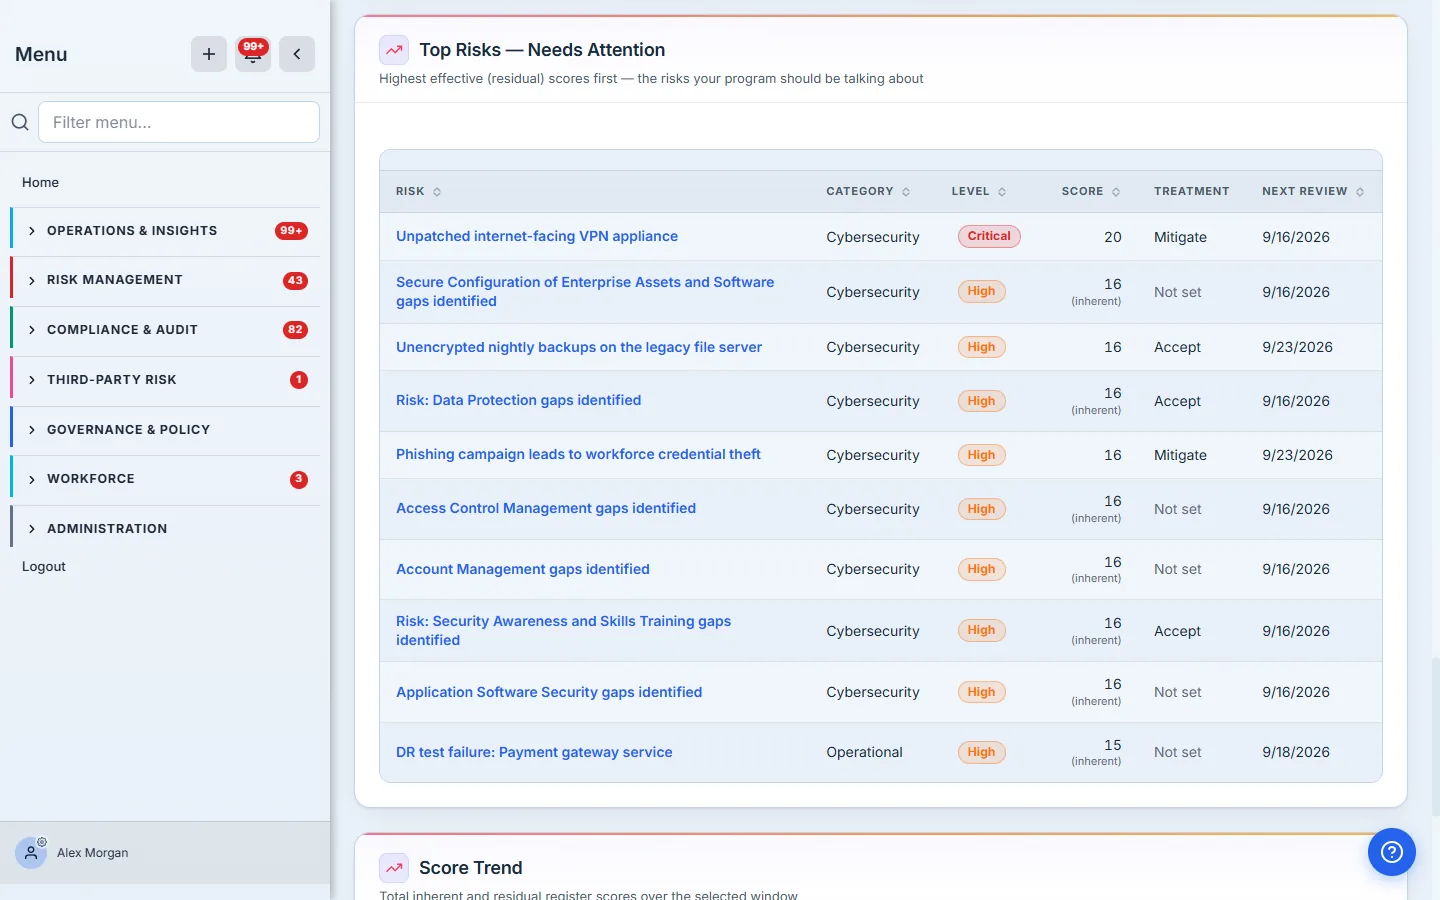
This is the list your committee meeting should start from. If the top ten doesn’t match what leadership believes the top risks are, either the register is stale or the belief is — both findings worth having.
Score Trend
Total inherent and residual register scores over the selected window — the one section the date-range selector re-queries. Points come from nightly register snapshots (each risk’s latest score is carried forward between captures, so the portfolio total is always a full-register number), each sparkline states its Start and Latest values, and the footer gives the risks in scope plus the current inherent→residual reduction across the control-scored risks. If your org predates the snapshot job, early history is reconstructed from assessment audit events and labeled as such.
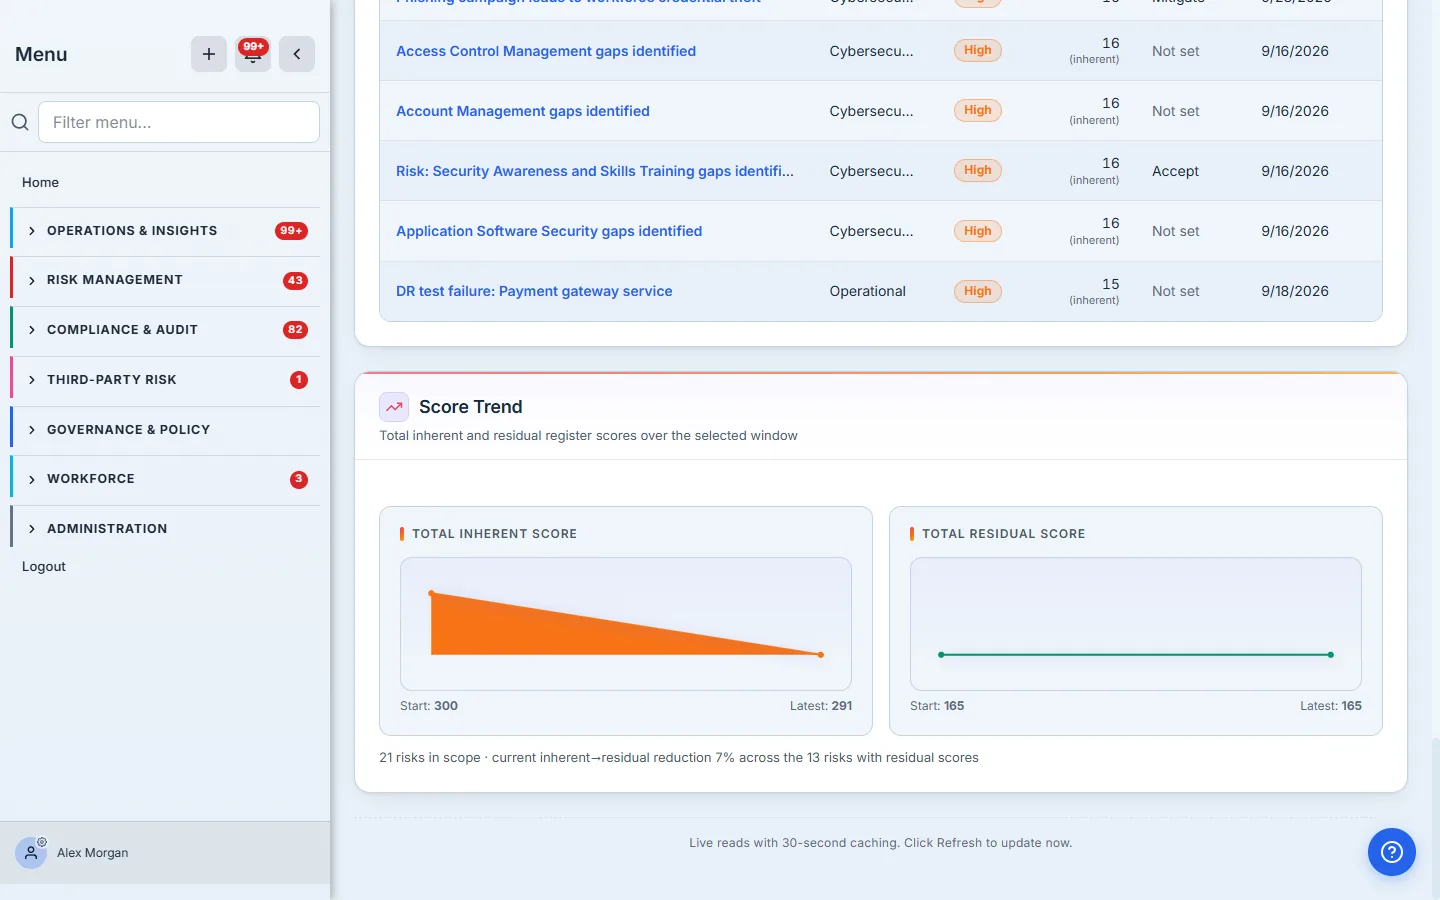
Two lines converging means controls are gaining ground; parallel lines mean the register is growing as fast as it’s being treated. Either way, the trend only moves when scoring activity happens — it is a measure of the program, not a decoration.
Where the numbers come from
Every section above is fed by an operational surface you can open right now:
- The Risk Register (
/app/risks) — create, score, treat, accept; the lifecycle stepper shows where every risk sits.
- Quantified Risk (
/app/risk/quantified) — build and simulate FAIR loss scenarios; each simulated scenario feeds the exposure cards the moment its run completes.
- The KRI workspace (
/app/grc/kri) — define indicators, set thresholds, record values; statuses recompute on every measurement.
- Control Exceptions (
/app/control-exceptions) — request, approve, renew and withdraw exceptions with expiry dates. The register holds three kinds: policy exceptions, control exceptions, and vendor-finding risk acceptances. Its tabs mirror the dashboard’s counts, though the dashboard counts policy exceptions only, so the two figures answer different questions.
What you walk away with
Read weekly, the Risk Overview answers the four questions a risk program is actually accountable for:
- Is the register real? (Register Health — lifecycle distribution exposes logged-but-never-assessed debt.)
- Are controls working? (Residual Posture — coverage and reduction, not just intent.)
- Is anything about to bite? (KRIs red, reviews overdue, acceptances expiring, treatment slipping.)
- What would it cost? (Quantified Exposure — in dollars, attributable to business processes.)
And because every number is computed from the operational records — never keyed into a slide — the version your committee sees is the version that’s true.