A compliance program is really four programs pretending to be one: the frameworks you claim, the assessments that measure the claim, the controls that make it true, and the evidence that proves it stayed true. Auditors probe the seams between them — a mapped control with no test, a passed test with no evidence, evidence that quietly expired last quarter.
The Compliance Dashboard (/app/compliance/dashboard) is the seam-watcher: an executive rollup computed live across all four layers, for every framework you run — SOC 2, ISO 27001, HIPAA, PCI DSS, CIS, NIST CSF, and the rest — in one page. This article walks it section by section: what each number measures, where the data lives, and which workflow moves it.
Who’s involved
- Compliance lead — owns the rollup; works the Needs Attention table and the gap and expiry queues.
- Control owners — appear through test results and the evidence attached to their controls.
- Assessment participants — drive the run pipeline and the per-framework scores.
- Auditor — follows each card into the framework’s full case file.
How this page thinks
- Live reads with short-lived caching. The freshness bar says when the data was computed; Refresh re-runs all seven backing reads together.
- Every ratio names its denominator. “Of controls with a test result”, “across active frameworks” — the subtitles are part of the metric.
- Sections degrade independently. Control testing, exceptions, and the three evidence sources are separately feature-gated; a user without one of them sees the rest.
- Four different claims, four different numbers, never conflated. Adopted (the control exists in your register and maps to this framework) → triaged (someone has made a call about it) → implemented (it’s actually in place) → tested (it demonstrably works) → evidenced (you can prove it did). A control can be adopted and untriaged. Triaged and unimplemented. Implemented and untested. Tested and unevidenced. Each of those gaps is a real audit finding waiting to happen, and the page gives each one its own number rather than rolling them into a single reassuring percentage.
The KPI strip
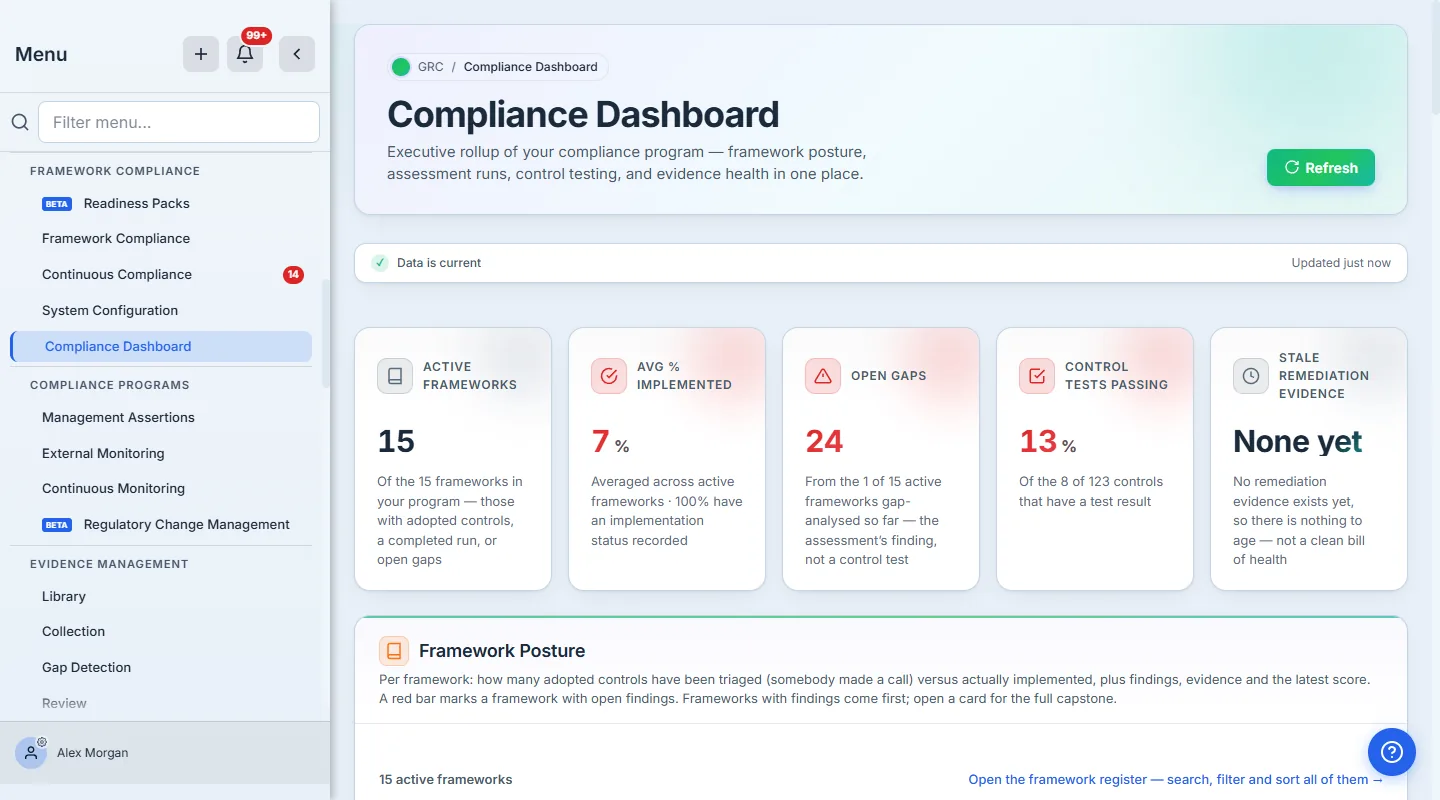
- Active Frameworks — frameworks with adopted controls, a completed run, or open gaps. Activating one is a deliberate act: apply a readiness pack, adopt controls from the control library, or complete an assessment.
- Avg % Implemented — the share of each framework’s adopted controls actually marked implemented, averaged across active frameworks. Its subtitle carries a second, softer number: how many controls have any implementation status recorded at all. Those two are deliberately different questions — “someone has made a call about this control” is hygiene; “the control is in place” is the claim you’d defend to an auditor. A program can be 100% triaged and 8% implemented, and most young programs are.
- Open Gaps — requirements still failing in each framework’s latest gap analysis, de-duplicated. Its subtitle tells you how much of the program that number actually covers: here, 24 gaps drawn from the 1 of 15 active frameworks that have been analysed. A gap count that quietly averaged over fourteen never-analysed frameworks would be the most flattering — and most useless — number on the page. This is also a different measurement from control testing: a gap analysis scores the framework’s own requirements from an assessment run, while control testing exercises the controls in your register. That is why 24 open gaps can sit beside zero failed tests. Red when non-zero.
- Control Tests Passing — passed ÷ (passed + failed + partial), over controls that have a test result. A partial counts against you here — and a control only counts as passed when both legs pass. Design-tested but never exercised? That’s partial, not passed.
- Stale Remediation Evidence — remediation evidence older than 90 days. Note the qualifier: this counts evidence attached to assessment remediation items, not your whole artifact library. Expired library artifacts are a different pool and are counted on the framework cards below. Two numbers, two populations — the titles say which is which, because a green zero sitting above a row of red counts is exactly how a dashboard loses a reader’s trust.
Framework Posture
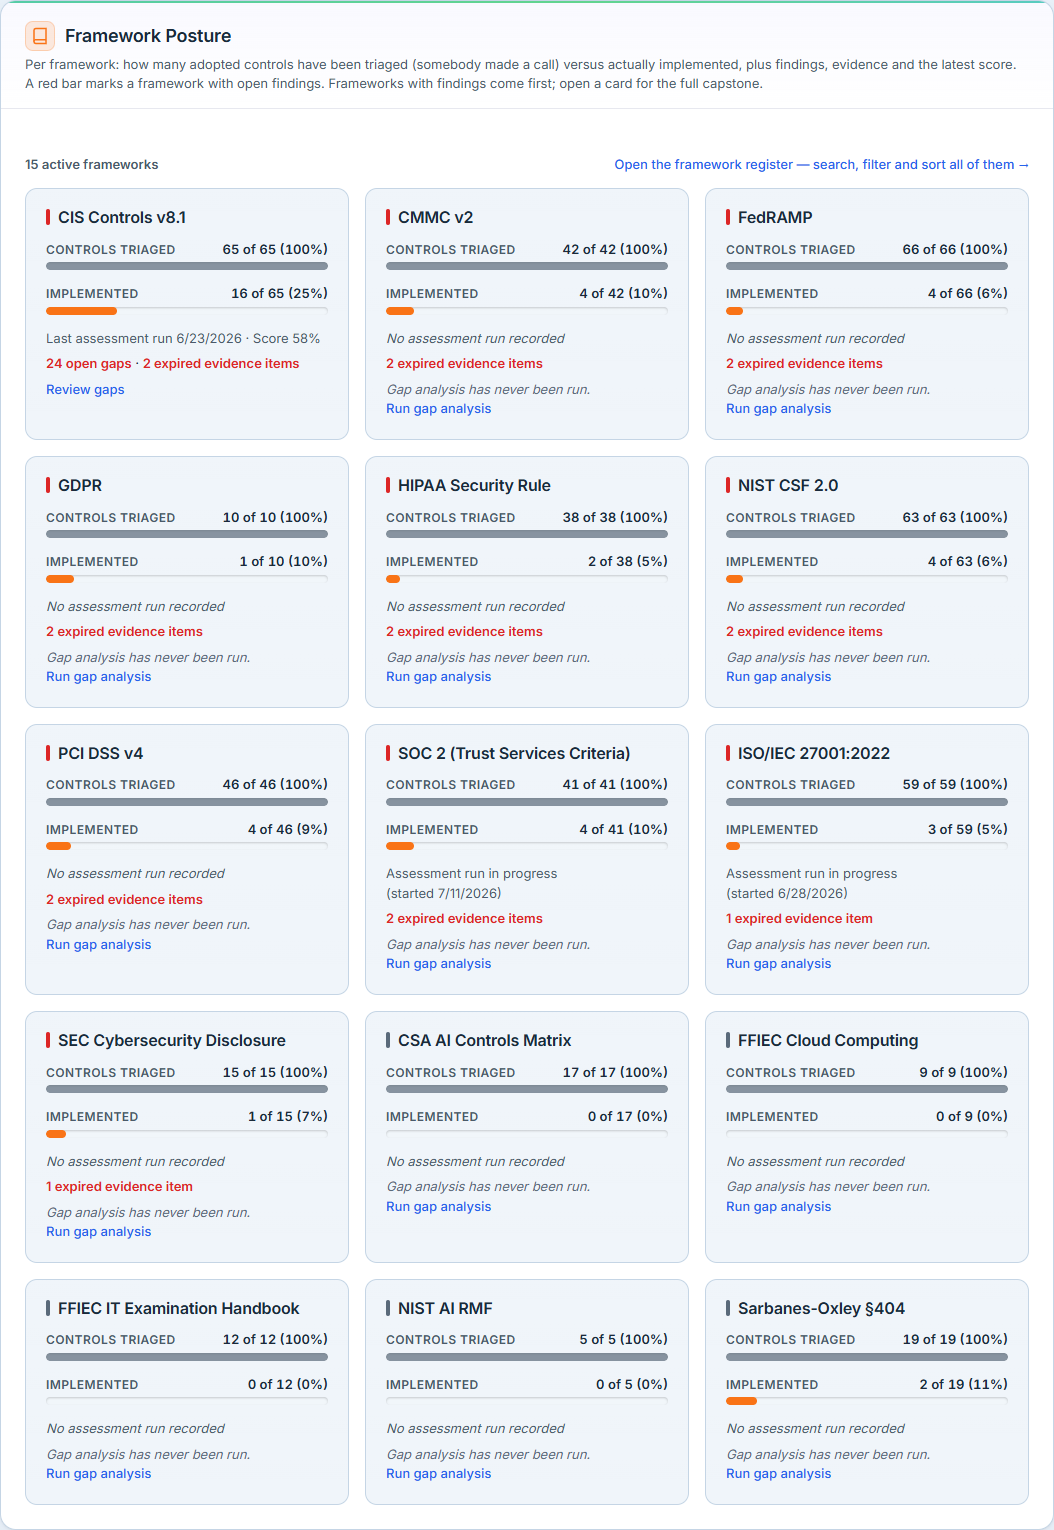
One card per active framework, the ones needing attention first: how many of its adopted controls are triaged and how many are actually implemented, the latest run — “Last assessment run” with its score when completed, “Assessment run in progress” with its start date when one is still open, “No assessment run recorded” when there’s nothing to report — and the sharpest open issue. Every card is a link into that framework’s full capstone case file.
The two bars are the whole argument. Every framework in the shot below is 100% triaged — someone has made a call on every adopted control. Not one is above 25% implemented. Roll those into a single “coverage” number and the program looks finished; split them and you can see precisely how much work is left.
Read the gap-analysis line carefully, because the page is careful about it. A green “Gap analysis clean — no open gaps” means an analysis ran and came back clean. A framework that has never been analysed says “Gap analysis has never been run” in neutral grey — followed by a link that runs one. Zero findings because you looked and zero findings because you never looked are not the same claim, and a compliance tool has no business rendering them the same colour. And because that line renders on its own row rather than as a fallback, a framework carrying an unrelated finding can’t suppress the disclosure and pass for assessed-and-nearly-clean.
Populate it: apply a readiness pack (activates the assessment, adopts mapped starter controls, seeds evidence slots), adopt controls from the Common Control Library, or run the assessment. To see one framework’s answers projected onto another, use the crosswalk projection.
Assessment Runs
The run pipeline: a status donut over every compliance run — including CIS and NIST CSF runs from the legacy engine — an In Progress panel naming each run still in flight with its due date, and a table carrying per-run progress, start date, and due date (overdue dues in red).
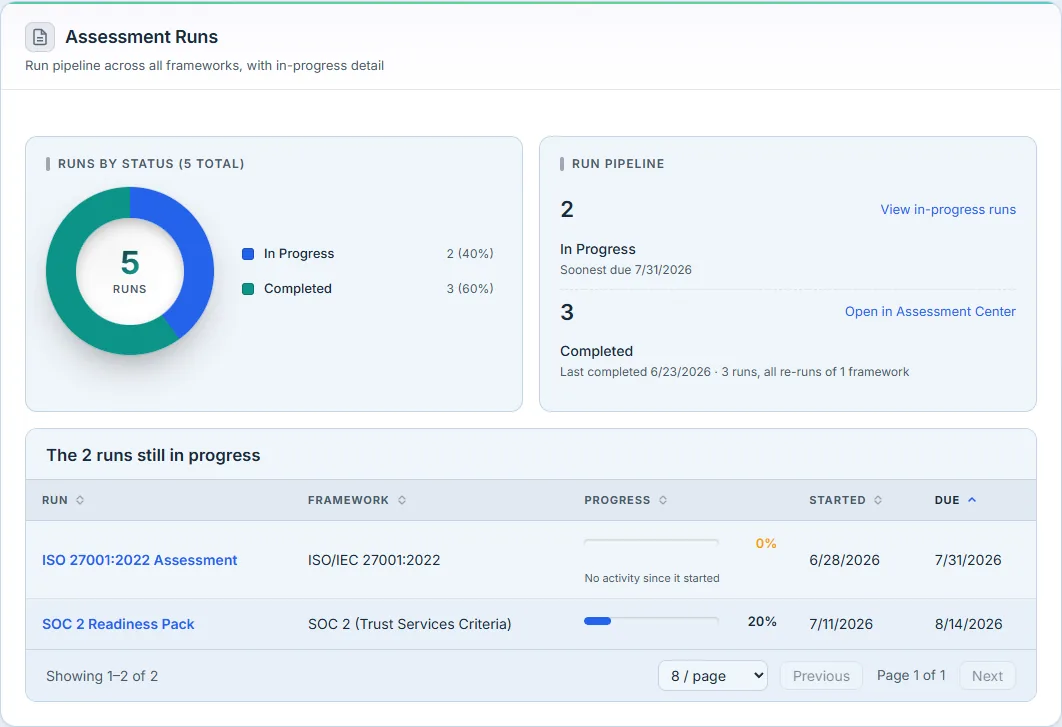
Runs start in the Assessment Center; completing one triggers the gap analysis that feeds the Open Gaps counts above. Due dates are set on the run’s case file (Run Summary card). Populate it: from assessment to auto-generated GRC, and for splitting a large assessment across a team, multi-user collaboration.
Control Testing & Exceptions
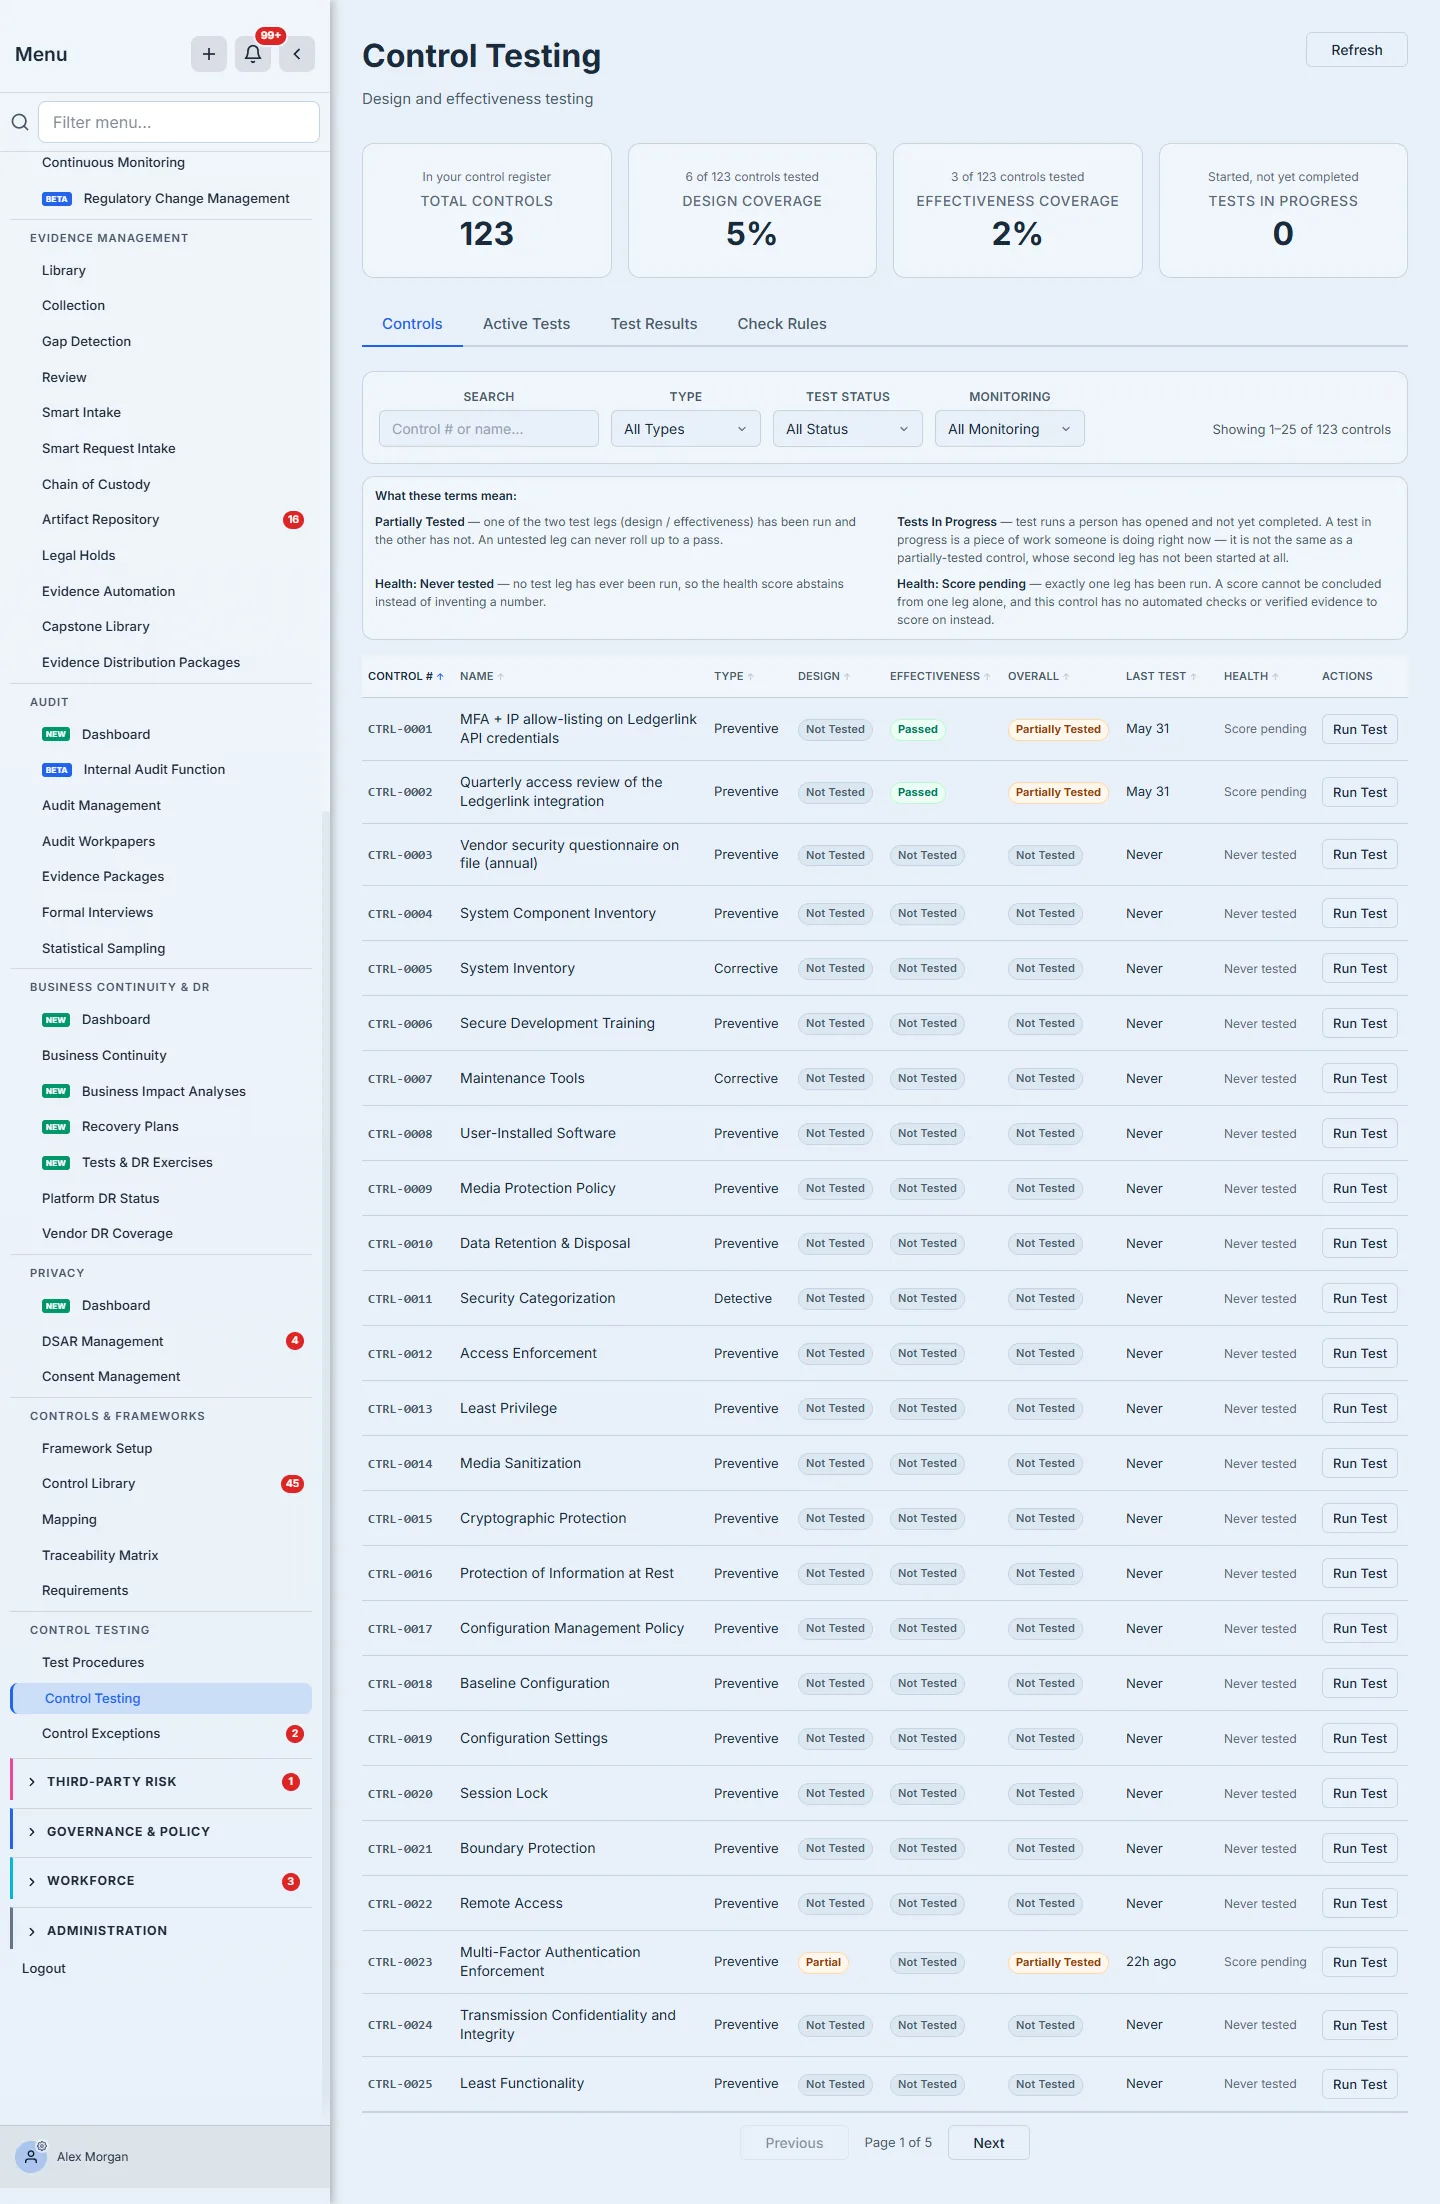
The “does it actually work” layer: total controls, test coverage (with the design/effectiveness split), the latest overall results as a passed/partial/failed/not-tested breakdown, and the exception register’s approved waivers — with an expiring-soon count linked straight to the register.
Every control carries two test legs — design (is it built to work?) and operating effectiveness (does it actually work in practice?) — and the roll-up refuses to call a control passed until both have been exercised. A control whose design passed but whose effectiveness was never tested reads Partially tested, not passed, and its health score abstains rather than awarding full marks. That’s the difference between “we checked” and “we checked half of it and assumed the rest.”
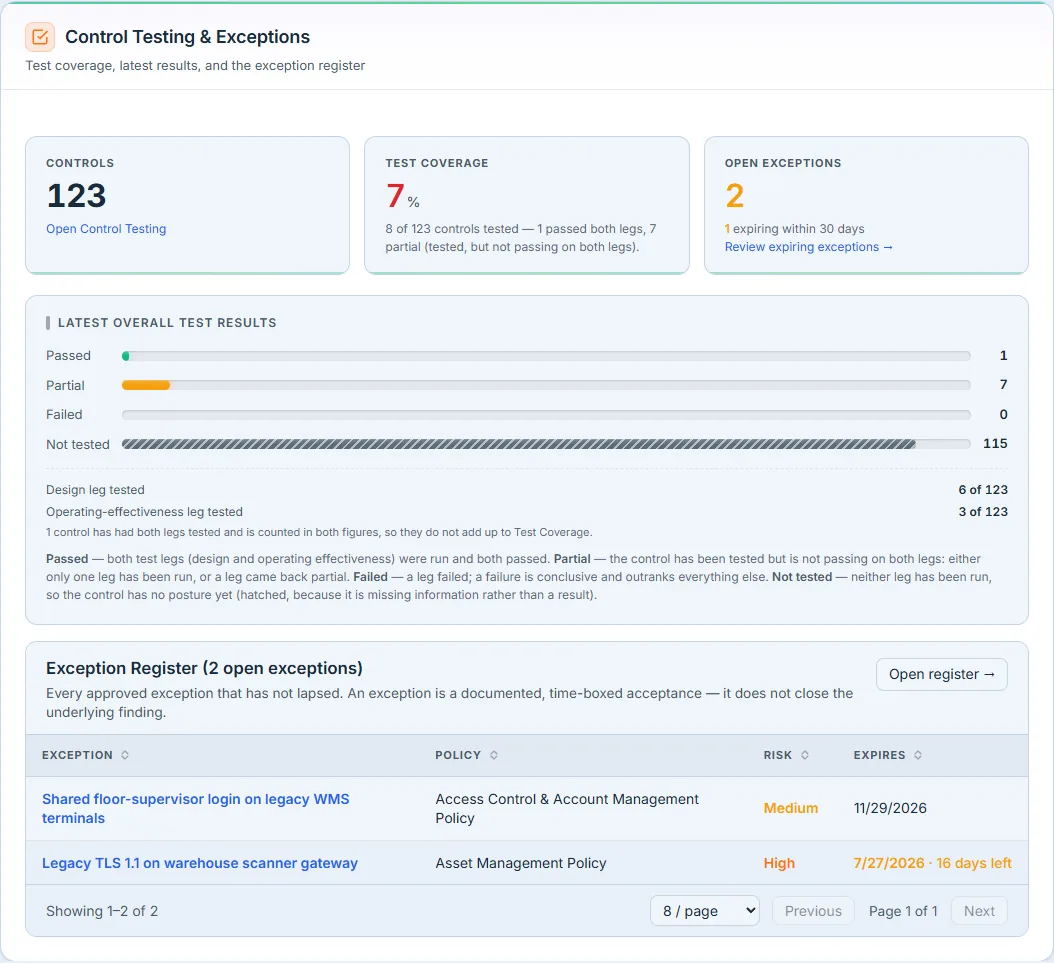
Two numbers here deliberately disagree, and the difference is the denominator. Test Coverage counts every control carrying any test result — passed, partial, or failed — over the whole register: how much of the estate has been exercised at all. The KPI strip’s Tests Passing counts only clean passes, over the tested subset alone: how much of what you exercised actually holds. In the shot above that’s 7% and 13% — 8 of 123 controls tested, and of those 8, exactly one passes both legs. A failed test raises coverage while lowering the pass rate, which is exactly right: testing something and finding it broken is progress.
The panel also refuses to let its own arithmetic mislead. The two legs are reported separately (6 design-tested, 3 effectiveness-tested) with a note that the one control tested on both legs is counted in both figures, so they don’t add up to the coverage number. And “Not tested” is drawn as a hatched bar rather than a solid one, because it is missing information, not a result.
Design tests are COSO attribute evaluations; effectiveness tests are AICPA-style sampling with deviations — both run from Control Testing. “Open Exceptions” are approved, unexpired waivers — a pending request isn’t an exception yet. Populate it: continuous compliance monitoring; a dedicated acceptances-and-exceptions guide is queued (WF-54).
Evidence Health
Freshness, expiry, and detected gaps in one section: the remediation-evidence freshness ratio, the expiry pipeline (already expired, then expiring within 30 days / 31–90 / 91–180 — the same thresholds as the Artifact Repository’s Expiring tab), and the gap-detection total broken down by severity and by type.
Three things this section does that most dashboards don’t. The freshness tile reads “None yet”, not a green 100% — there is no remediation evidence in this program, and a ratio with an empty denominator is not a passing grade. The expiry bands state that they don’t overlap and that, with the 11 already expired, they account for all 16 dated artifacts, so you can add them up and check. And the severity chart says where its severities came from: every gap here is Medium because severity is derived from each control’s risk links, and a control with no linked risk falls back to Medium — which is why the by-type panel is the one that actually tells you what to do.
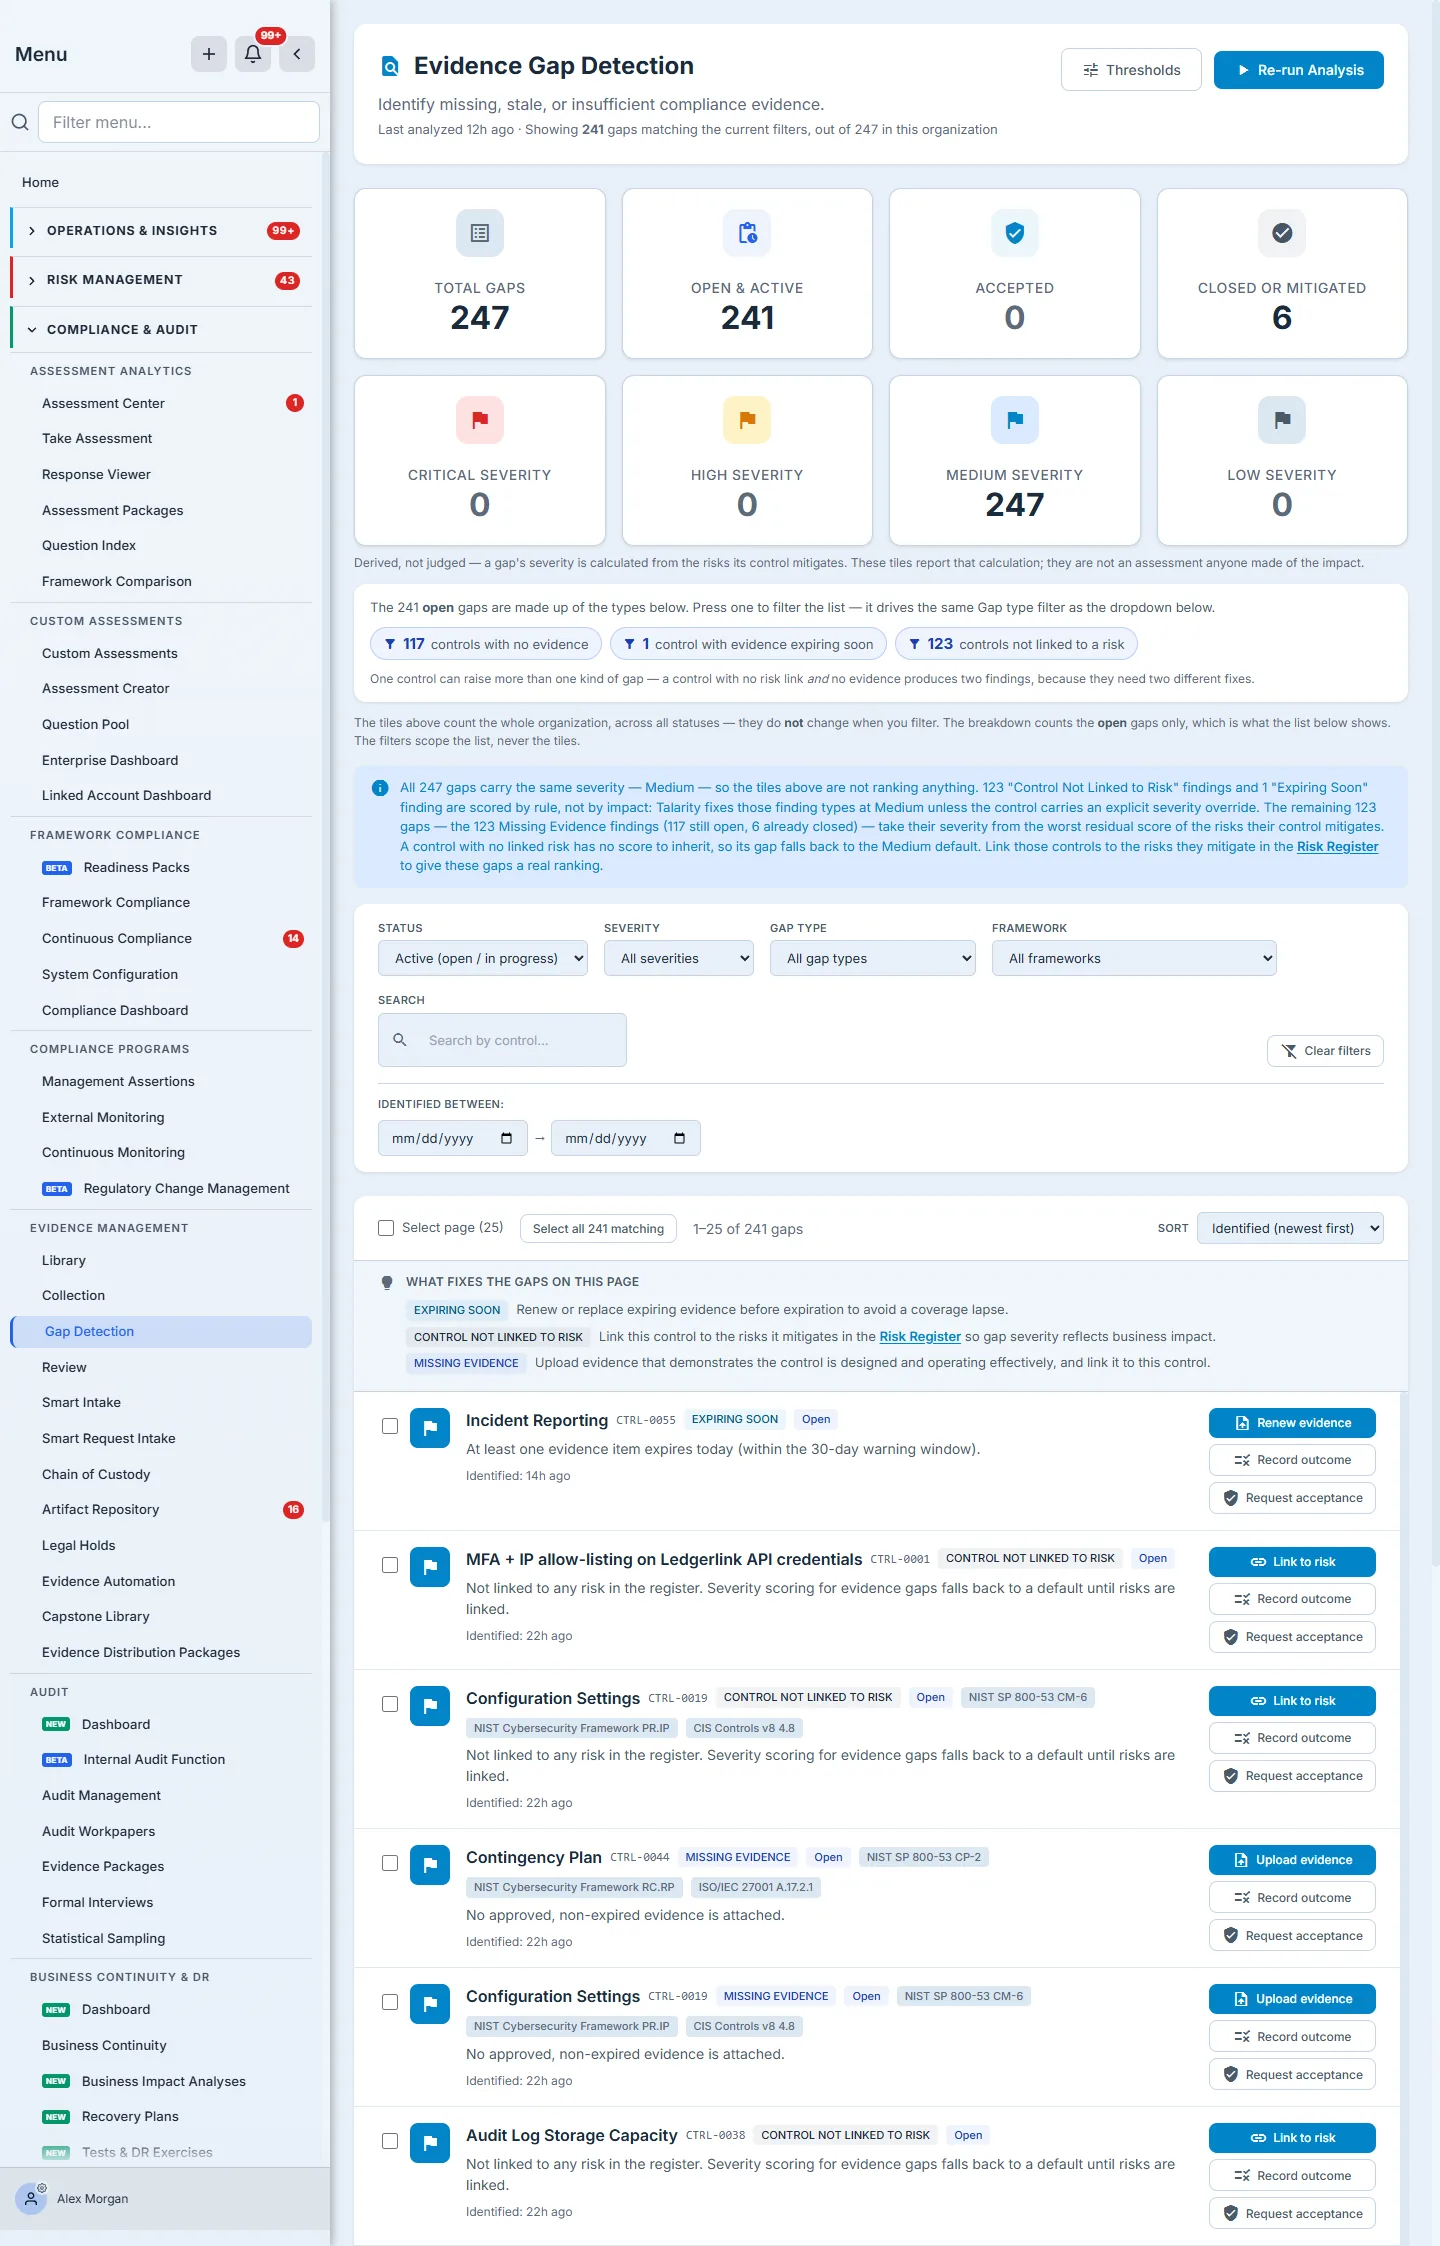
That by-type breakdown is worth reading closely, because it is three different problems wearing one number: 117 controls with no evidence attached, 123 controls not linked to any risk, and 1 control whose evidence is expiring. They need three different fixes — upload a document, link a risk, renew an artifact — which is exactly why the page refuses to roll them into a single “compliance score”.
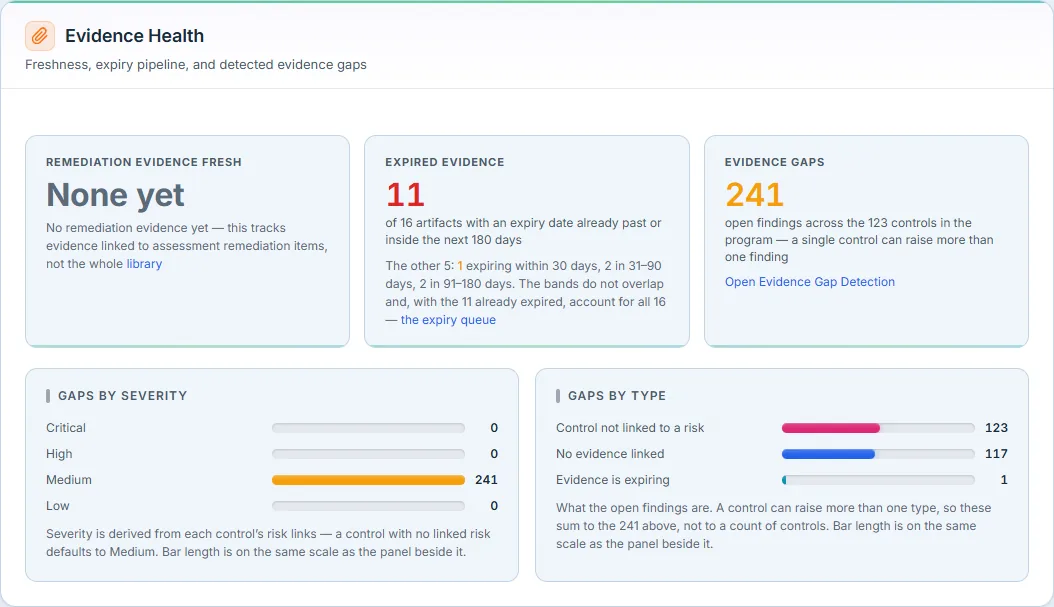
Gap detection is a server-side analysis you run from the Evidence Gaps page — it evaluates every control against the evidence library and persists findings (severity defaults apply until controls are linked to risks, and the page says so). Populate it: the artifact repository and bulk-importing artifacts; a dedicated evidence-lifecycle guide is queued (WF-55).
Needs Attention
The closing triage table. A framework lands here if it has open gaps, expired evidence, controls missing evidence, or if it is below 70% triaged or below 70% implemented — the most missing evidence first, with the problem counts tinted so the reason a row is listed carries the visual weight, and every row linking into that framework’s case file.
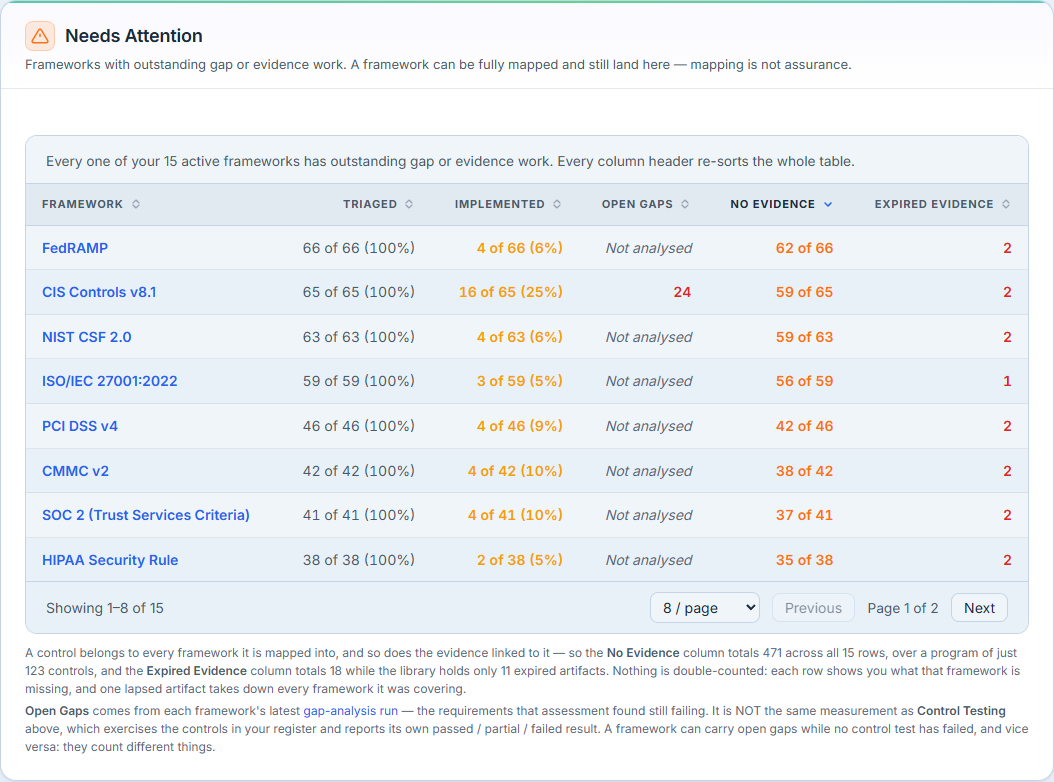
This is the page’s to-do list, and in this program all fifteen active frameworks are on it — every one fully triaged, every one short on evidence. That is the seam an auditor finds.
It is also where a dashboard usually starts lying, so read the footnote. Controls Without Evidence totals 471 across the fifteen rows, in a program holding just 123 controls; Expired Evidence totals 18 against a library with only 11 expired artifacts. Neither is double-counting. A control belongs to every framework it maps into, and so does the evidence attached to it — so one lapsed artifact takes down every framework it was covering, and each row is telling you what that framework is missing. The page prints that explanation under the table rather than leaving you to discover that the columns don’t sum.
Where the numbers come from
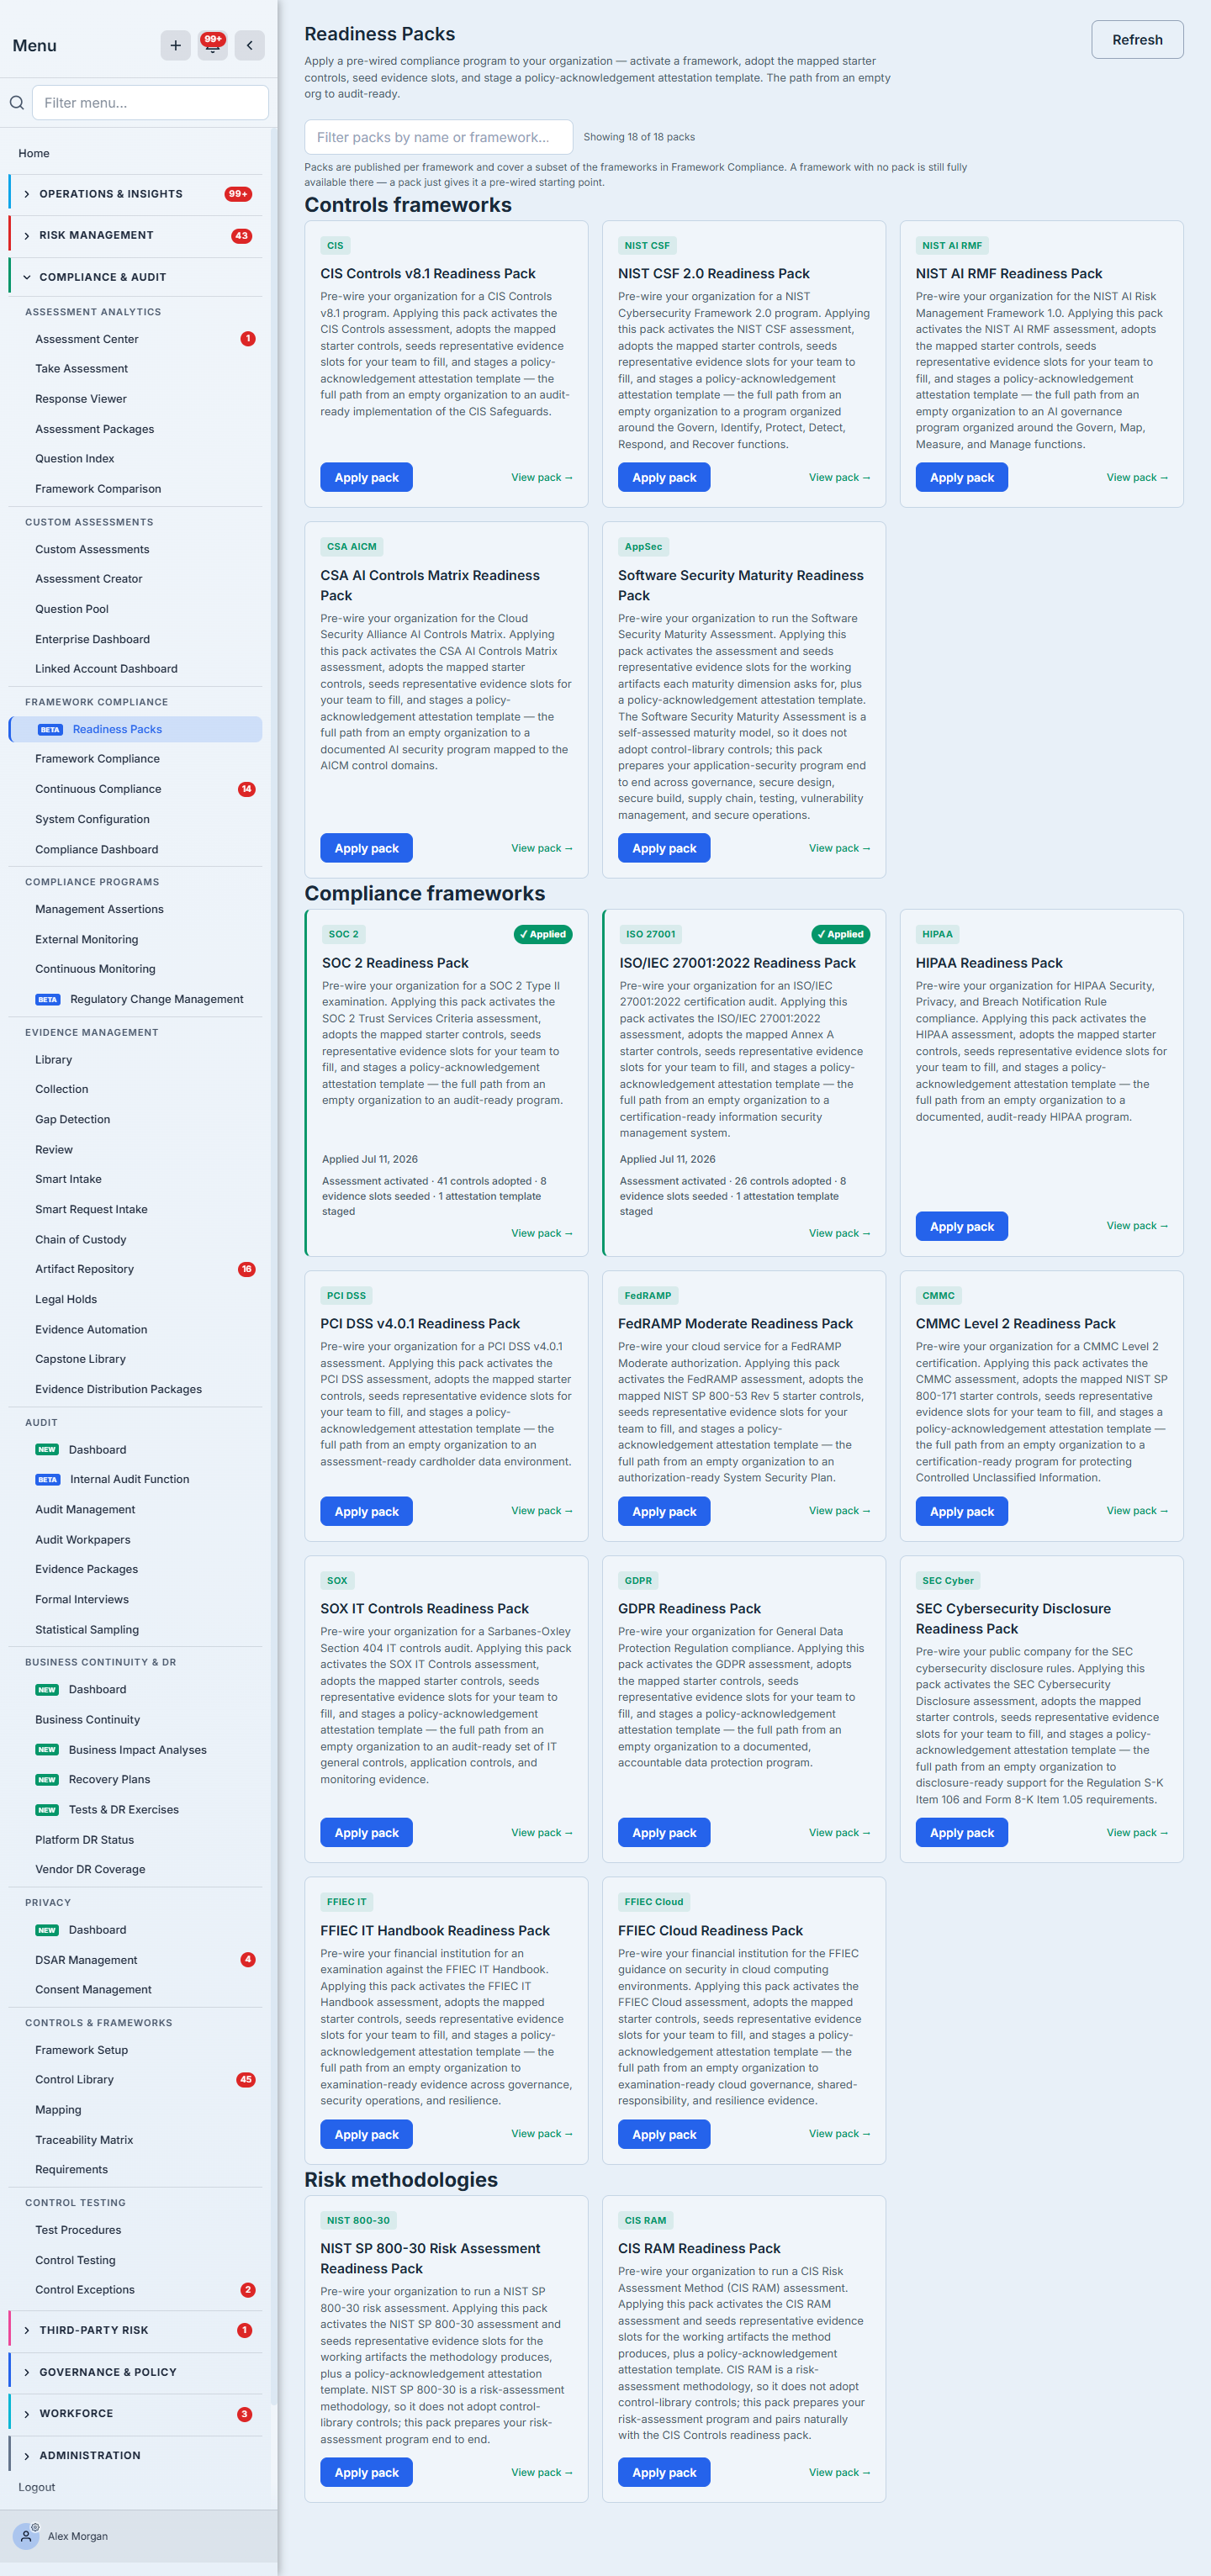
- Readiness Packs (
/app/readiness-packs) — the fastest activation: one apply wires the assessment, the mapped starter controls, evidence slots, and an attestation template. Applied packs stay openable and record when they were applied.
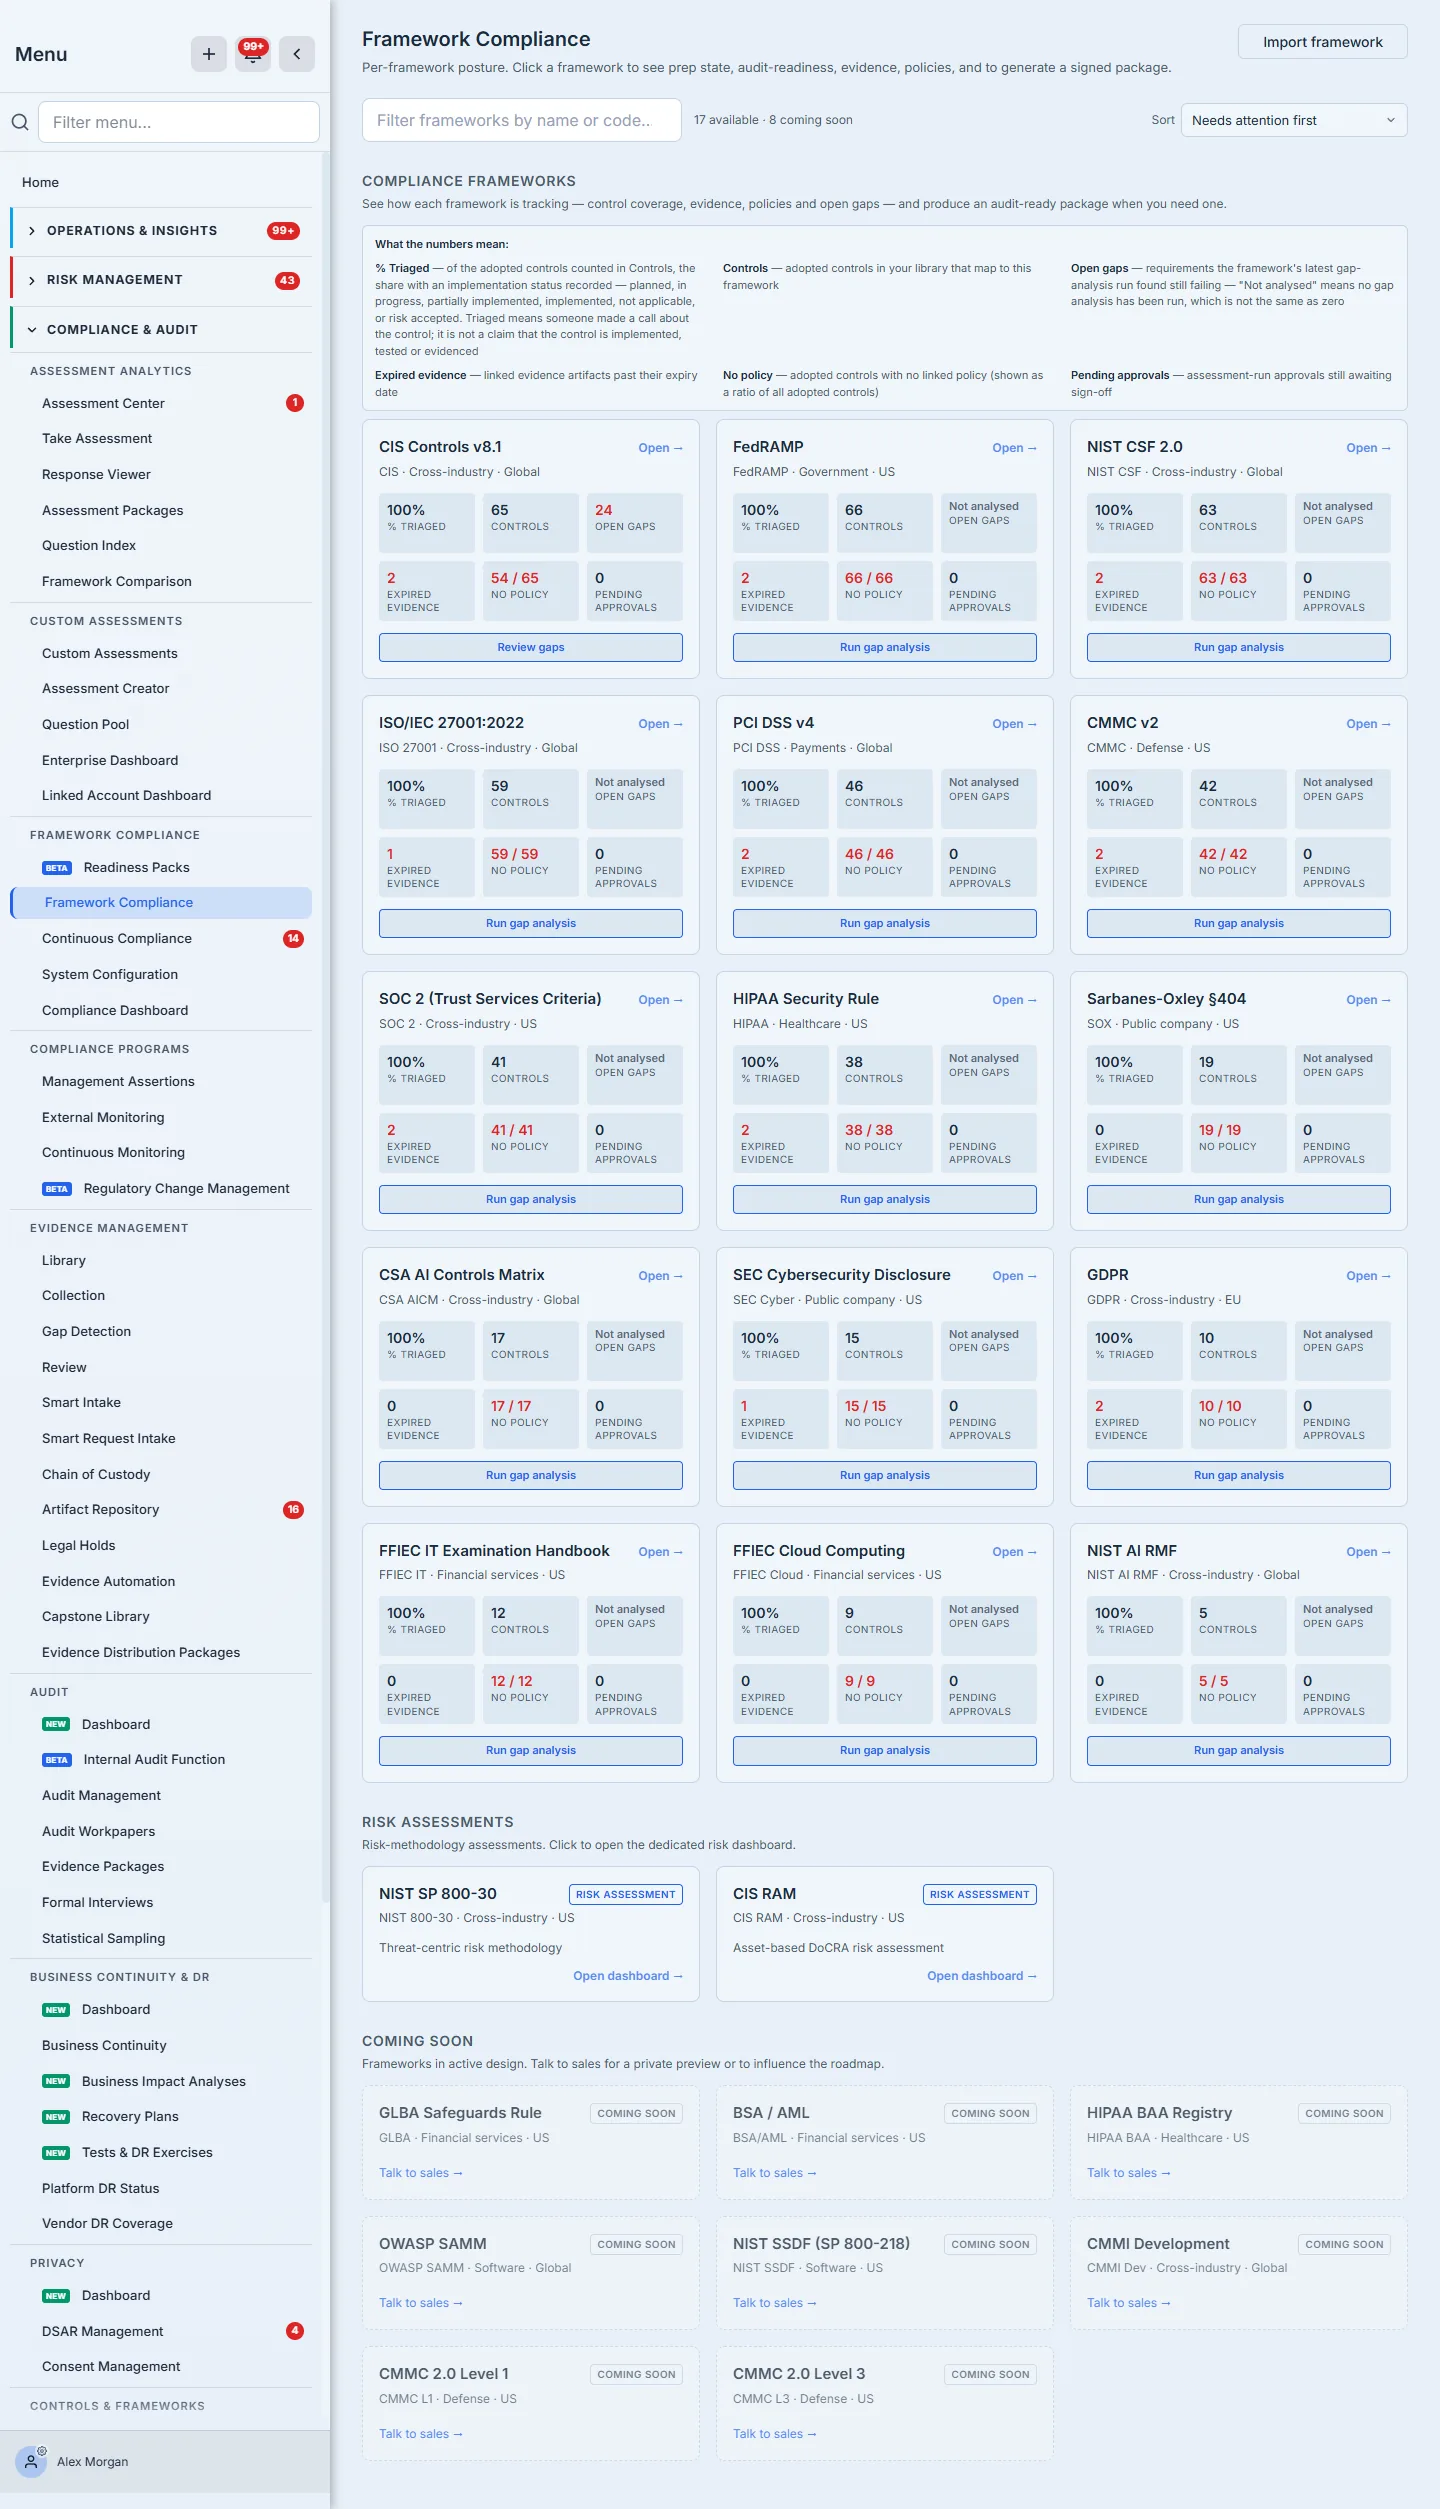
- Framework Compliance list (
/app/compliance/frameworks) — the same posture data as the cards, as a filterable register: % triaged, controls, open gaps, expired evidence, controls with no policy, and pending approvals side by side. A framework that has never been gap-analysed says “Not analysed” here rather than showing a reassuring zero.
- Control Testing (
/app/control-testing) — where design and effectiveness tests are started, worked, and completed. The register carries each control’s design, effectiveness, and overall outcome, searchable and filterable down to “show me only what failed”.
- Evidence Gap Detection (
/app/grc/evidence-gaps) — the analysis behind the gaps total, and the page that turns it into a work queue. The composition strip breaks the number into its causes — 117 controls with no evidence, 123 not linked to a risk, 1 with evidence expiring — and each chip filters the list to that type. Two disclosures are worth stealing for your own dashboards. The first explains why every gap wears the same severity, and it is careful where it would be easy to be glib: some finding types are fixed at Medium by rule, while the rest inherit the worst residual score of the risks their control mitigates — and a control with no linked risk has no score to inherit, so it falls back to Medium. The wall of amber is an artefact of missing risk links, not a judgement anyone made. The second is a caption stating that the tiles count the whole organisation across every status and do not move when you filter, while the breakdown counts only the open gaps — which is what the list below actually shows.
- Take Assessment (
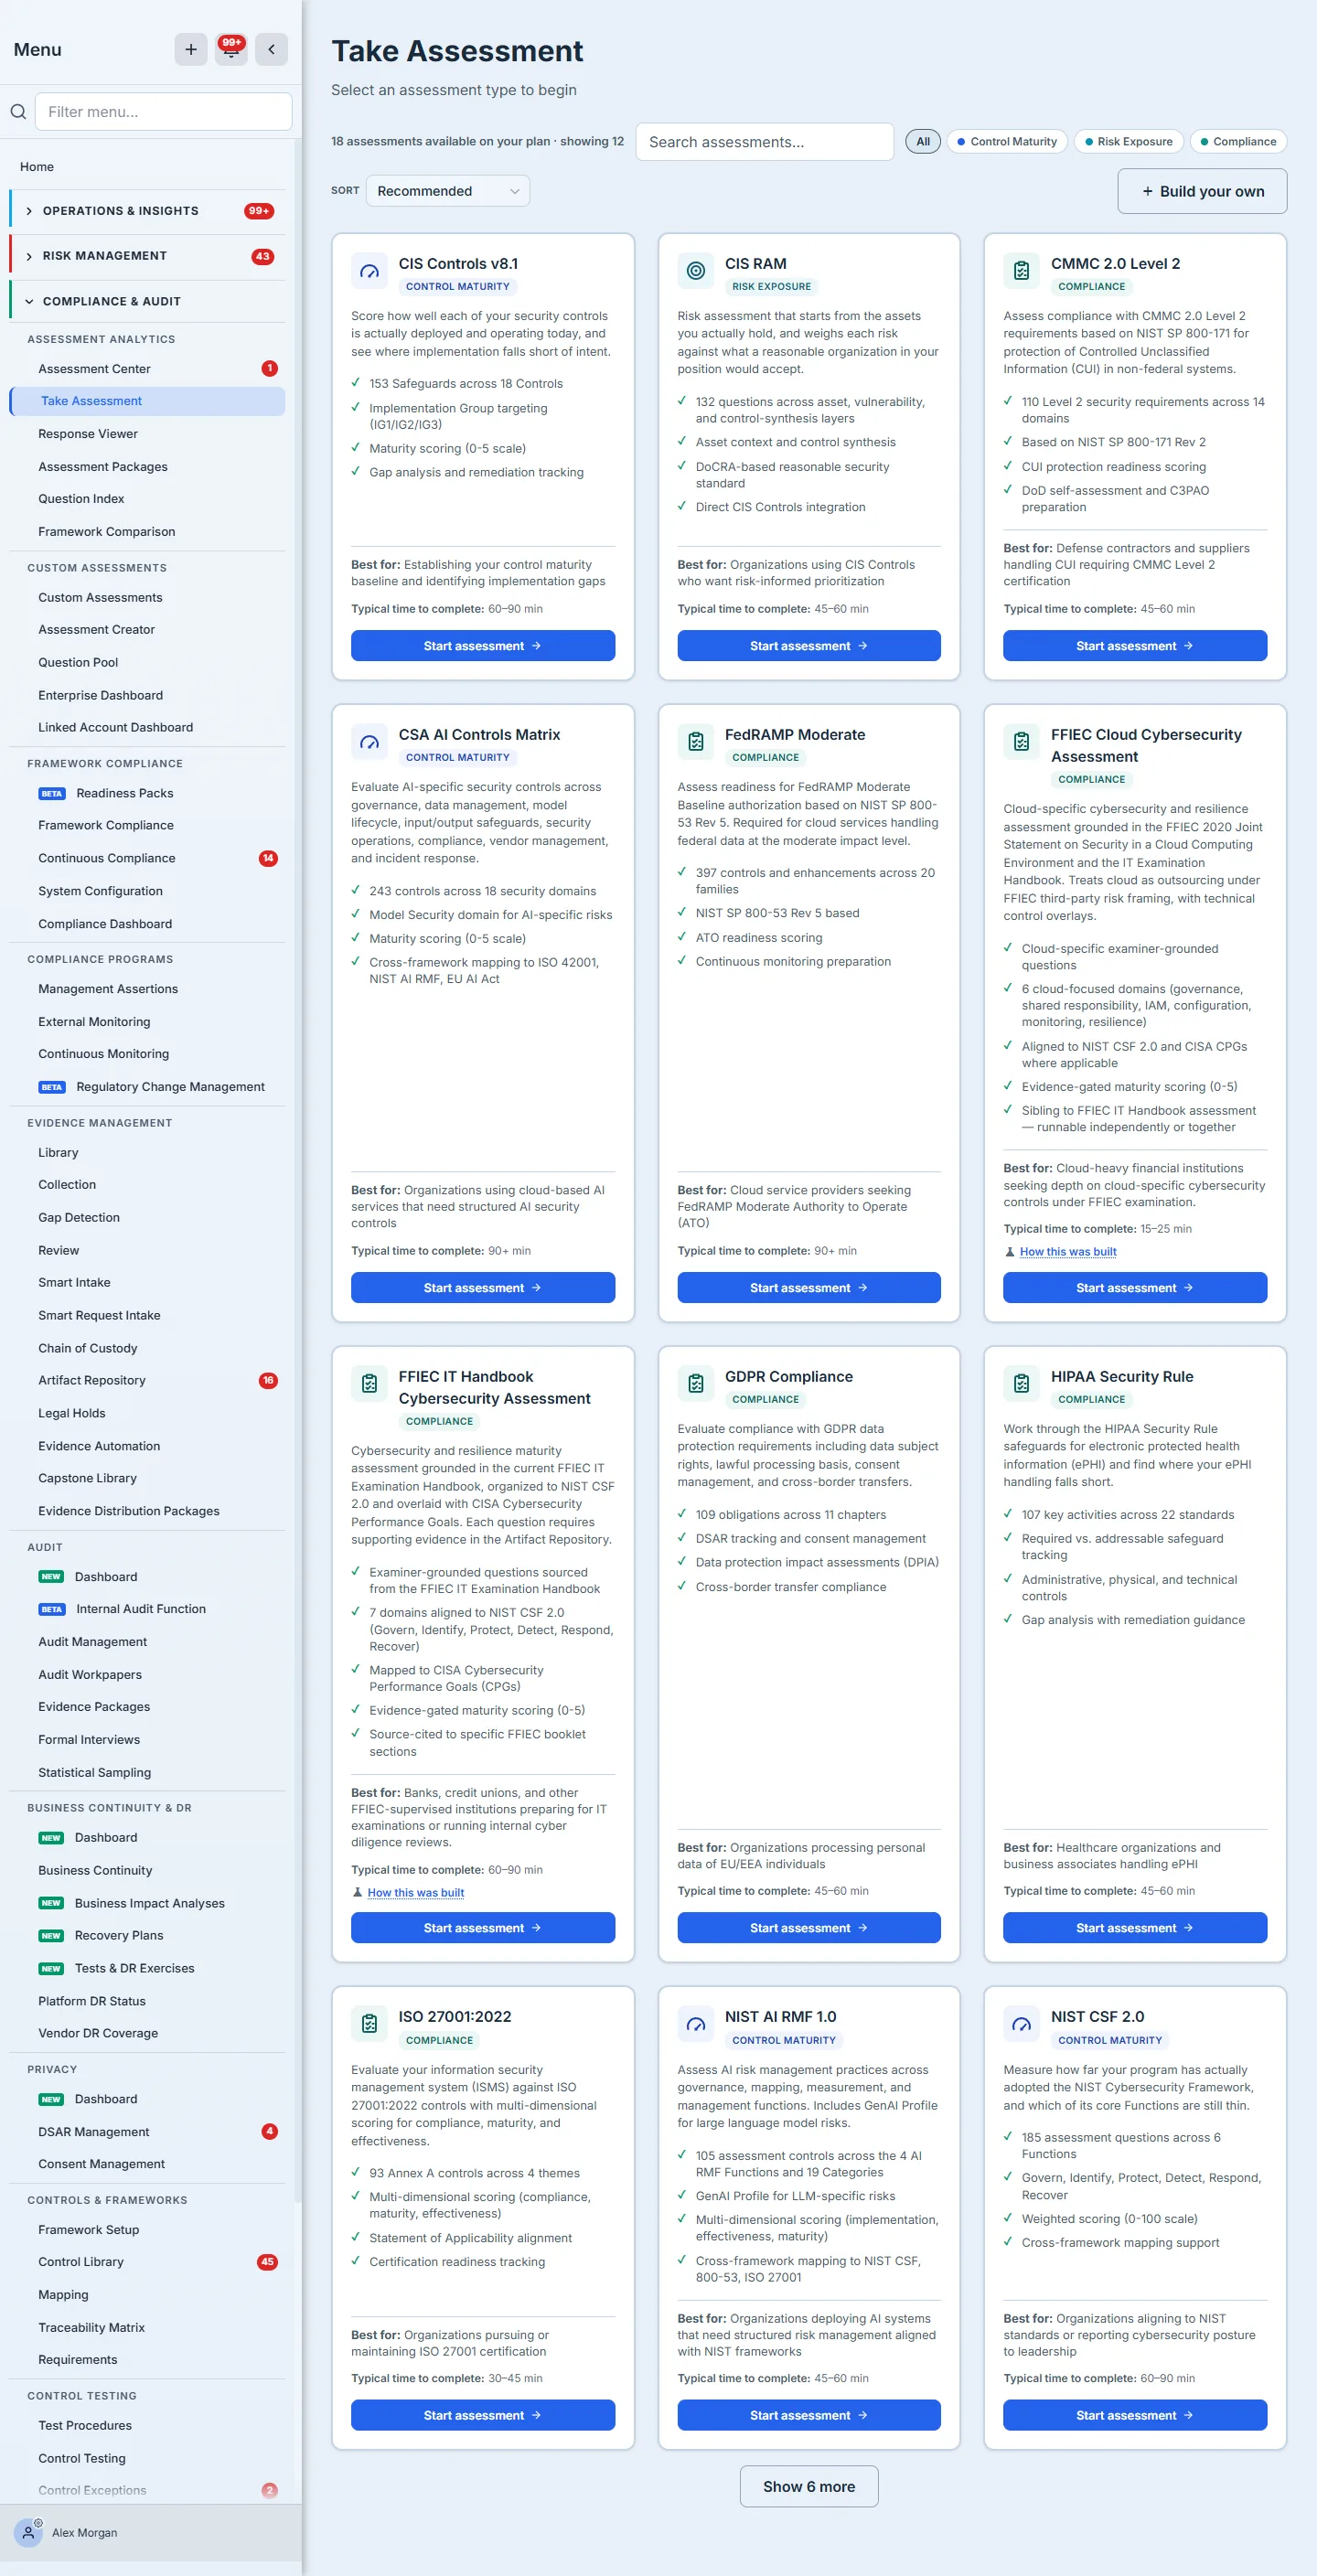
/app/assessment) — where runs start. The gallery is licence-aware and says so in the product’s own words: 18 assessments available on your plan · showing 12, with the rest a click away, each card carrying its scope, its scoring model, and a typical time to complete, so choosing one isn’t a guess.
- The Artifact Repository’s Expiring tab (
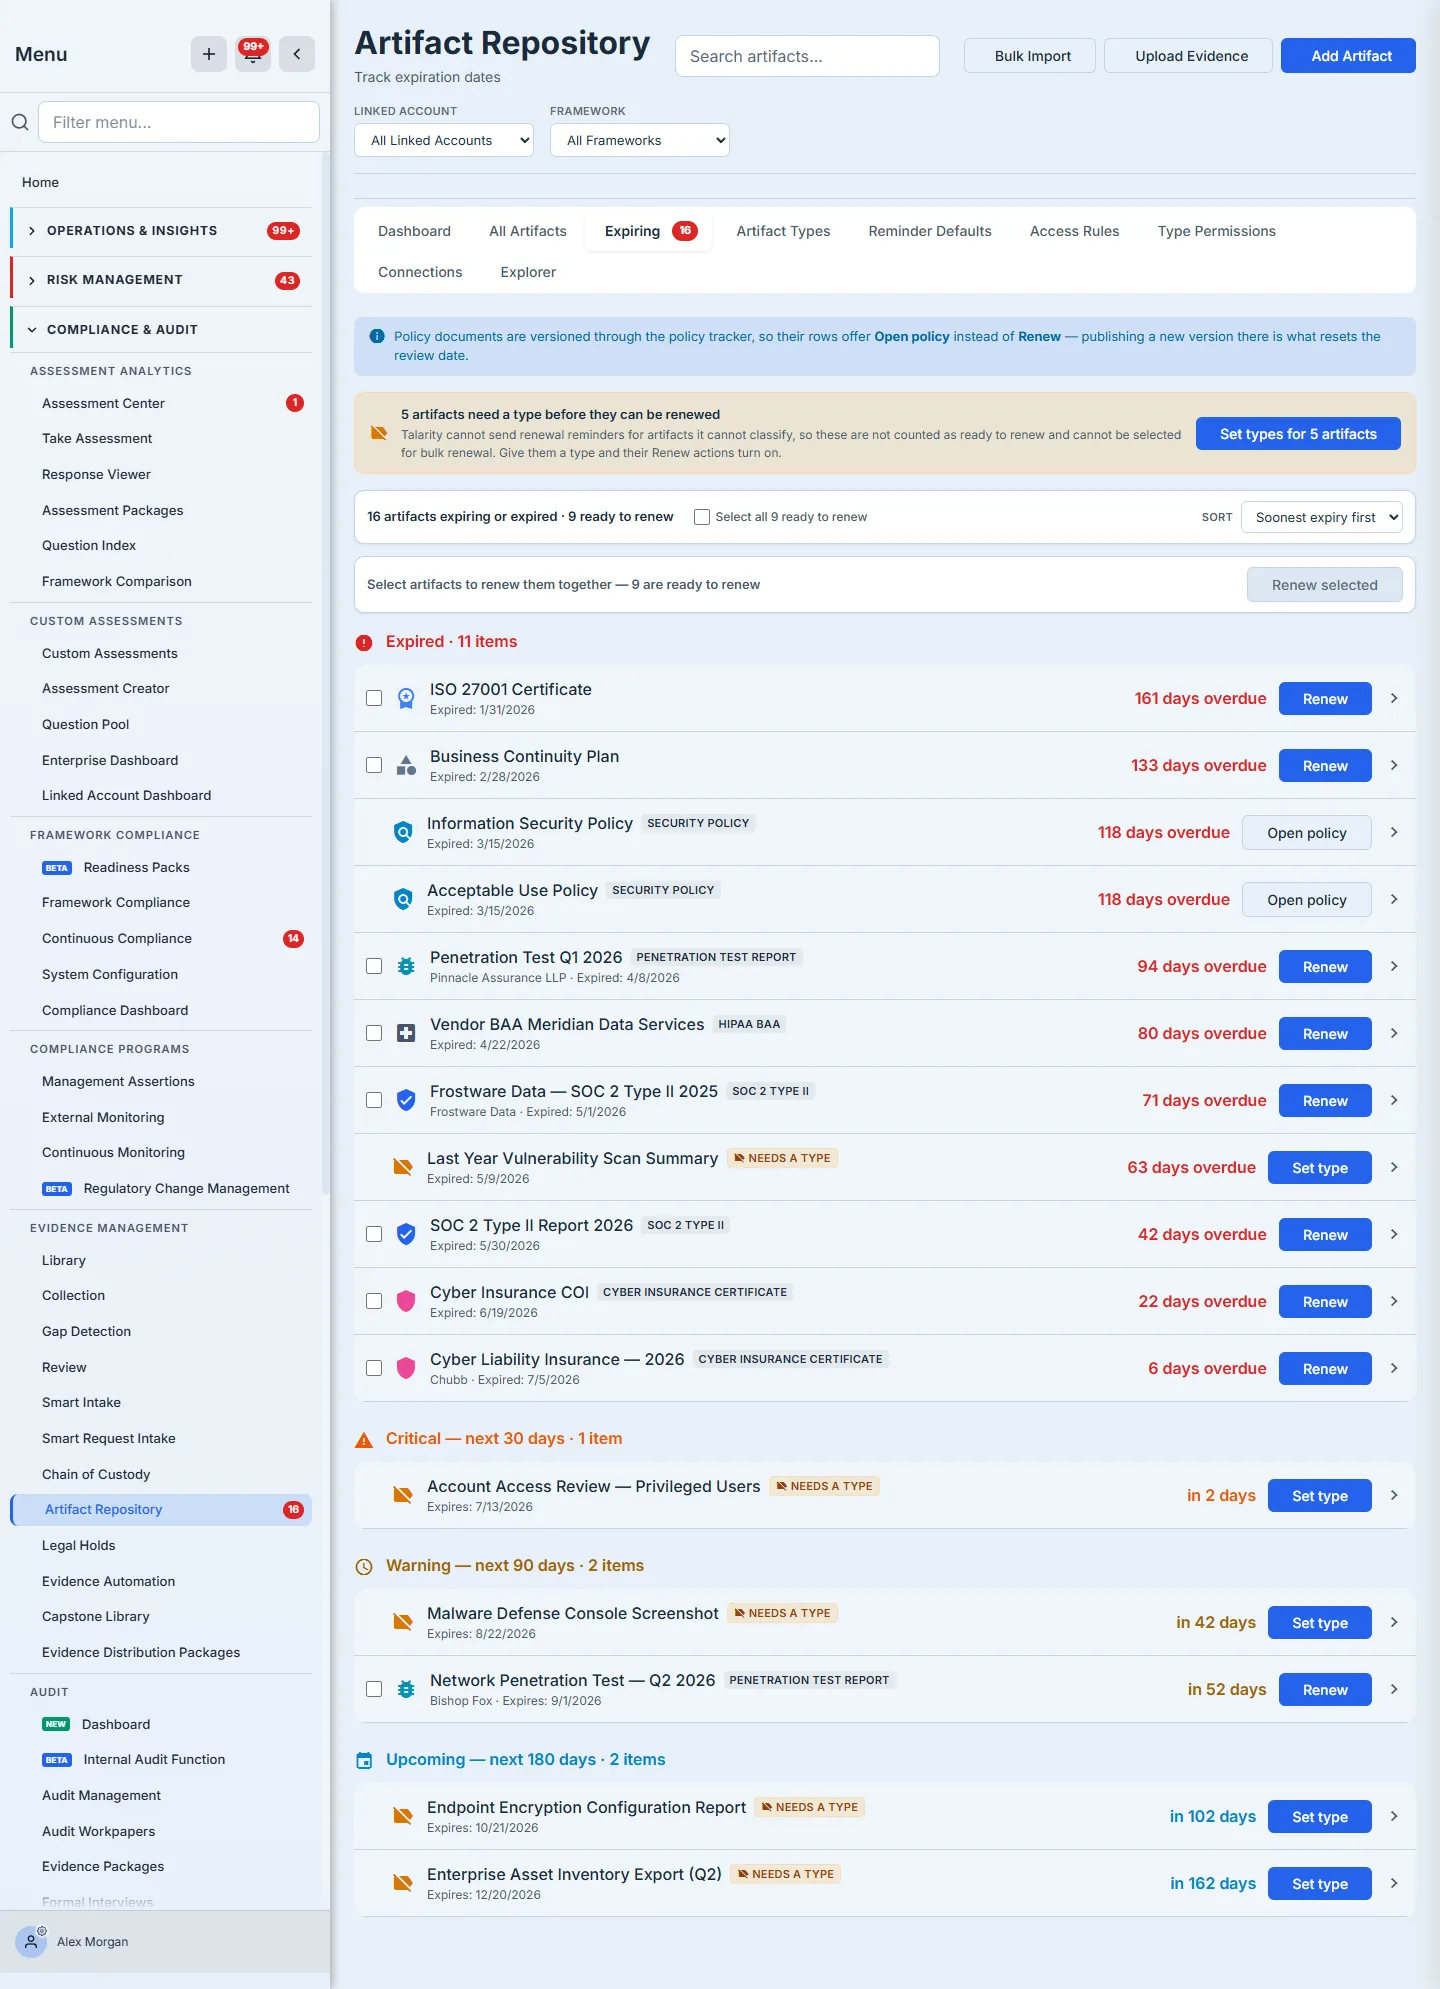
/app/artifact-repository) — the item-level view behind the expiry buckets, grouped expired → critical → warning → upcoming, each row carrying its days overdue and the action that renews it. Policy documents offer Open policy rather than Renew, because publishing a new version through the policy tracker is what resets their review date; everything else replaces the file in place.
Note the arithmetic in the header: 16 artifacts expiring or expired · 9 ready to renew. The other seven are disclosed, not hidden — five have no artifact type (Talarity can’t send a renewal reminder for a document it can’t classify, so they’re excluded from the count, excluded from bulk selection, and given a Set type button that turns Renew on), and two are policies that version instead of renewing. A “16 ready to renew” that fell over on seven of them would have been the easier number to print.
What you walk away with
Read weekly, the Compliance Dashboard answers the questions a compliance program is accountable for:
- What are we claiming? (Active frameworks and their coverage.)
- Are we measuring the claim? (The run pipeline, scores, and due dates.)
- Do the controls actually work? (Test coverage and the passing rate — kept honestly separate.)
- Can we prove it stayed true? (Evidence freshness, the expiry pipeline, and detected gaps.)
- What do we fix next? (Needs Attention, worst first.)
For the per-framework deep dive — control rows, prep and audit modes, package generation — click any posture card through to its capstone, and see framework readiness to audit package for the full journey.