Business continuity is the discipline auditors trust least on paper and test hardest in practice. ISO 22301 wants a documented BIA-to-plan-to-test loop, SOC 2 A1.2 wants recovery tested — not just written — and DORA and NIST SP 800-34 both assume you can show when you last proved a recovery objective. What all of them are really asking is one question: if this process went down right now, would the plan you wrote actually bring it back inside the target you promised?
The Resilience Dashboard (/app/resilience/dashboard) answers that continuously: an executive rollup computed live from your Business Impact Analyses, recovery plans, continuity tests, DR exercises, asset and vendor DR posture — plus Talarity’s own published DR status, because shared responsibility cuts both ways. This article walks the page section by section — what each number measures, where the data lives, and which workflow moves it.
Who’s involved
- BC/DR lead — owns the loop; works the review queue, the uncovered-process banner, and the objective-gap table.
- Process/plan owner — keeps a BIA’s targets current and a plan’s commitments honest.
- Infrastructure & vendor owners — show up in the asset and vendor DR coverage sections.
- Auditor — follows drill-downs to the BIAs, plans, test outcomes, and the platform DR page that back each number.
How this page thinks
- Coverage over counts. Almost every number is a ratio with an honest denominator: active BIAs with an active plan, active plans that are test-fresh, in-scope assets and vendors with a fresh DR test. A denominator of zero renders ”—”, never a fake 100%.
- Freshness. Every read is served through short-lived caching; the freshness bar shows when the data was computed and Refresh re-runs everything.
- Sections degrade independently. The Asset DR and Vendor DR sections (and their KPI cards) disappear cleanly for orgs or users without those features; everything else needs only the BC/DR module.
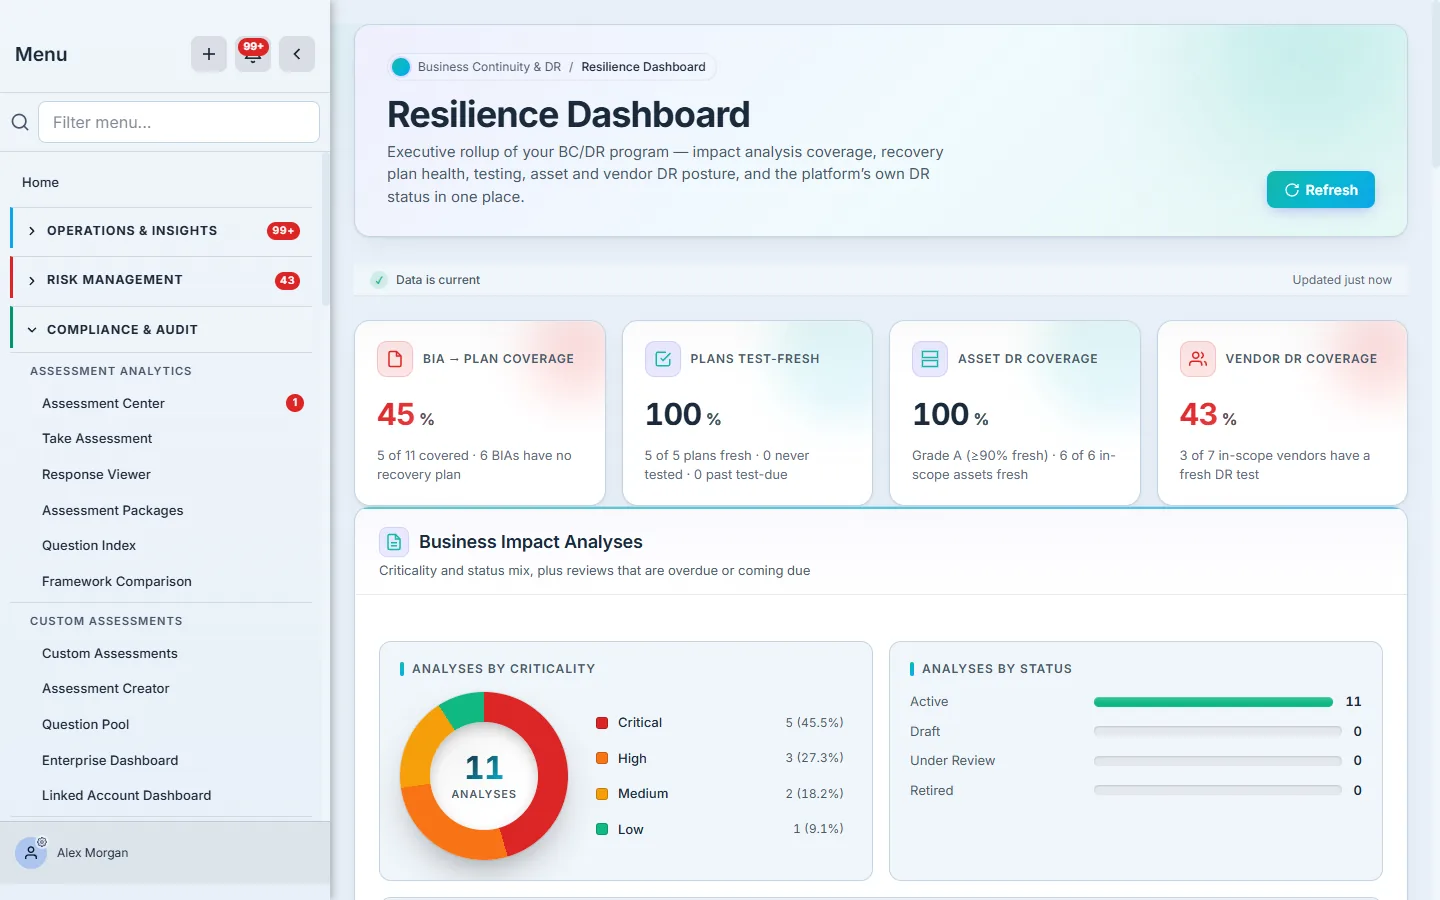
The KPI strip
Four ratios, four sources:
- BIA → Plan Coverage — the percentage of active BIAs that have an active recovery plan, with the uncovered count called out (“6 active BIAs have no recovery plan”). This is the program’s core promise: every analyzed process gets a playbook. Populate it: Run your first BIA, Write a recovery plan.
- Plans Test-Fresh — active plans that have been tested and aren’t past their own test-due date. A tested plan with no due date scheduled counts as fresh — freshness here means “not overdue against its own schedule,” not a fixed cadence. Populate it: Test your recovery plan.
- Asset DR Coverage — in-scope assets (per your scope policy’s criticality tiers) with a DR test inside their cadence, graded A–F with the count beside it (“6 of 6 in-scope assets fresh”). The letter grade is a reading convention on the percentage — ≥90 is an A. Populate it: Run a DR program.
- Vendor DR Coverage — the same discipline pointed at third parties: in-scope vendors with a fresh DR test. Populate it: Vendor DR coverage.
Business Impact Analyses
The foundation layer: a criticality donut and status mix over every BIA, plus a review queue — BIAs whose next review is overdue (in red, “N days overdue”) or due within 30 days.
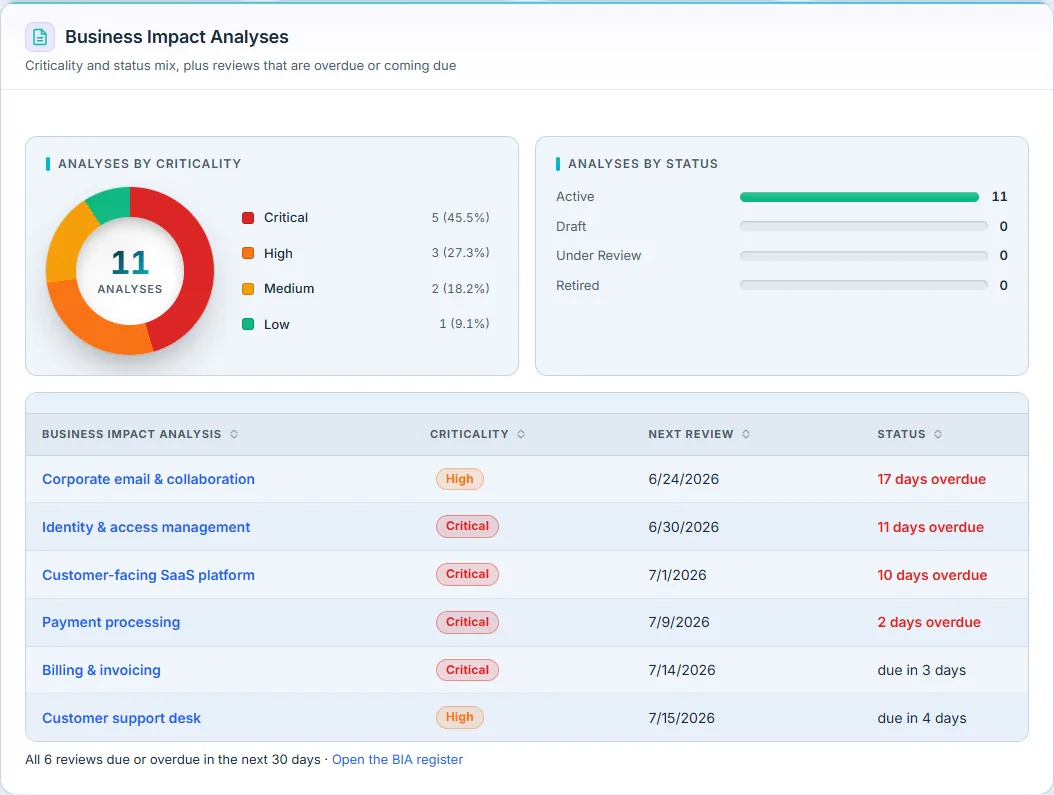
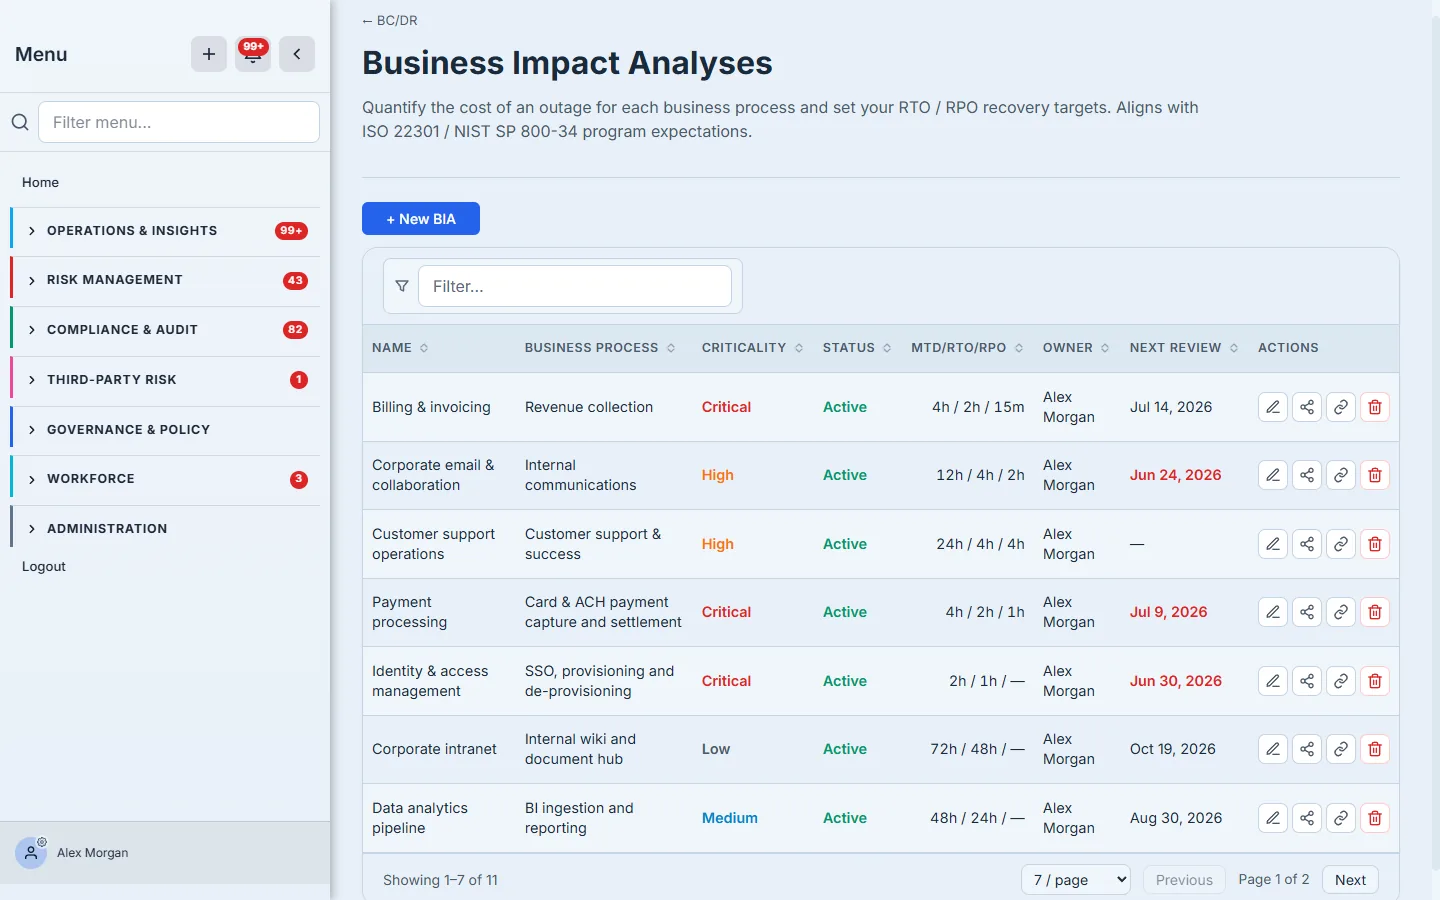
BIAs are created on the BIAs page with a criticality, RTO/RPO targets, and a review cadence — those targets become the yardstick every plan below is measured against. An aging review queue is an early warning that targets no longer reflect the business. Populate it: Run your first BIA, BIA at scale.
Recovery Plan Health & Objectives
The accountability layer. Attention banners lead: analyzed processes with no recovery plan (danger) and active plans never tested (warning). Below them, plans by status and by scenario — then the section’s sharpest tool: the RTO/RPO Objective Gaps table, listing plans whose committed recovery times are slower than their BIA’s target (“8h vs 4h” in red). A footnote totals RTO gaps, RPO gaps, plans with no linked BIA, and plans past their test-due date — exact counts over the whole plan set, immune to the table’s top-10 cut.
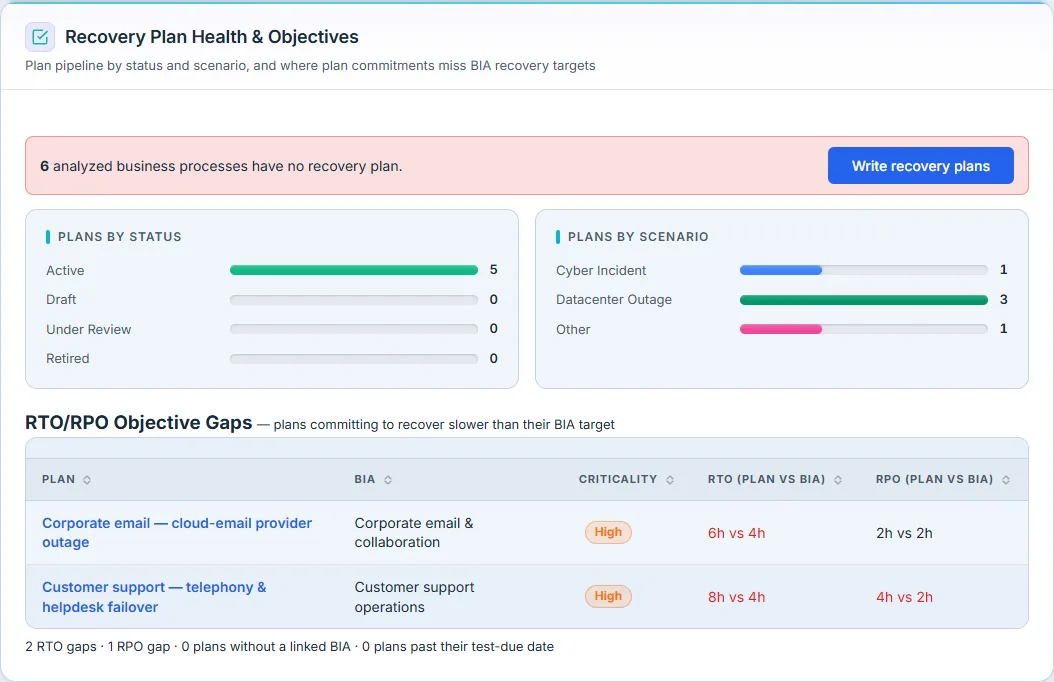
A gap row is not a formatting problem — it’s a commitment mismatch: the business said “4 hours” in the BIA and the plan promises 8. Close it by re-engineering the plan or formally re-negotiating the target. The check only works when plans are linked to their BIA, which is why the footnote counts unlinked plans. Populate it: Write a recovery plan.
Testing & Exercises
Proof over intent: a tests-by-outcome donut (computed over the most recent tests), an Actual RTO vs Target chart — one bar per recent test with a recorded actual recovery time, red when the actual overshot the plan’s target — and the last DR exercises with their per-asset pass/partial/fail rollups.
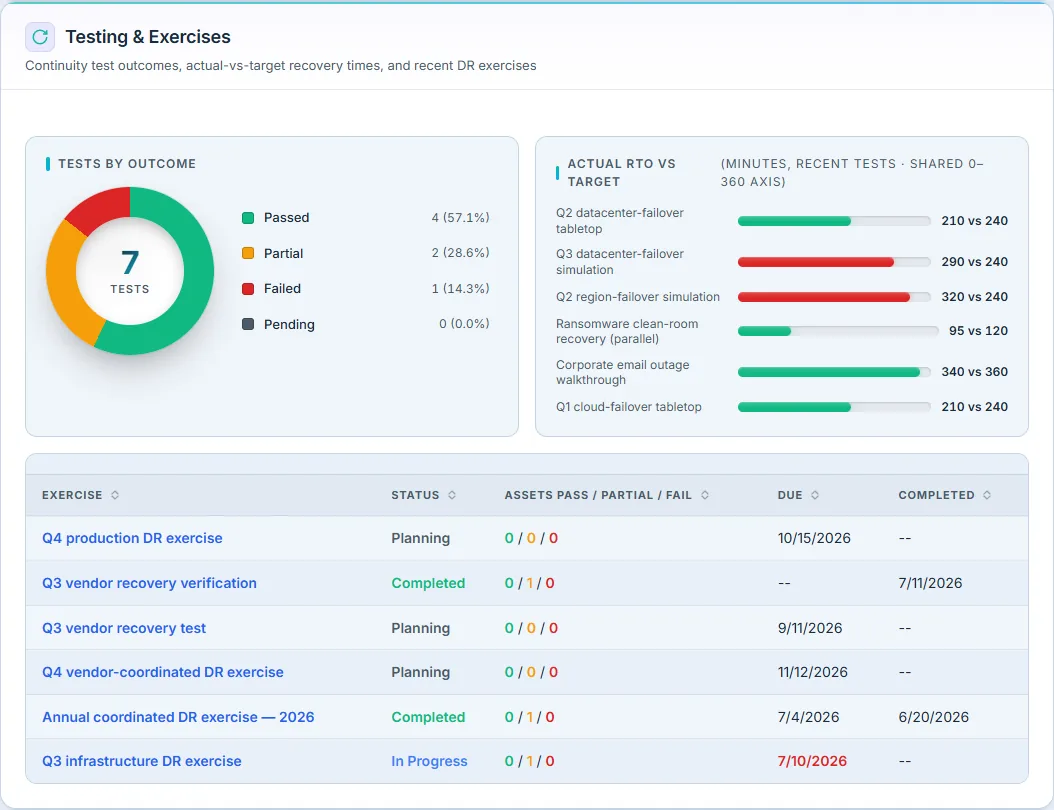
The actual-vs-target chart only exists if testers record actual RTO/RPO when logging outcomes — the empty state says exactly that. Recording a test also stamps the plan’s freshness, which is what moves the Plans Test-Fresh KPI above. Populate it: Test your recovery plan, Run a DR exercise.
Asset DR Program
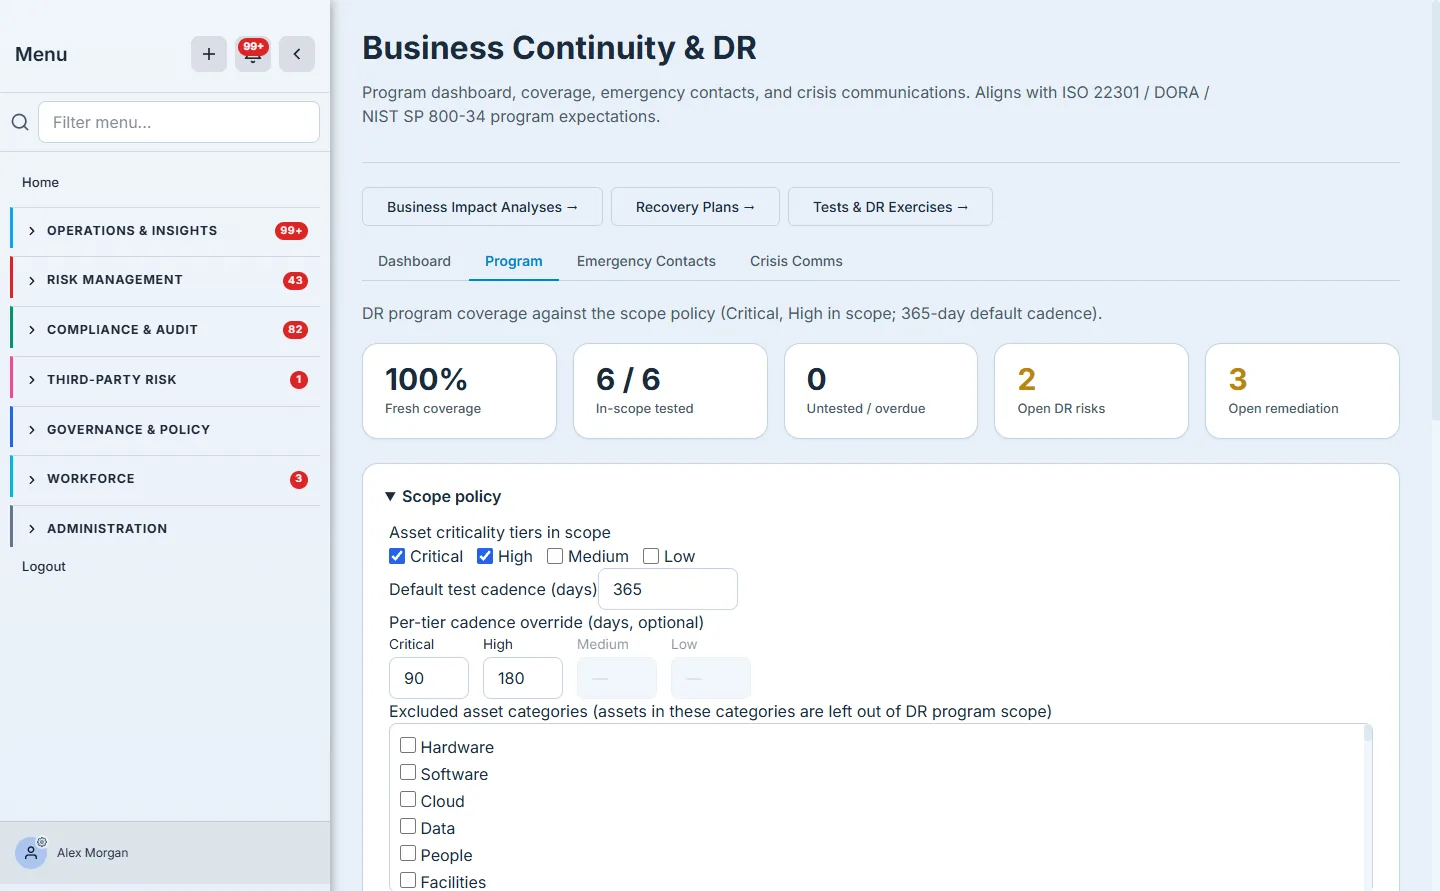
Coverage against your scope policy: fresh-coverage percentage with its grade and the in-scope universe (“6 of 6 in-scope assets”), never-tested and stale counts, open DR risks and remediation items spawned by test failures, per-tier freshness bars, and the overdue/untested queue.
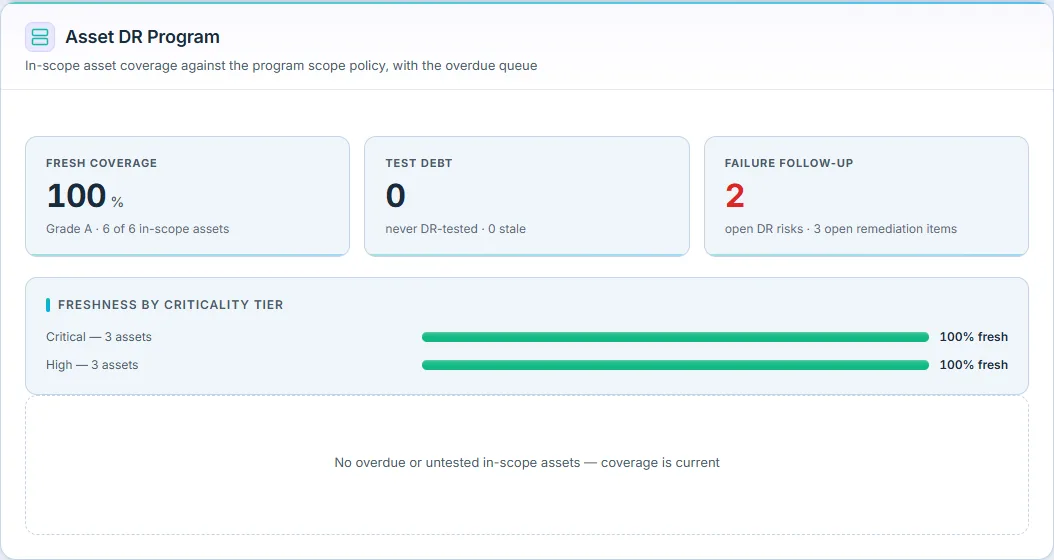
The denominators come from the scope policy you set on the BC/DR Program tab — which criticality tiers are in scope, the test cadence per tier, and exclusions. A failed exercise doesn’t just color a chart: it opens DR risks and remediation work items, and this section counts the ones still open. Populate it: Run a DR program.
Vendor DR Coverage
The third-party half of the same discipline: coverage percentage over in-scope vendors (by risk tier, per the scope policy), how many have ever been DR-tested, and the least-covered in-scope vendors — tier, last DR test, outcome, and open DR risks per vendor — with a link to the full coverage view.
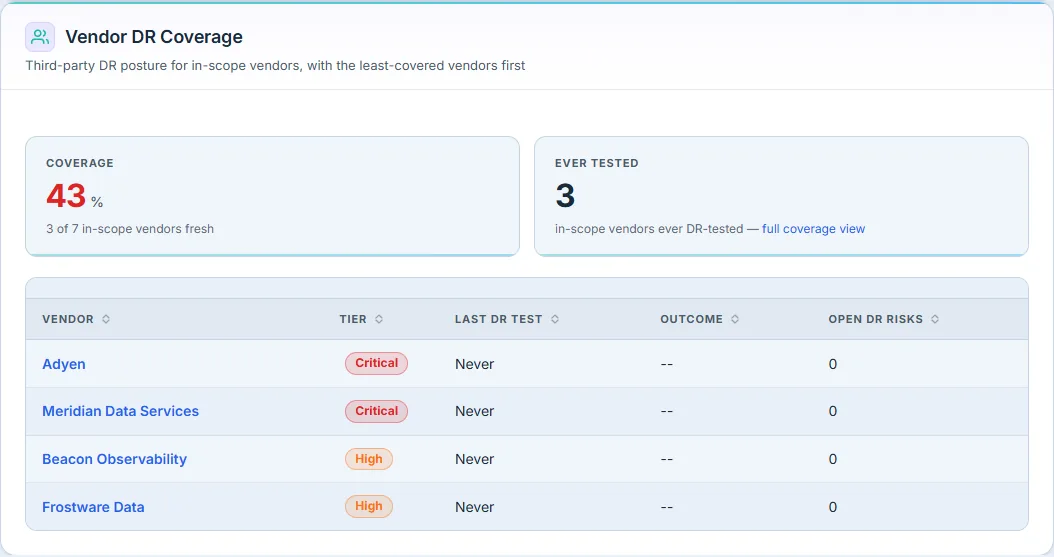
If vendors aren’t in DR scope at all, the section says so and points at the scope policy rather than rendering an empty chart. Populate it: Vendor DR coverage, Vendor risk tiering.
Continuity Readiness
Two depth signals that separate a paper program from a real one: BIA Dependencies by Type (System / Vendor / People / Data / Facility edges mapped on your BIAs — the input every blast-radius question depends on) and Plan Attestations over the last 90 days — signatures collected from plan stakeholders, with a zero shown honestly when no campaign has run.
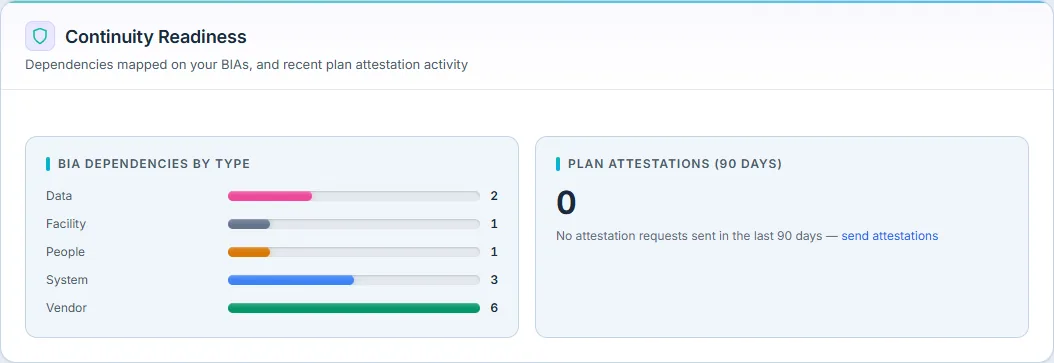
Populate it: dependencies are mapped on each BIA; attestation campaigns are sent from a plan’s DR Test Attestation panel (Write a recovery plan).
Platform DR & Testing Trend
Two panels close the page. Platform DR (Talarity) is the vendor side of shared responsibility: Talarity publishes its own DR drill results — status, actual vs target RTO/RPO, next scheduled drill — into a customer-visible tile, with the full history at /app/dr-status. Until a drill is published the tile says exactly that, rather than showing a stale or invented status. Beside it, the Testing Trend plots your continuity tests per quarter over a fixed eight-quarter axis — quarters with no tests render as honest zeros — with the most recent tested quarter’s pass rate named in the footnote.
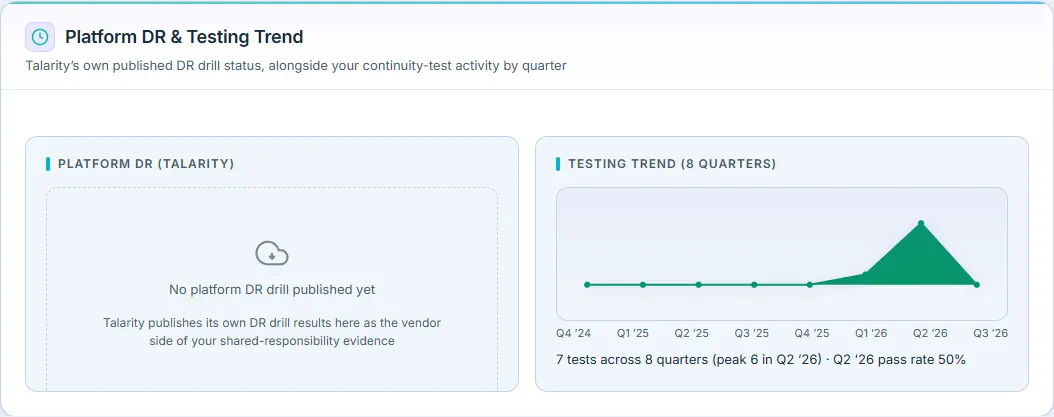
The trend is the cadence check every framework wants: not “did you ever test” but “do you keep testing.” Populate the trend by testing (Test your recovery plan); the platform tile populates itself when Talarity publishes.
Where the numbers come from
- The BC/DR hub (
/app/grc/bcdr) — the Program tab holds the scope policy that sets every coverage denominator in the Asset and Vendor DR sections.
- BIAs (
/app/grc/bcdr/bias) — criticality, RTO/RPO targets, review cadence.
- Recovery Plans (
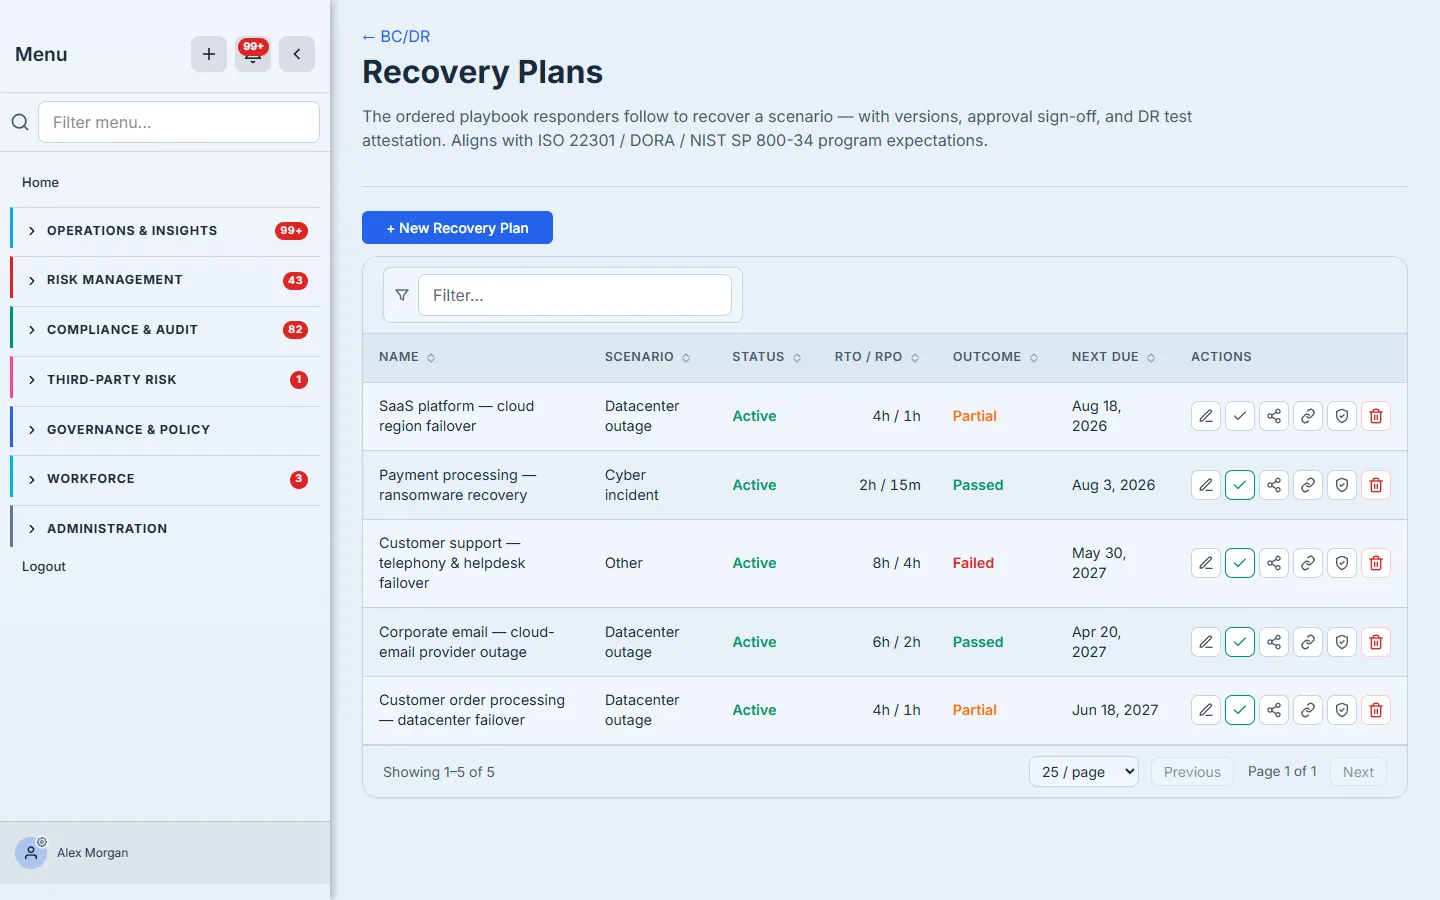
/app/grc/bcdr/plans) — scenario, committed RTO/RPO, the BIA link that unlocks gap checking, versions and attestation.
- Tests & Exercises (
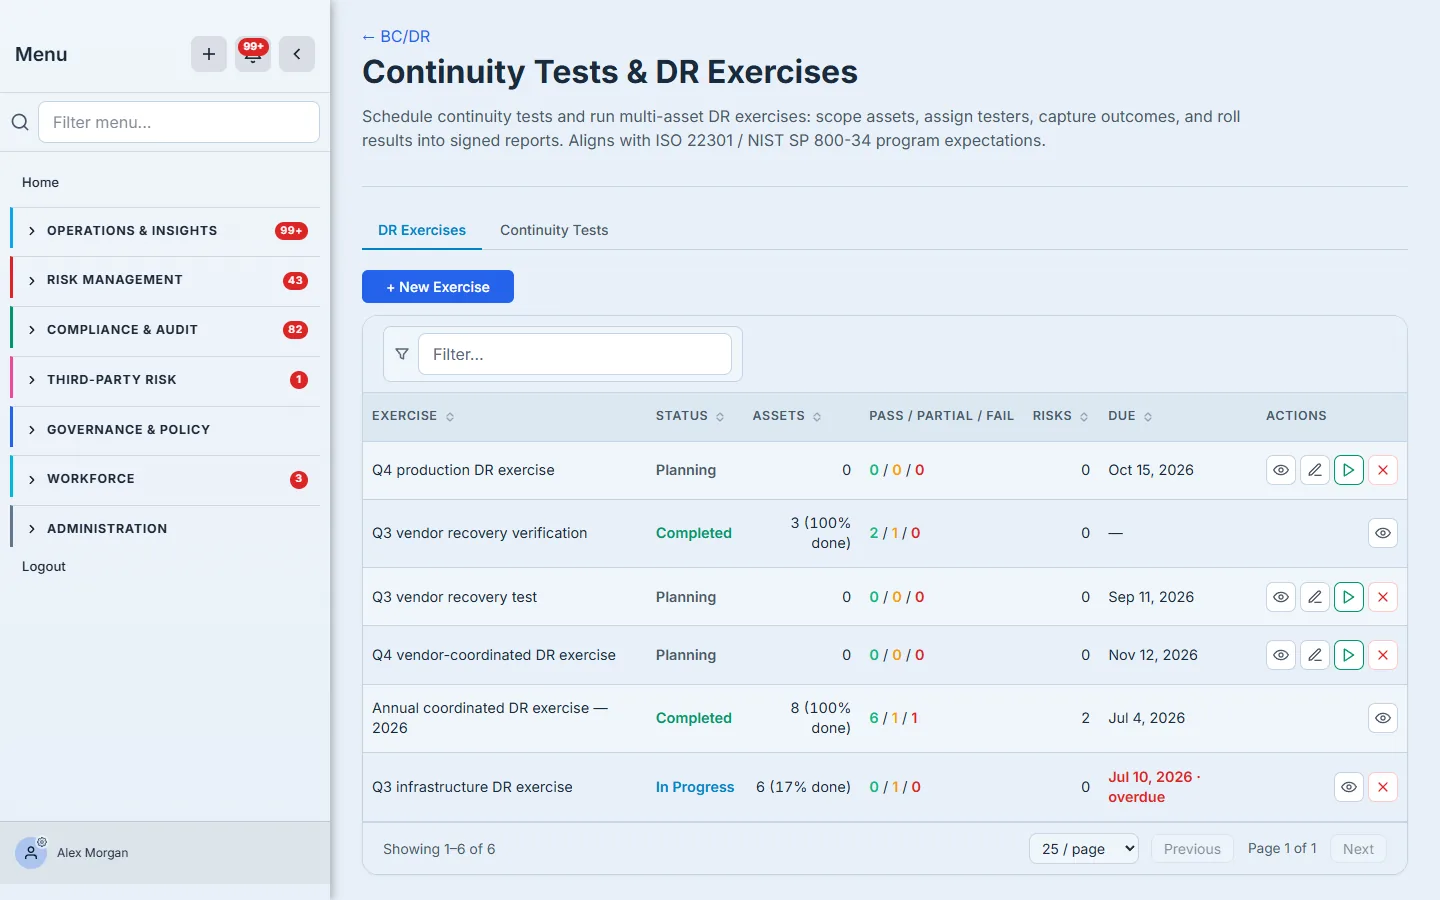
/app/grc/bcdr/exercises) — schedule tests, record outcomes with actual RTO/RPO, and run multi-asset DR exercises that stamp DR-test freshness onto assets and vendors.
What you walk away with
Read monthly, the Resilience Dashboard answers the questions a continuity program is accountable for:
- Is every critical process analyzed and covered? (BIA → Plan Coverage, plus the uncovered-process banner.)
- Would the plans actually meet the targets? (The objective-gap table — commitments vs BIA targets, in one place.)
- Is any of this proven? (Test freshness, actual-vs-target recovery times, the quarterly cadence trend.)
- Does the coverage extend to infrastructure and third parties? (Asset and vendor DR coverage against your own scope policy.)
- Is your platform vendor holding up their half? (The published platform DR tile.)
For the end-to-end program these sections roll up, see Business continuity end to end and BC/DR for ISO 22301 and SOC 2.