An audit lead spends the week before a committee meeting assembling the same picture from a dozen places: how many engagements are live, whether findings are getting closed, how much of the requested evidence has actually come back, and whether the internal audit function itself is in good standing. The Audit Dashboard (/app/audit/dashboard) assembles it continuously, from the records the team already maintains — audit plans, findings, PBC requests, workpapers, and the internal-audit charter. Nothing is entered here; every number is exactly as current as the underlying work. This article walks the page section by section: what each number measures, which record feeds it, and where the dashboard deliberately declines to flatter you.
Who’s involved
- Audit lead / engagement manager — drives each engagement; the pipeline and findings numbers are their scorecard.
- Chief Audit Executive — owns the Internal Audit Function panel: charter, annual plan, universe cadence, QA conformance.
- Audit committee / sponsor — reads the rollup to confirm the program is on track without opening an engagement.
The KPI hero

Four cards, each naming its own denominator. Active Engagements counts audit plans in the active stage (with the overall plan count beneath). Open Findings carries a critical-or-high sub-count — and it counts open findings specifically, which is where the first honesty decision lives: a finding an external auditor has only proposed (a draft they haven’t confirmed) does not count here. The dashboard excludes proposed drafts so your open-findings number reflects your own confirmed work, not another firm’s working papers. PBC Fulfillment is the share of Prepared-by-Client evidence requests that have been accepted, with an overdue sub-count. Workpapers Finalized is the share of workpapers that have completed dual sign-off — here 0%, honestly, because finalization requires a preparer and a reviewer to sign, and a workpaper mid-pipeline hasn’t earned the number yet.
Engagement pipeline
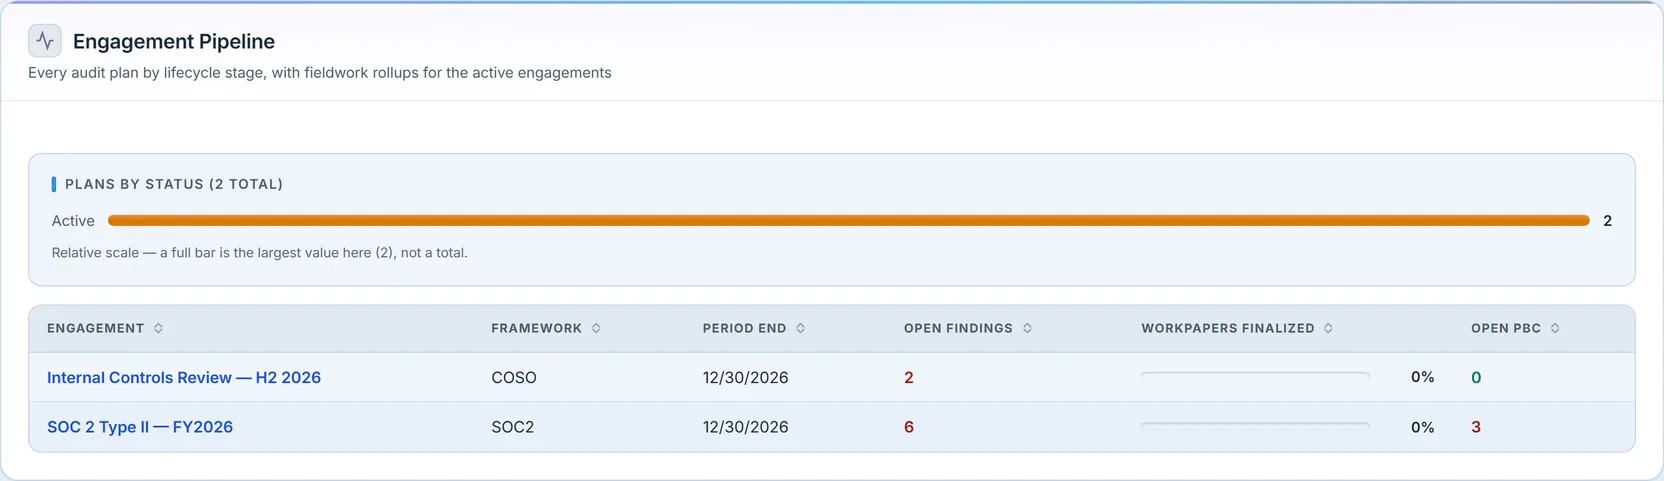
The pipeline shows every plan by lifecycle stage, then lists the active engagements with per-engagement fieldwork rollups: open findings, workpapers-finalized percentage, and open PBC. It’s the “where does each engagement actually stand” view — one row per live audit, so a plan with six open findings and unreturned evidence can’t hide behind a healthy-looking program total.
Findings health
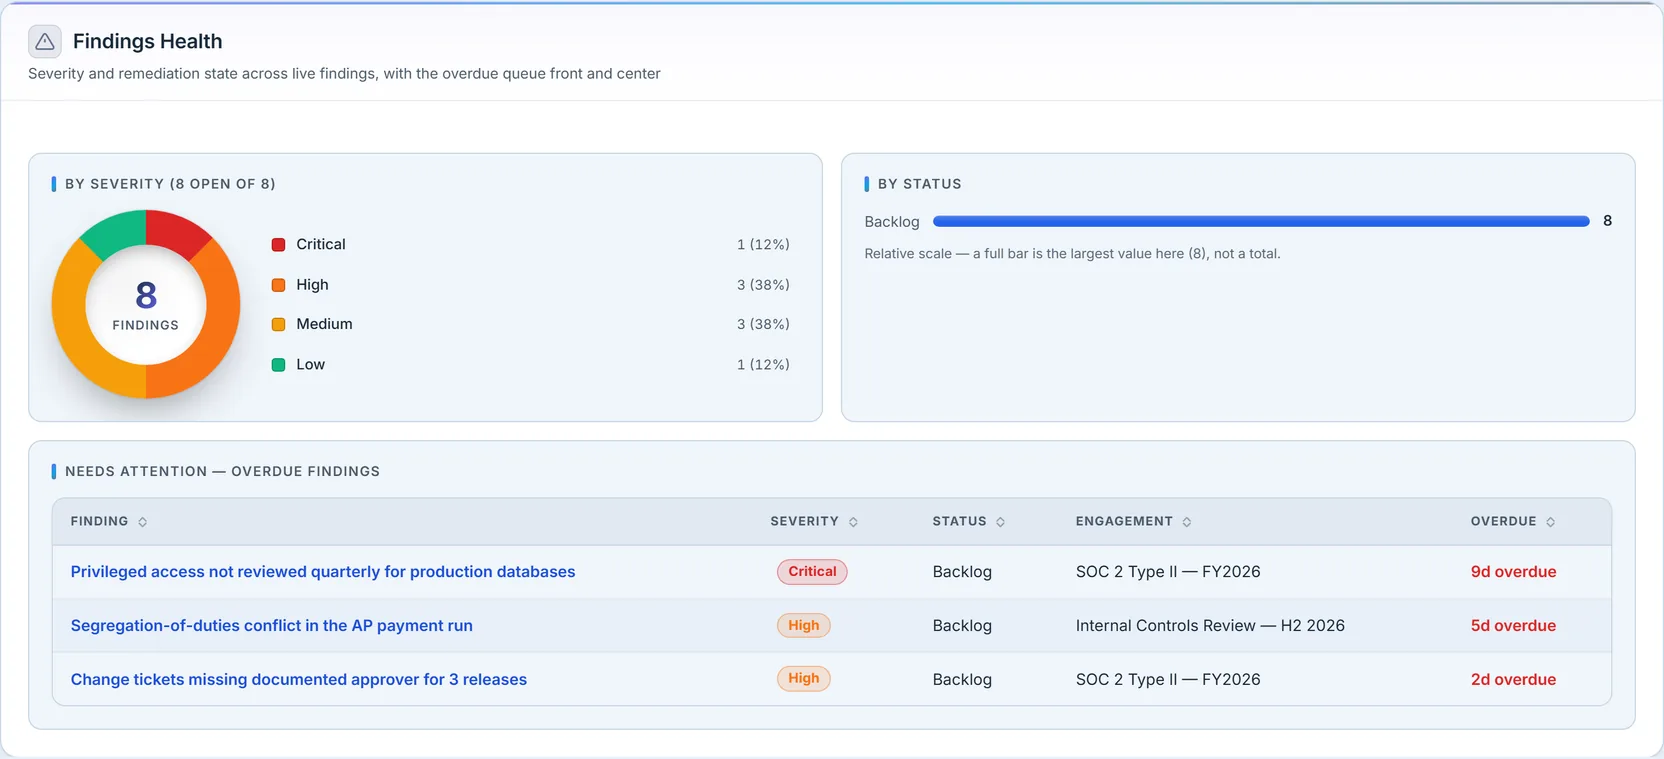
Findings are the audit program’s output, and this section makes their state legible three ways: a severity donut, a status distribution, and — front and center — the overdue queue. Each overdue row names the finding, its severity, the engagement it belongs to, and exactly how many days past due it is, ranked worst-first. Under the hood, audit findings are the platform’s work-item primitive (type='finding'), so they inherit owners, due dates, comments, and the full remediation workflow — the dashboard just reads their severity and due date back.
PBC tracker
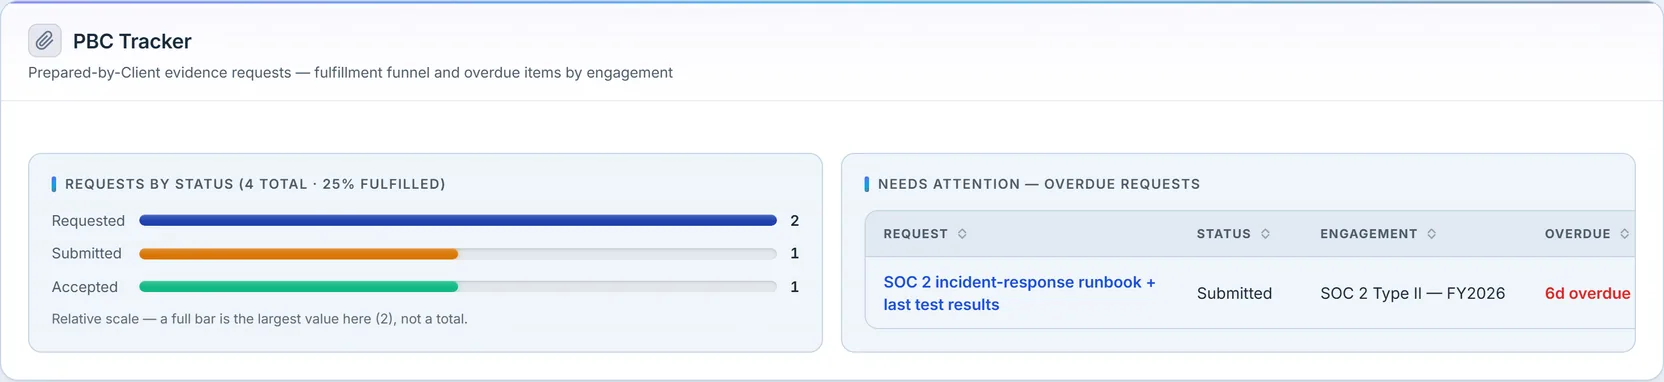
Prepared-by-Client requests are where audits stall — the evidence is requested, and then everyone waits. This section tracks the funnel (requested → submitted → accepted) and surfaces the overdue requests by engagement. Worth knowing what a “PBC request” actually is here: it’s an evidence request tied to an engagement, not a separate request table — the same evidence-request records the fieldwork team already works, filtered to the ones attached to an audit. Fulfillment is accepted-over-total, so a request that’s been submitted but not yet reviewed honestly counts as in-flight, not done.
Workpaper QA
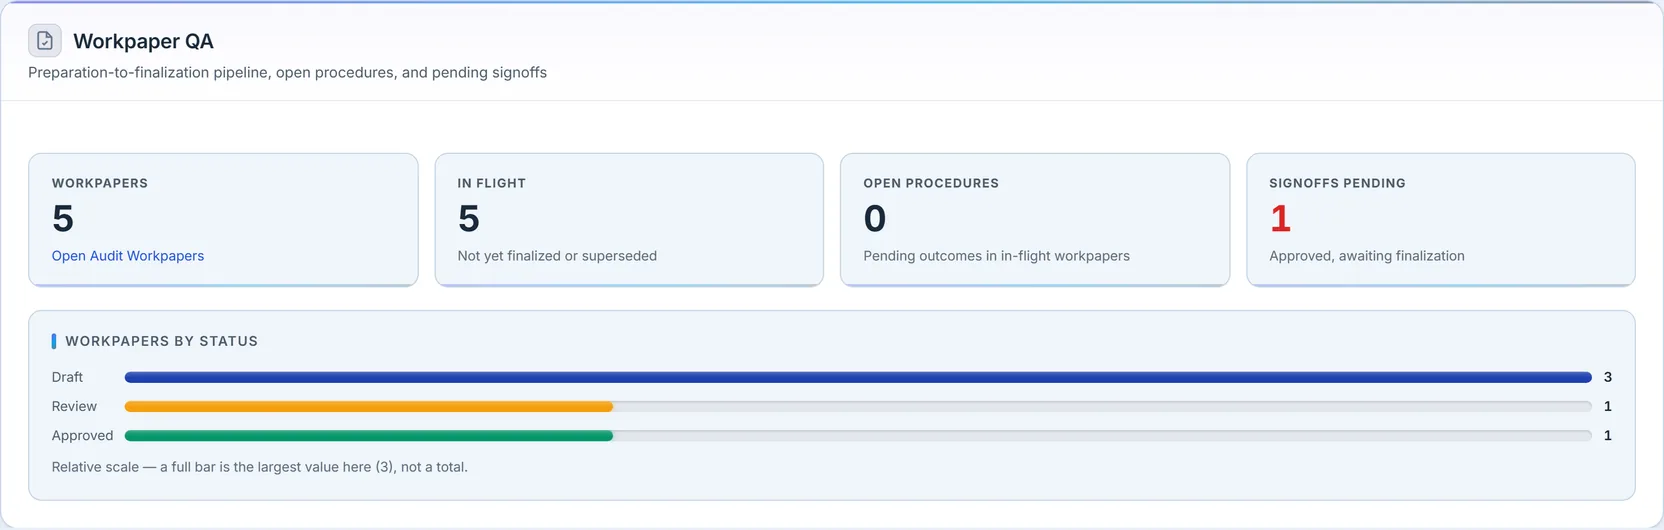
Workpapers are where the testing actually lives, and this panel reads their quality pipeline org-wide: how many are in flight, how many procedures are still open (a procedure whose outcome is still pending), and how many are approved and waiting to be finalized. That last card counts a status, not signatures — no signoff record is consulted — so a draft carrying unsigned roles contributes nothing to it. It was labelled Signoffs Pending until that name was corrected, which is why the distinction is worth stating.
The Internal Audit Function
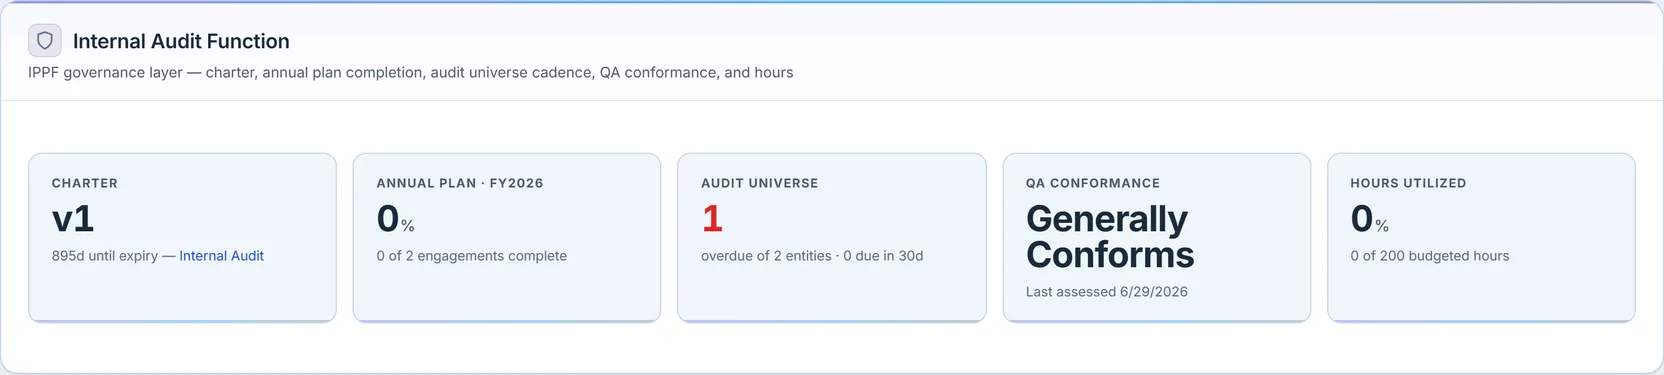
This panel is the IIA/IPPF governance layer — the part an external quality assessor checks. It rolls up the charter (and how long until it expires), annual plan completion, the audit universe cadence (how many auditable entities are overdue for their next review), QA conformance (the standing self- or peer-assessment rating), and hours utilized against budget. It appears only for organizations that have stood up an internal audit function and granted the relevant access — teams without it simply don’t see the panel, rather than staring at an empty governance shell.
Fieldwork activity
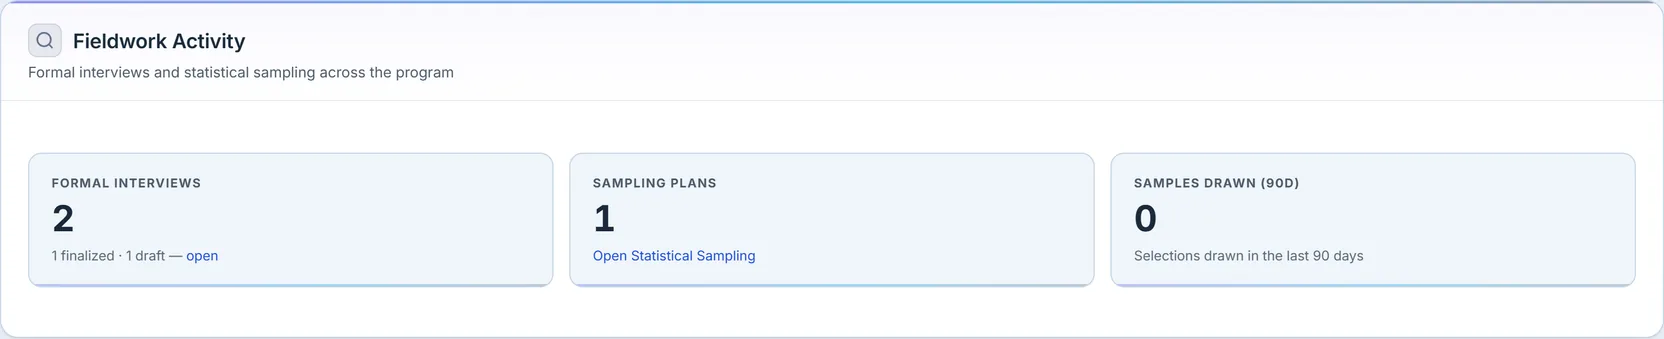
Fieldwork is the evidence-gathering underneath the findings: formal interviews (with a finalized-versus-draft split, because an interview isn’t evidence until it’s signed off) and statistical sampling plans. It’s a compact strip — the detail lives in the interview and sampling workspaces — but it confirms the engagement is doing real testing, not just tracking status.
Readiness & drift
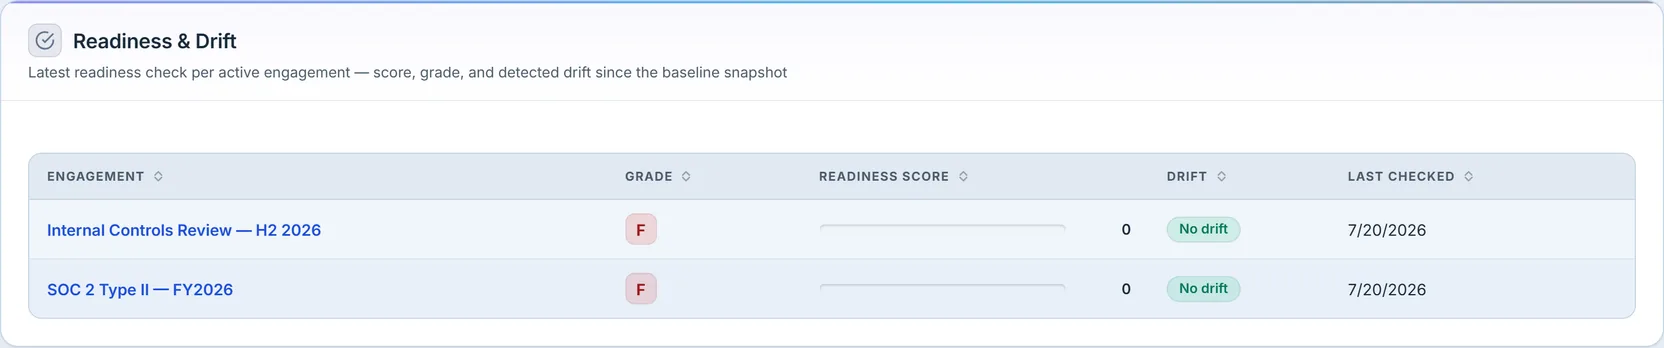
For each active engagement, the readiness check scores how audit-ready the evidence and controls are, expresses it as a letter grade, and flags drift — how much the posture has moved since the last baseline snapshot. A grade that slips between checks is the early warning that an engagement heading into fieldwork isn’t as prepared as it was, while there’s still time to fix it.
The frame above is worth reading twice, because it shows the panel getting that wrong. Both engagements are graded F against a readiness score of 0, beside a green No drift — and neither had ever had a baseline snapshot captured, so nothing had been compared and there was no score to report. The stored row said so: readiness comes from a comparison, and where there is no baseline the writer recorded a null baseline id alongside a zero it was obliged to store, because the column cannot be null. The summary behind this panel selected the zero and not the id that qualified it, so an engagement nobody had measured was presented as one that had been measured and failed — and the reassuring “No drift” beside it was equally unearned, since there was no baseline to drift from.
That is now fixed: an unbaselined engagement renders an em dash carrying its reason, in all three columns, the way the rest of this page treats a figure it cannot vouch for. We have left the old frame in place rather than quietly swapping it, because the failure it shows is the exact one the last section of this article claims the dashboard avoids, and a page that makes that claim should be willing to show where it did not hold.
Findings trend
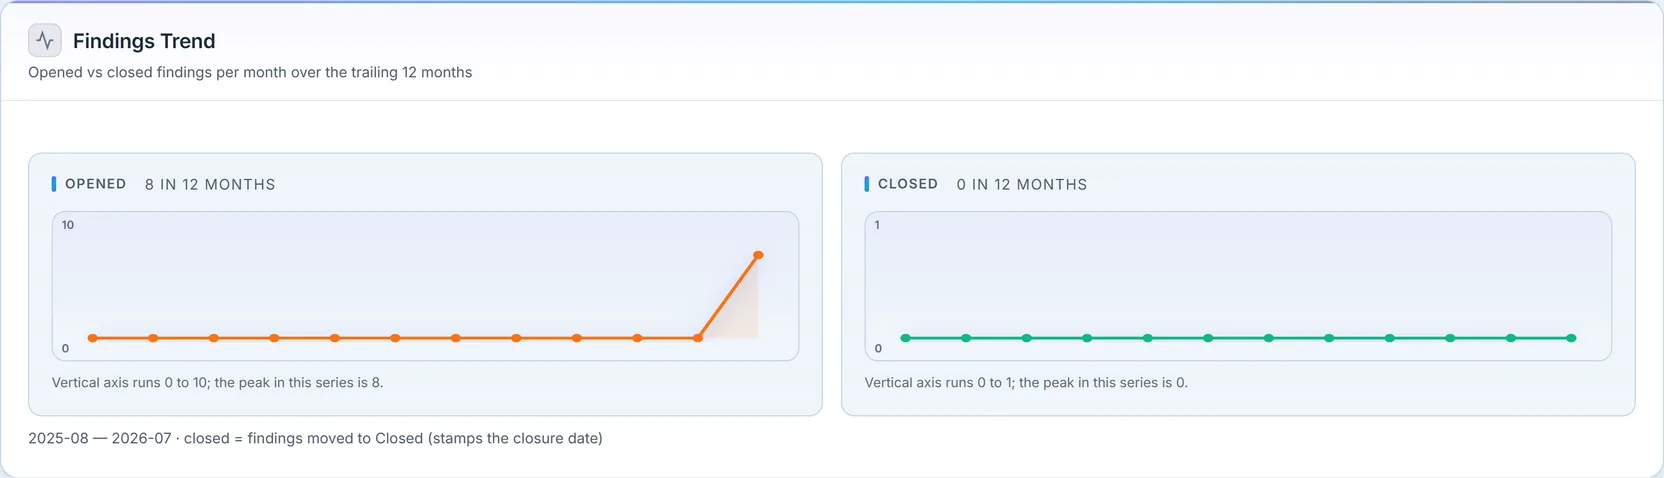
The last section is the throughput view: findings opened versus findings closed, month by month over the trailing year, each panel labeled with its own axis range. When the opened line runs above the closed line, the finding backlog is growing regardless of how good the severity mix looks — and “closed” means a finding actually moved to a closed state with a stamped closure date, not just aged out of view.
One thing this page deliberately lacks is a “last refreshed” bar. The handlers behind it don’t return a computed-at timestamp, so rather than show a reassuring “updated just now” it can’t actually vouch for, the dashboard shows nothing and refreshes when you return to the tab. It’s the same discipline as the rest of the page: a number appears only when the record behind it earns it.
What you walk away with
- An open-findings count that means what it says — your confirmed findings, with external-auditor drafts excluded.
- PBC fulfillment as accepted-over-total, so in-flight evidence isn’t counted as done, and overdue requests surface by engagement.
- A workpaper QA pipeline that shows where testing is stuck — drafted, in review, or approved and awaiting finalization.
- The internal-audit function as a governance scorecard — charter, plan completion, universe cadence, and QA conformance in one panel.
- A readiness grade with drift, and a findings backlog verdict you can’t argue with.
Running the engagements this page rolls up — scoping a plan, testing controls, documenting findings, and sending PBC requests — happens in the Audit Management workspace; the evidence packages auditors receive are walked in Evidence package for auditors, and getting an engagement audit-ready in Framework readiness to audit package. For the framework coverage these audits assure, see Reading the Compliance dashboard.