The slowest part of most compliance programmes is not deciding what evidence is needed. It is asking a person for it.
Someone in security exports the MFA report. Someone in platform screenshots the S3 bucket policy. Someone in HR pulls the training completion list. Each request is small, each is somebody’s fourth priority, and each has to happen again next quarter. The work is not hard; it is just endless, and it arrives as a nudge in a chat channel rather than as a control.
Automated evidence collection replaces the nudge with a connector. Talarity authenticates to the system that already holds the proof — your identity provider, your cloud account, your security awareness platform — and pulls the relevant records on a cadence you set. Nobody is asked. The evidence arrives whether or not anyone remembers.
That is the promise, and it is real. But the machinery behind it has more moving parts than most walkthroughs admit, and knowing where a collected record actually lands is the difference between trusting the number on this page and being surprised by it during fieldwork.
What the page is for
/app/grc/evidence-collection is the operations view for the collection engine. It answers four
questions, one per tab: Overview breaks the estate down by source and evidence type, Collection Jobs
lists the per-control continuous sources, Collected Evidence lists the individual records that
reached your compliance evidence, and Schedules lists what is set to run.
Above those tabs sit four counters. The Overview tab then opens on a connector coverage panel, and that panel is the part worth looking at first — the most honest surface on the page. It lists every connector the collection engine can run — sixteen of them — and states, for each, whether it is connected, whether it has ever synced, whether it is reporting, and how fresh its last report is.
Those states are what the panel can distinguish once connectors exist. On an organisation that has connected nothing, every card reads the same “Not connected” — which is the honest answer, and more useful than an empty box would be.
That framing matters because it inverts the usual empty state. A page that lists only what you have configured tells a new organisation nothing. A page that lists what is available and marks sixteen of them “not connected” tells you exactly what the feature is and where you stand in it.
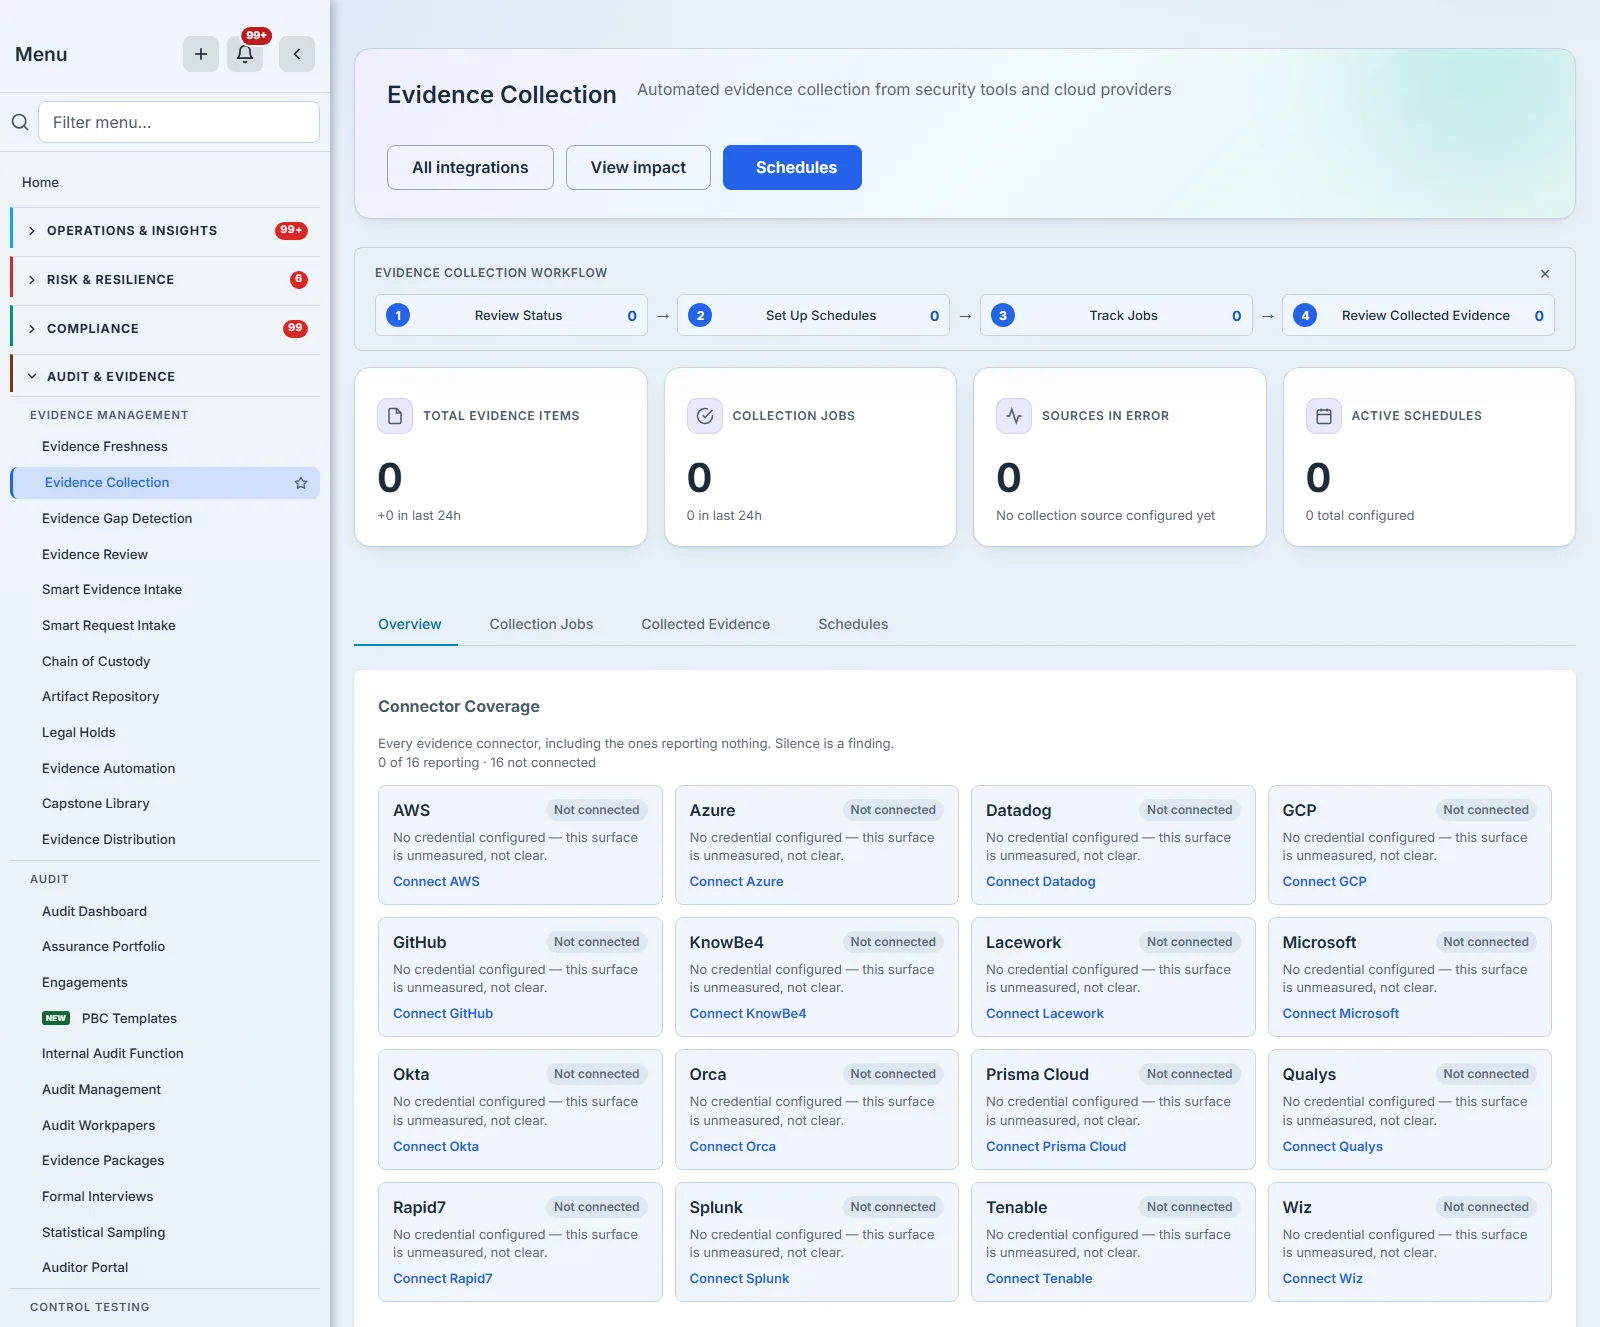
Read the counters carefully. Sources in Error reads zero, and the line beneath it says no source is configured yet rather than implying a clean bill of health — those are different facts and the page refuses to conflate them. It is a small thing, and it tells you whether the rest of the numbers can be trusted.
Setting one up
A collection schedule is a connector plus a cadence. You choose the provider, supply credentials for it, pick how often it should run, and save.
The credential fields you are asked for come from the connector itself rather than from a list the page keeps — so an AWS schedule asks for an access key ID and secret, with an optional region and role ARN, while a KnowBe4 schedule asks only for an API key and an optional region. This sounds like an implementation detail and is not: it is the difference between a form that works for every provider the engine supports and one that works for the five somebody remembered to hardcode.
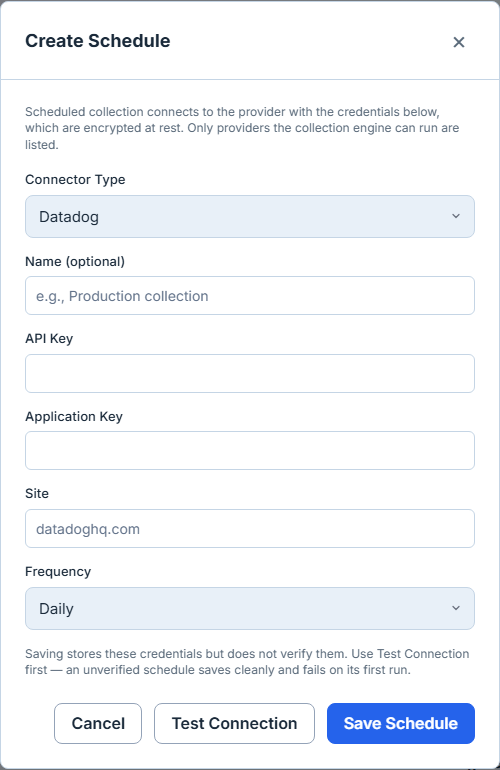
Pick a different provider and the fields change with it, because they are the connector’s own declaration rather than a list this page maintains.
Test Connection is worth using, and it is optional. It authenticates against the provider with the credentials you have entered and reports what identity it resolved. Saving does not run that test — the dialog says so above the buttons, because a schedule saved with wrong credentials saves cleanly and then fails on its first unattended run. That is a reasonable design; credentials sometimes have to be entered before they are activated. It does mean a green save is not a working connector. Press the button.
Running one, and what “run” means
A schedule can run on its cadence or on demand. On demand, the important thing to understand is that the run is queued, not performed.
Talarity hands the work to a background driver that sweeps every fifteen minutes, so a run you trigger by hand can sit waiting for up to that long before it starts. The page tells you the collection has been queued rather than claiming it finished, because at the moment you click, it has not — and it will still be true several minutes later.
This is the right architecture — a collection that walks an entire cloud account should not hold a browser request open — but it changes what the screen means. The row’s Last Run column will still say what it said a moment ago, and refreshing immediately proves nothing.
Where the outcome appears is worth knowing before you go looking. This page shows a schedule’s last run status, but not its run history — the per-run record of what each run collected, how many items it processed, and how long it took. That lives on Evidence Review, under Collection History. It is a genuine gap in this page rather than a design decision, and until it closes, Evidence Review is where to check whether the run you just queued actually worked.
That history also tells you why a run failed, which is the part worth knowing before you go hunting. The collection runtime classifies every failure — credentials rejected, rate limited by the provider, timed out, network, configuration — and Collection History carries that classification in its own Reason column, with the provider’s own message on the line beneath it. Expired credentials and a rate-limited provider are different problems with different fixes, and the run record says which one you have.
Where collected evidence actually lands
Here is the part that surprises people, and it is worth stating plainly rather than discovering it in an audit.
A successful connector run does not automatically populate the Collected Evidence tab.
The collection engine writes what it retrieves into its own store. A separate step promotes those records into the compliance evidence surface, and it only promotes a record when the evidence type maps to a control you have adopted. An MFA status report maps cleanly. A Microsoft 365 conditional access policy export, today, does not — roughly half the evidence types the connectors can retrieve have no control mapping yet.
So it is entirely possible — normal, even — to have a connector reporting healthily, with a successful run history and hundreds of signals, and a Collected Evidence tab that says nothing has been collected. Both statements are true. They are counting different things.
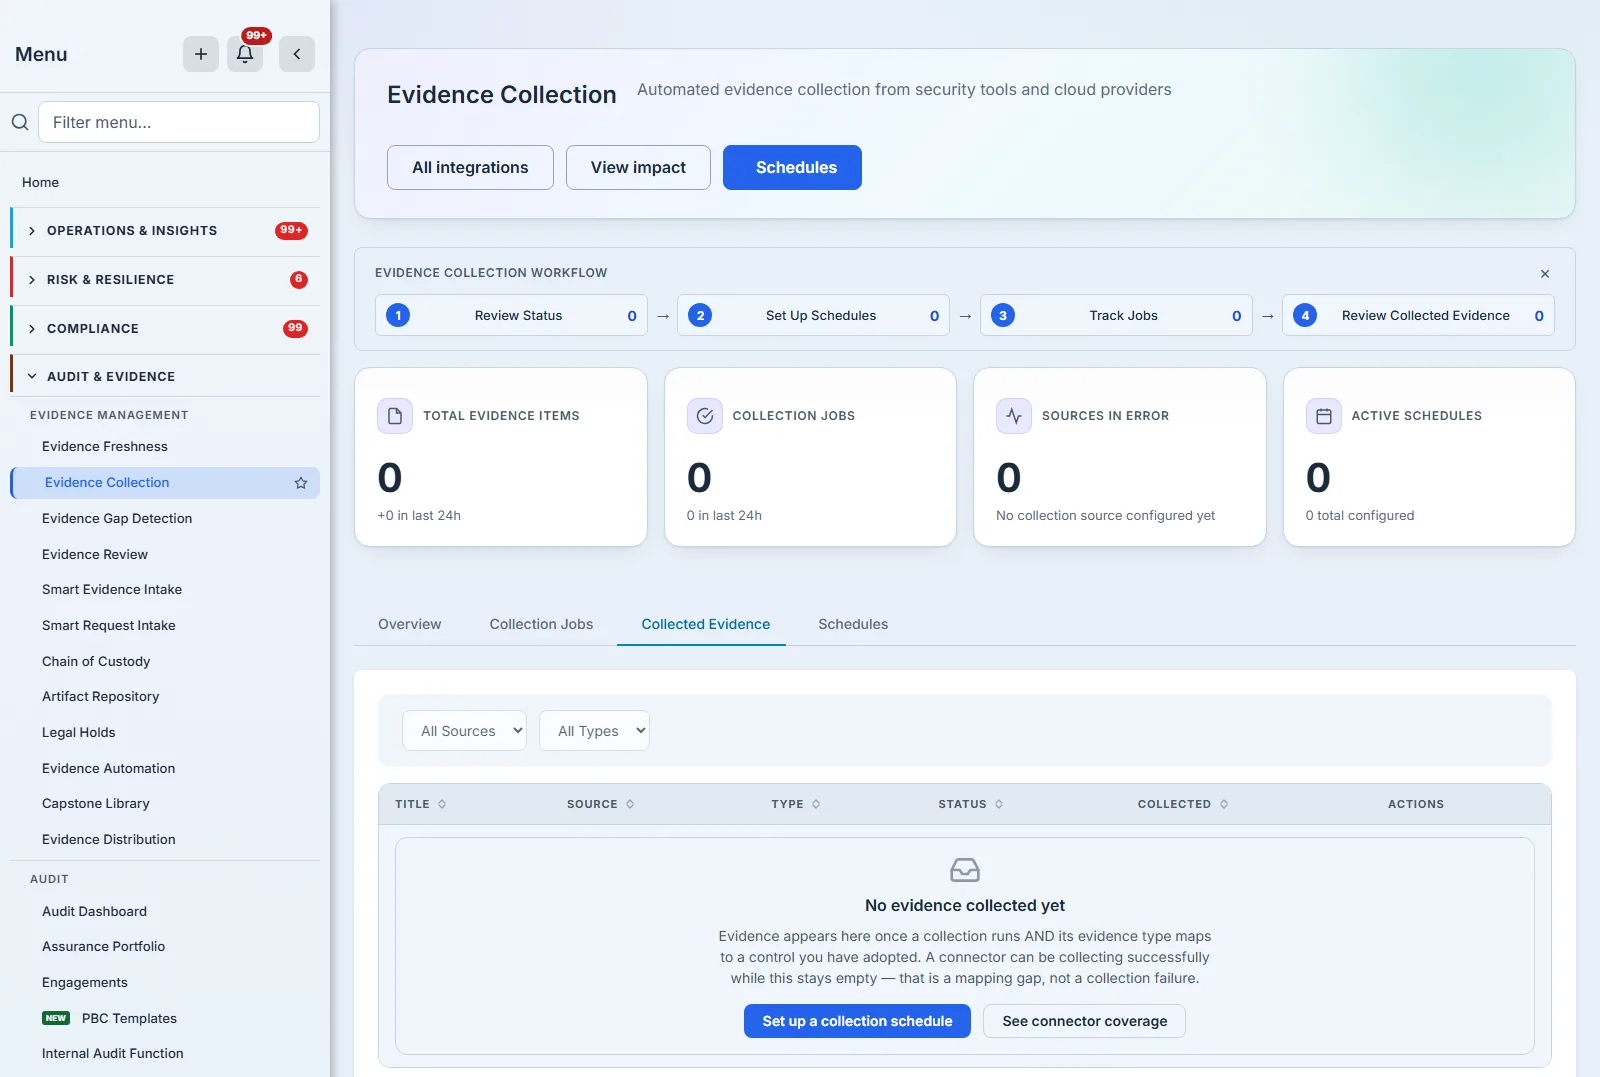
The coverage panel counts what the engine retrieved. The Collected Evidence tab counts what reached your compliance evidence with a control attached. If those two disagree on your tenant, the gap is the mapping, not the connector.
Note the filters above the table: with nothing collected there is nothing to filter by, so the controls are disabled rather than offering options that would match no rows. That is worth mentioning because the opposite — a populated dropdown whose every option returns an empty table — is a genuinely confusing thing to meet, and this page used to do it.
The counters, and what each is really counting
Total Evidence Items counts the collected-evidence rows the page has loaded, and the page loads at most the most recent 500 — when you are over that, the card says so directly beneath the counters. That is subject to the mapping gap above — and it also includes failed collection attempts, because a continuous source records every refresh it tries, successful or not, so the attempt itself stays in the audit trail. A source that has been failing hourly for a week will have pushed this number up considerably. Treat it as a count of recent collection activity rather than a count of usable proof.
Collection Jobs counts collection job records. These come from continuous evidence sources configured against individual controls, not from connector schedules. A connector run does not create one.
Sources in Error counts collection sources whose last run recorded a failure. A zero here is a real result rather than an absence — but only once something is being measured, and the card distinguishes the two: with sources configured and none failing it reads as good news, and with nothing configured at all both its tone and the line beneath it drop back to neutral rather than reporting an all-clear nobody earned.
Active Schedules counts enabled connector schedules.
Two of those four count one mechanism and two count another. That is worth knowing before you build a board slide on them: this page shows two related but distinct systems — connector schedules, and per-control continuous evidence sources — and its counters do not all read from the same one.
What this page does not do
It does not chase anyone. There is no owner on a schedule, no assignment, no escalation when a connector starts failing. The failure surfaces here as a status; acting on it is a human step.
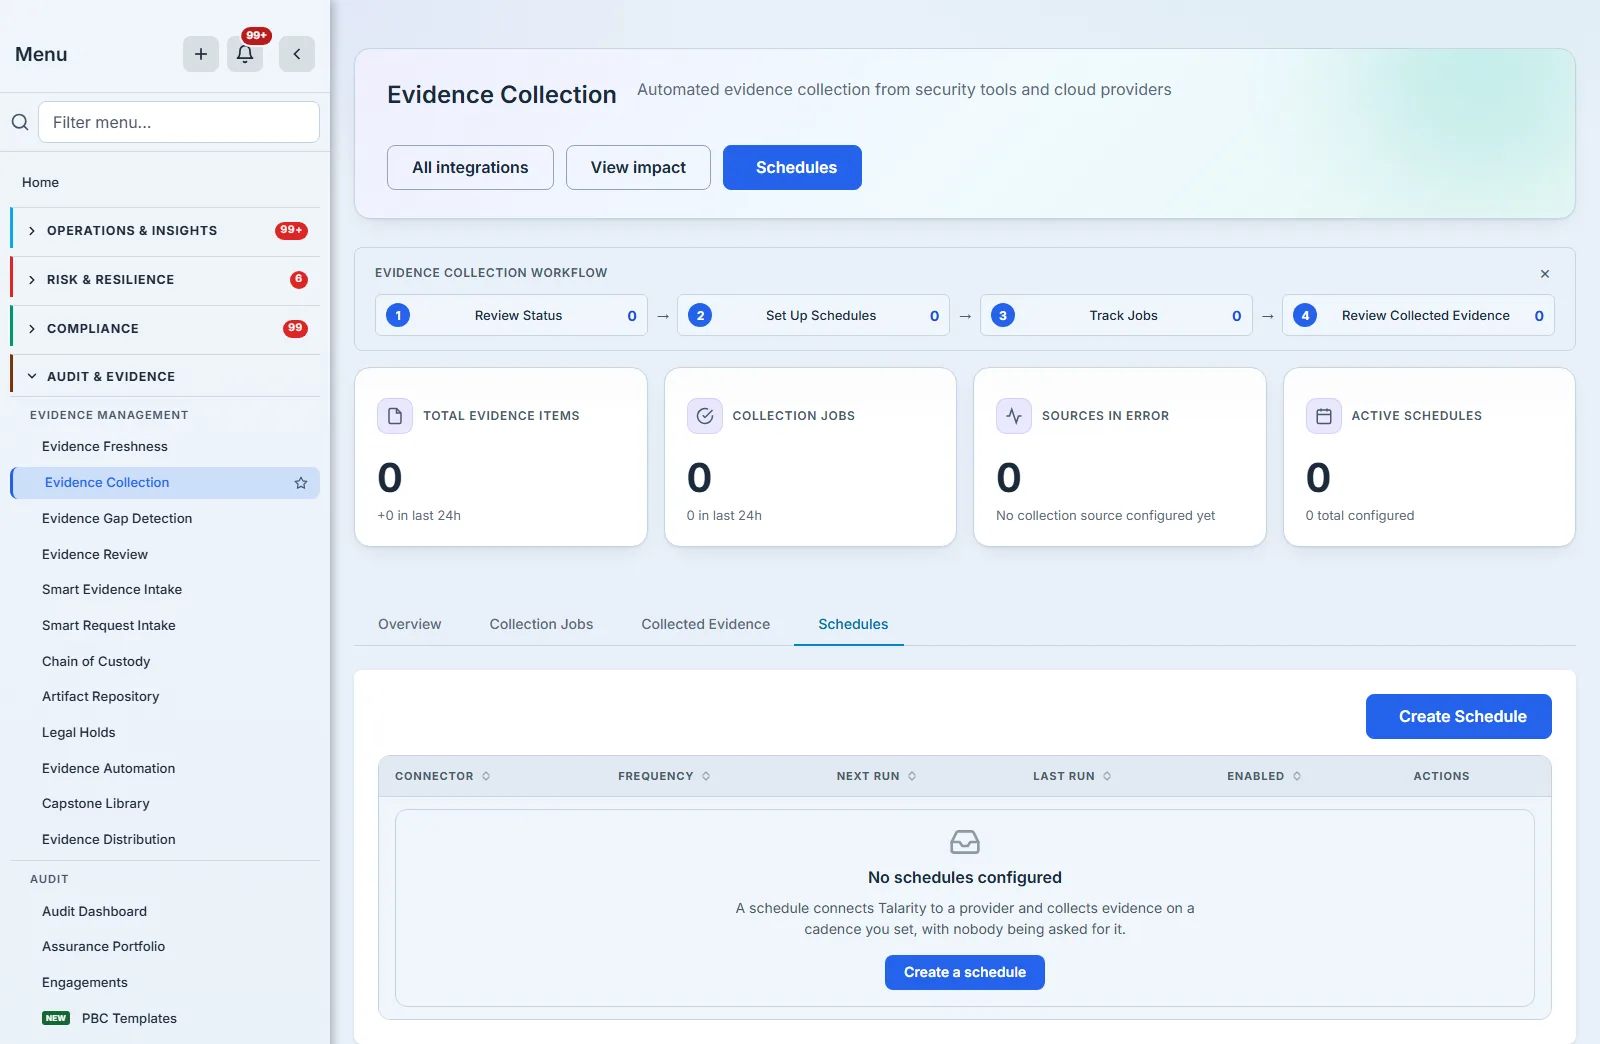
It does not show run history. A schedule’s last run status appears here; the per-run detail — what each run collected, how many items it processed, how long it took — does not. That is on Evidence Review, and it is the first place to look when a run does not do what you expected.
It does not edit a schedule. You can enable, disable, run and delete one. To change a cadence, re-scope which evidence types it collects, or rotate a credential, use the editor on Evidence Review or on the Evidence Automation settings page — all three surfaces write the same record, and a blank credential field there keeps the stored one rather than clearing it.
It is not the only surface that manages these schedules. The same connector schedules are visible and editable from Evidence Automation settings and from Evidence Review. They are the same records, and a schedule created in one appears in the others.
It has no export and no search. For a small estate the tables are readable as they stand; for a large one, the Evidence Review page is the better vantage point.
Where it fits
Evidence collection is the front of a chain, not a destination. Collected records feed the evidence library, which feeds control testing and assessment answers, whose freshness is graded by the Evidence Freshness dashboard. A connector that runs weekly is what stops that freshness clock from running out.
The honest summary is this: the collection engine works, the connector coverage panel tells you the truth about it, and the gap between “the engine collected something” and “the evidence is on my control” is a mapping question you should check on your own tenant rather than assume.
What you walk away with
- A connector schedule authenticates to a provider and pulls evidence on a cadence, with no human in the loop.
- Test Connection is optional and worth pressing; a clean save is not a working connector.
- A run is queued, not performed — and the run history that holds its outcome is on Evidence Review, not on this page.
- Collected evidence reaches your compliance surface only when its type maps to an adopted control, and about half the available types do not map yet.
- The coverage panel is the most reliable thing on the page: sixteen connectors, honest states, and a clear next step for each.