Most evidence automation stops at the connector. You pick a provider, paste a credential, choose a cadence, and the platform goes and fetches things on your behalf. That works for the systems a vendor has decided to support.
It does nothing for the other half of your estate: the build pipeline that already produces a dependency scan on every merge, the internal access-review script somebody wrote in 2023, the bespoke tool your platform team maintains and nobody will ever write a connector for. Those systems already generate the evidence. They just have no way to hand it over.
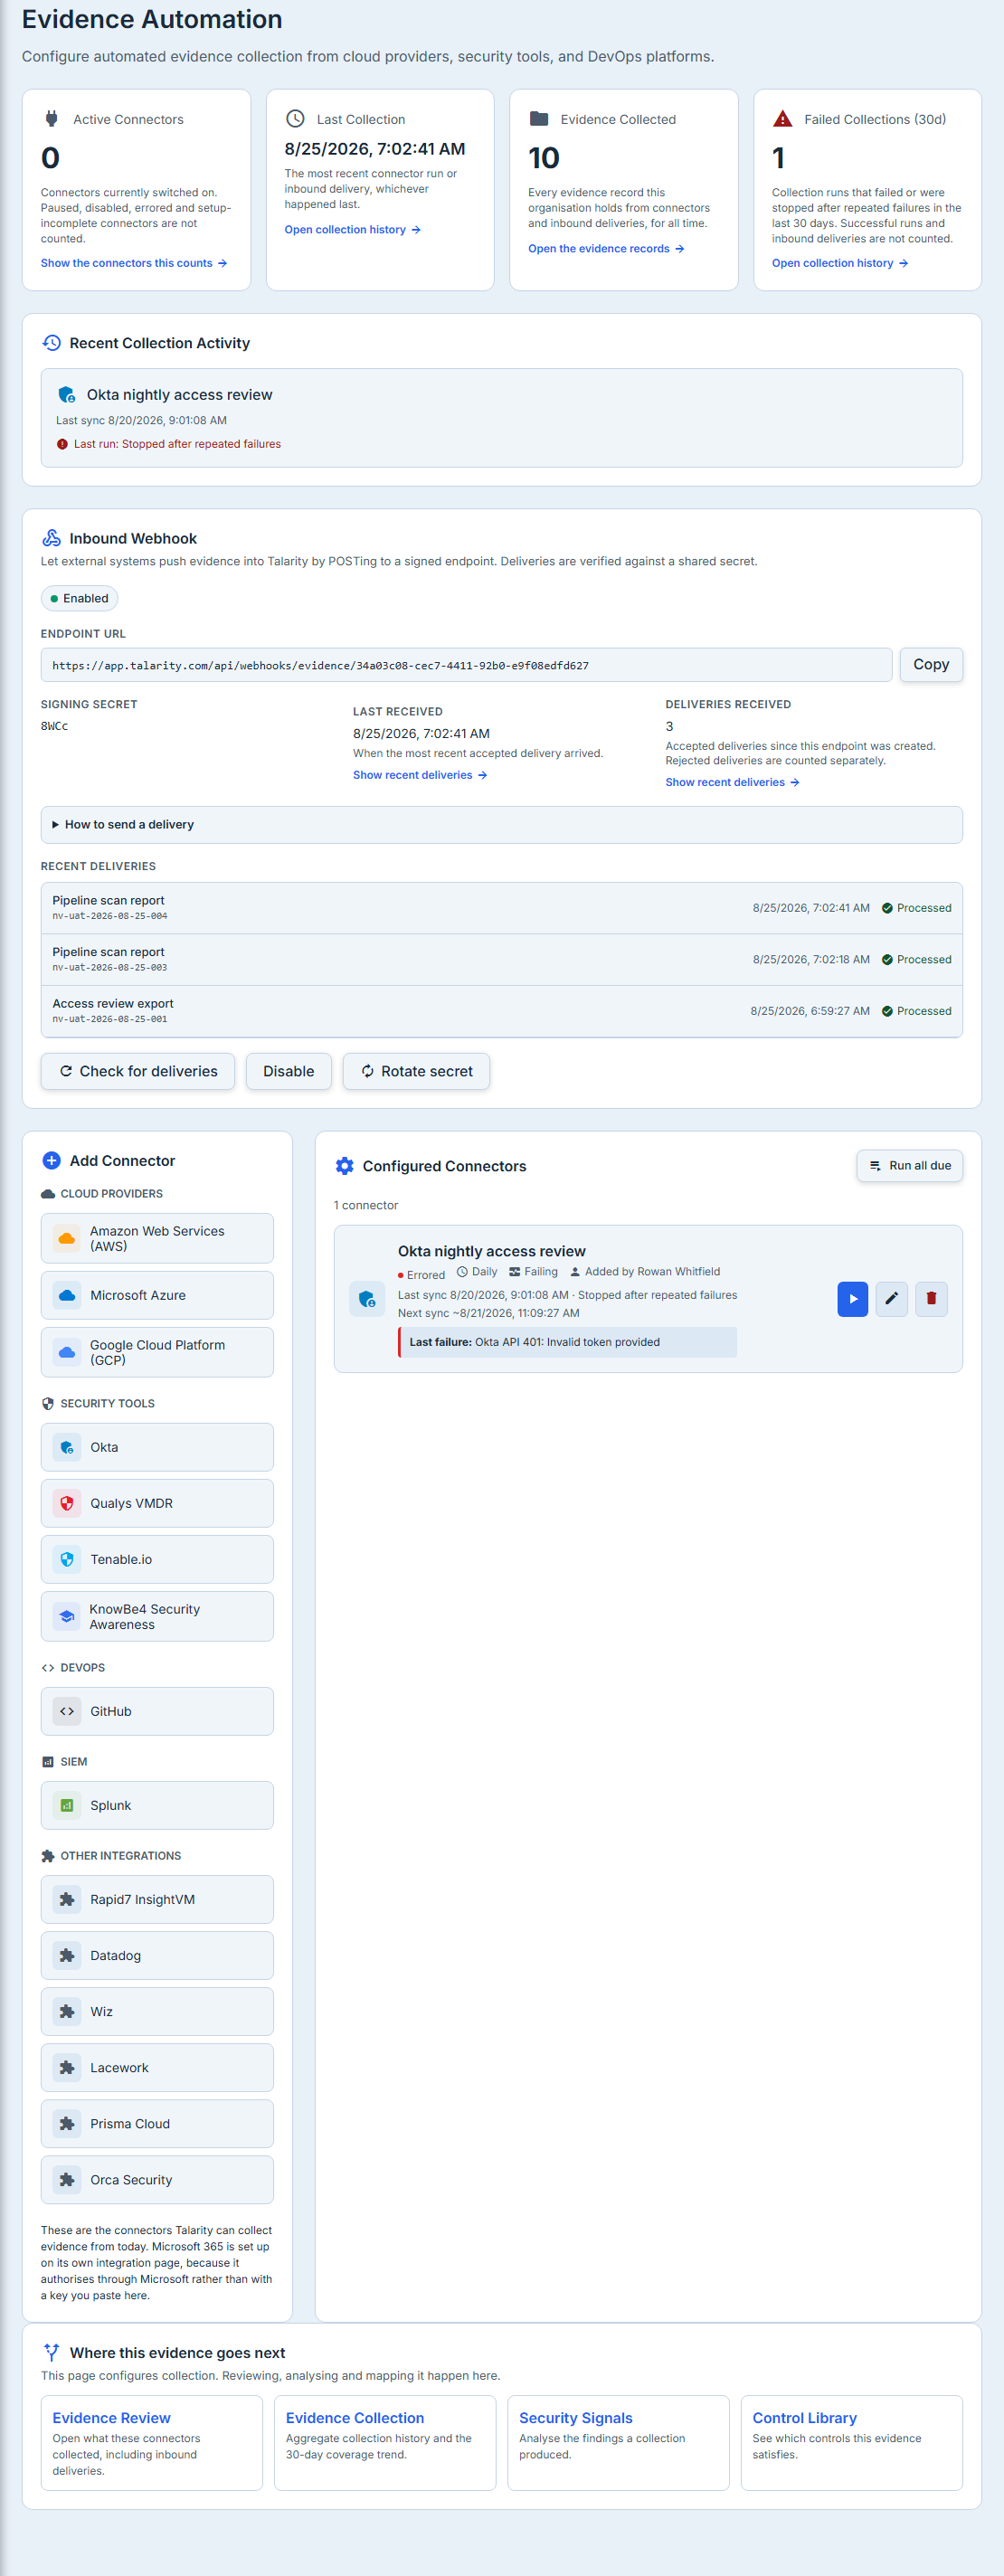
Evidence Automation is the page where both problems get solved, and it is worth understanding as two doors rather than one feature. A connector is Talarity reaching out on a schedule — it holds a credential to your system and polls it. An inbound webhook is the reverse: Talarity mints a signing secret and an endpoint, and anything that can make a signed HTTPS request pushes evidence in whenever it likes. The first door needs Talarity to support your vendor. The second only needs you to be able to POST.
Finding it, and what it is not
It is a tab, not a sidebar entry: Evidence Library → Automation. The address bar will read
/app/settings/evidence-automation, which is where the confusion comes from — the route is a
settings route, but there is no Settings screen that lists it, so looking under Settings will not
find it. It is administrator-only and needs the GRC Professional package or higher.
What it is, once you are there, is the configuration surface: where connectors are created, credentials are rotated, cadences are changed and the inbound endpoint is switched on.
It is not the operations view. The per-run detail — what a given run collected, how many items it processed, what it mapped to — lives on Evidence Review, and the estate-wide coverage breakdown lives on the Evidence Collection dashboard. If you have read Collecting evidence without asking anyone, that article is the other end of this one: it describes what the engine produces, and points here for the editing.
Four counters sit across the top, and they are worth reading precisely because two of them count different things.
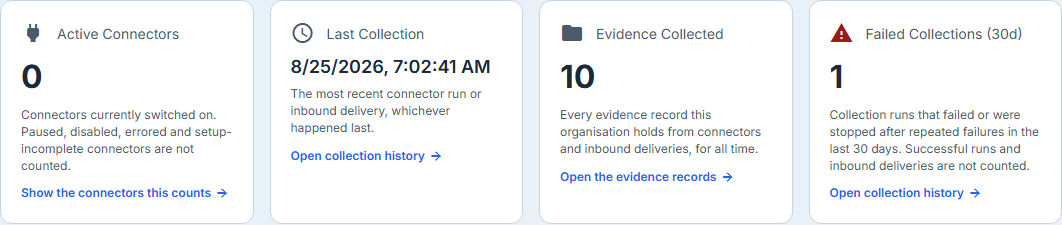
Active Connectors counts connectors currently in the active state — not connectors that exist. A connector the runtime has moved to errored is not counted here, which is the point: the number answers “how much of this is working”, not “how much have I configured”.
Evidence Collected spans both doors. It is connector-collected records plus everything pushed in through the inbound endpoint, which is the only honest way to count it on a page that owns both.
Failed Collections names its window in the label — thirty days. A bare failure count with no period attached is the shape that lets a number from six months ago read as a current problem.
While any of these is still loading, it renders an em dash rather than a zero. That is deliberate:
on a page whose entire job is telling you whether collection is running, a confident 0 and an
unmeasured 0 look identical to a reader, and one of them is a lie.
Door one: a connector that pulls
The picker lists the connectors you configure with a credential here, grouped into five categories — Cloud Providers, Security Tools, DevOps, SIEM and Other Integrations.
One connector the engine runs is deliberately absent from this list. Microsoft 365 manages its own credentials through an OAuth consent rather than a token you paste, so it is connected on Integrations → Microsoft 365 instead; once connected it collects on the same engine as everything here. If you came to this page looking for it, that is where it is.
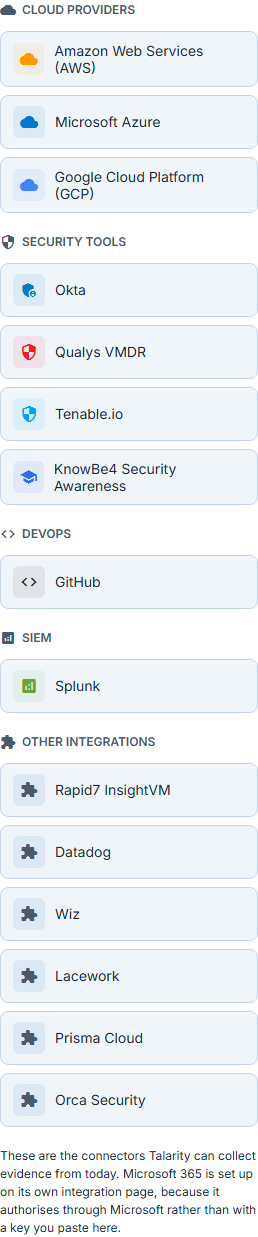
The buttons carry a name and an icon. The one-line summary of what a connector collects appears once you open it, at the top of its configuration modal — Splunk’s reads audit log records and configuration-rule state, the two evidence types that connector actually supports. Treat that summary as orientation rather than a contract: the authoritative list is the Evidence Types panel further down the same modal, which is built from what the engine reports rather than from a catalogue entry. If the two ever disagree, the panel is right.
Choosing one opens the configuration modal.
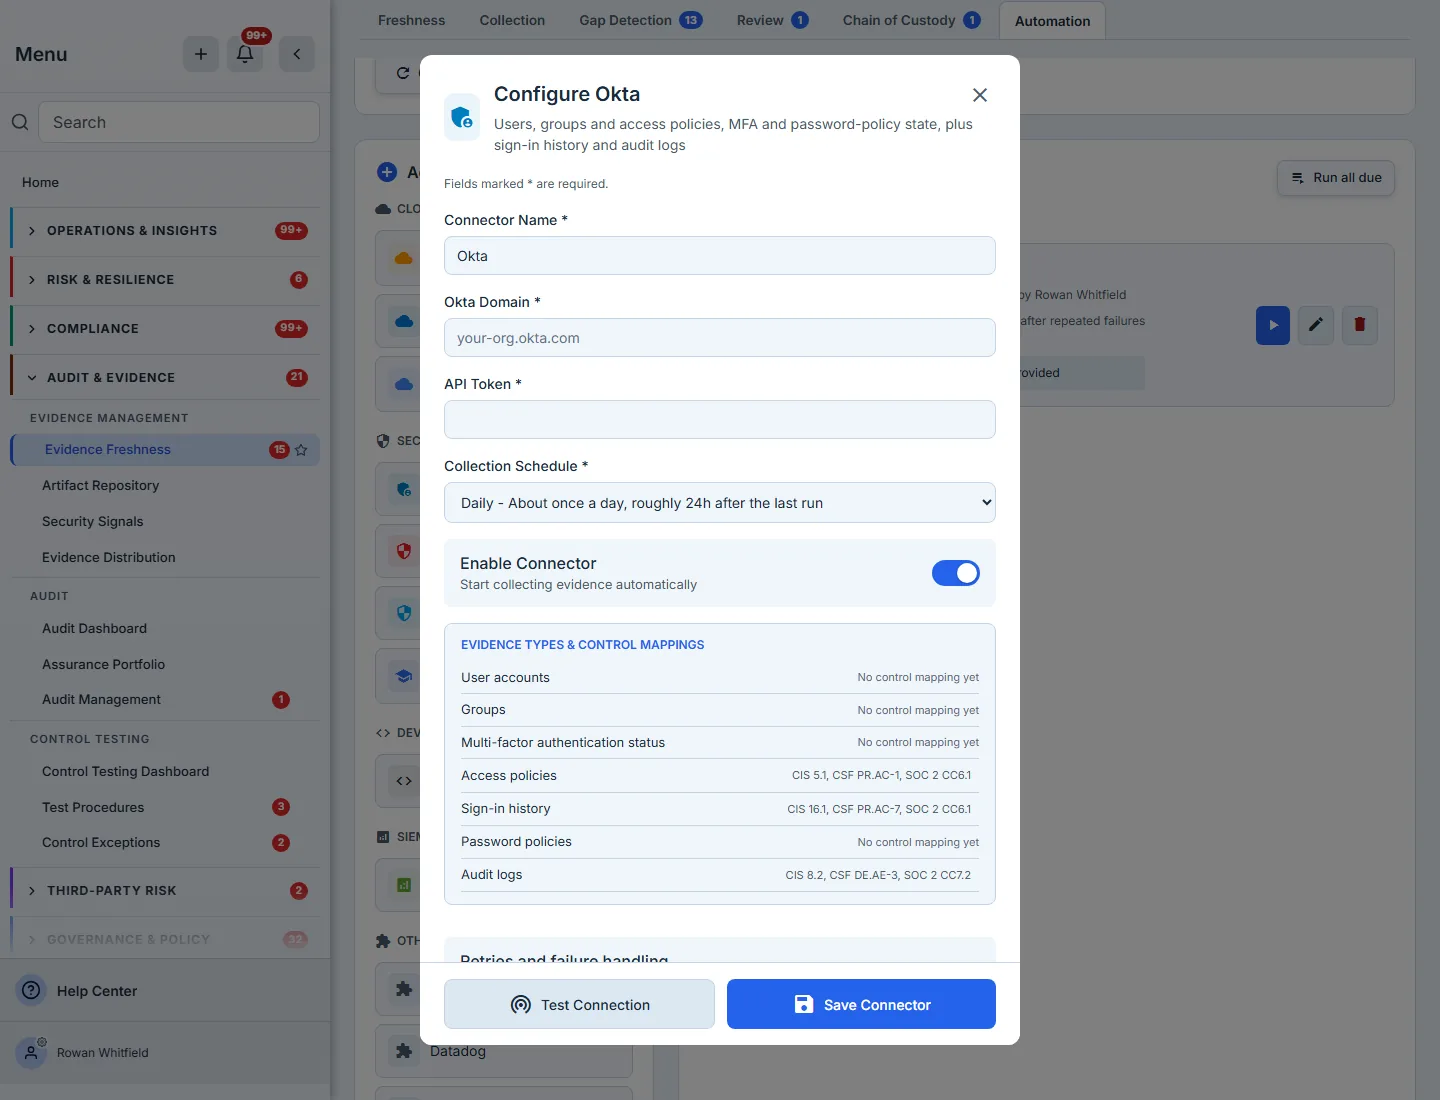
The credential fields are the connector’s own — declared by the engine, not a generic key/secret pair. Okta asks for a domain and an API token; AWS asks for what AWS needs. Give the connector a display name you will recognise in a list six months from now; “Okta nightly access review” is more use than “Okta”.
The schedule, and what it actually means
This is the control most worth reading carefully, because the obvious reading is wrong.
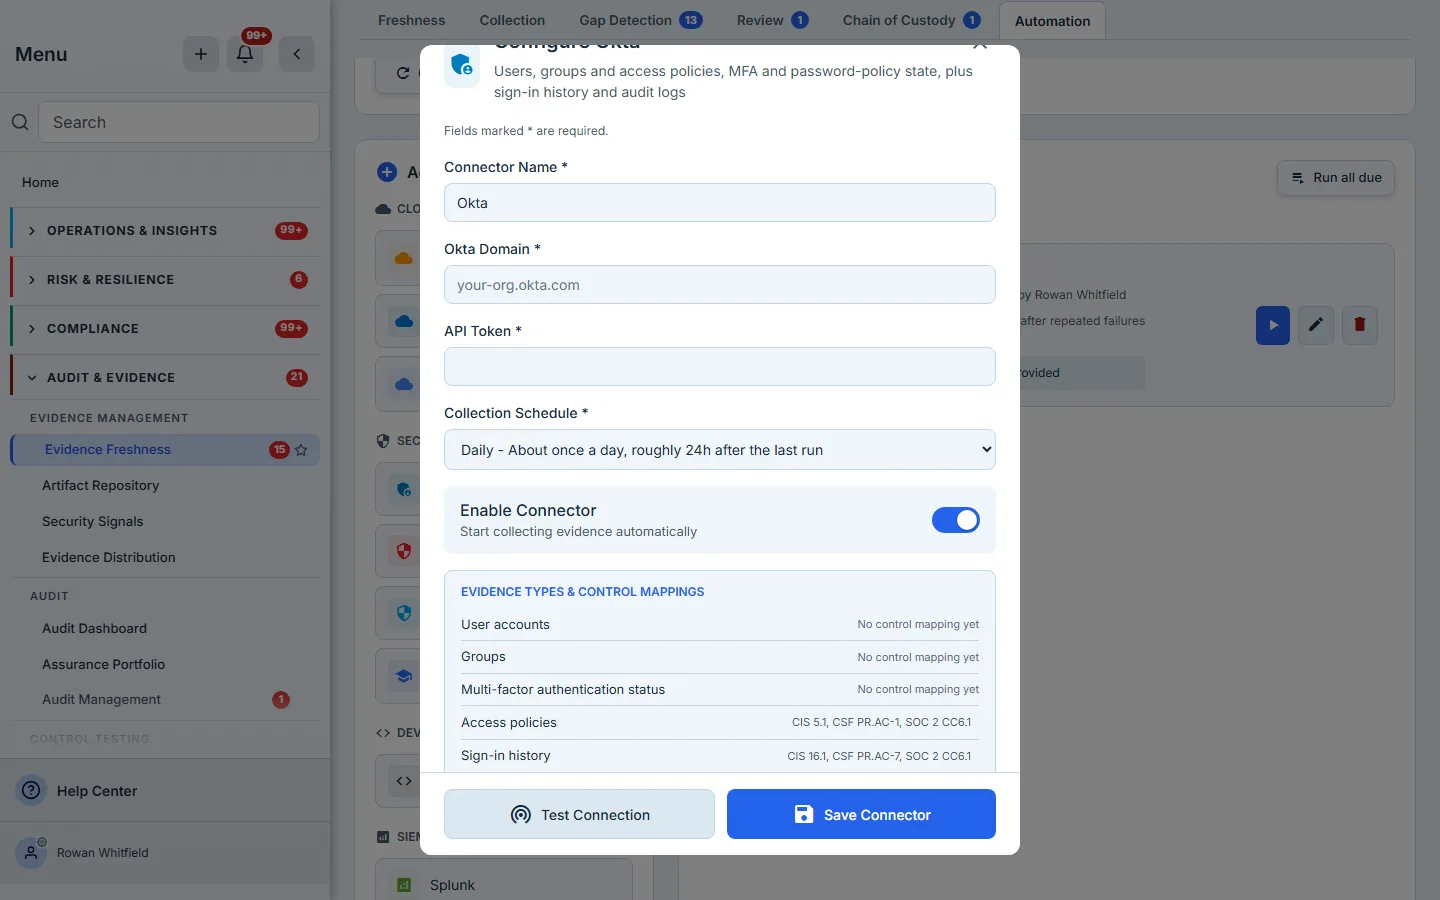
Talarity’s collection scheduler is interval-based, not calendar-based. “Daily” does not mean midnight UTC. It means roughly twenty-four hours after the last run, with a little jitter either way so that every organisation’s connectors do not stampede a provider at the same instant. “Weekly” is roughly seven days after the last run, not Sunday. “Monthly” is about every thirty days, not the first of the month.
The options say so in their own descriptions, and the distinction matters the moment you need evidence to exist before a date. If your audit needs a fresh access review in hand on the last day of the quarter, do not set Monthly and assume it lands on the 1st — it lands thirty-ish days after whenever it last ran, which drifts. Set a shorter cadence, or press Run when you need it.
Each configured connector’s card carries the resolved timestamp — Next sync ~ followed by a
date and time — so you do not have to do the interval arithmetic yourself. The tilde is doing
real work: the jitter above, plus a due sweep that runs every fifteen minutes, means the run
lands shortly after that stamp rather than on it. A connector set to Manual Only shows nothing
there, because it has no scheduled run to miss.
When to pick which. Hourly is for signals you would act on the same day — failed authentications, new critical findings. Daily is the sensible default for identity and access evidence, where a day-old picture is still a true picture. Weekly and Monthly suit configuration state that genuinely does not move much, and cost you less provider rate limit. Manual Only never runs on its own, and it is the right choice more often than people expect: a connector against a system with a punishing API quota, or one you only want exercised during fieldwork, belongs here.
What it will collect
The Evidence Types panel lists what this connector will fetch, in the platform’s own words rather than the engine’s identifiers.
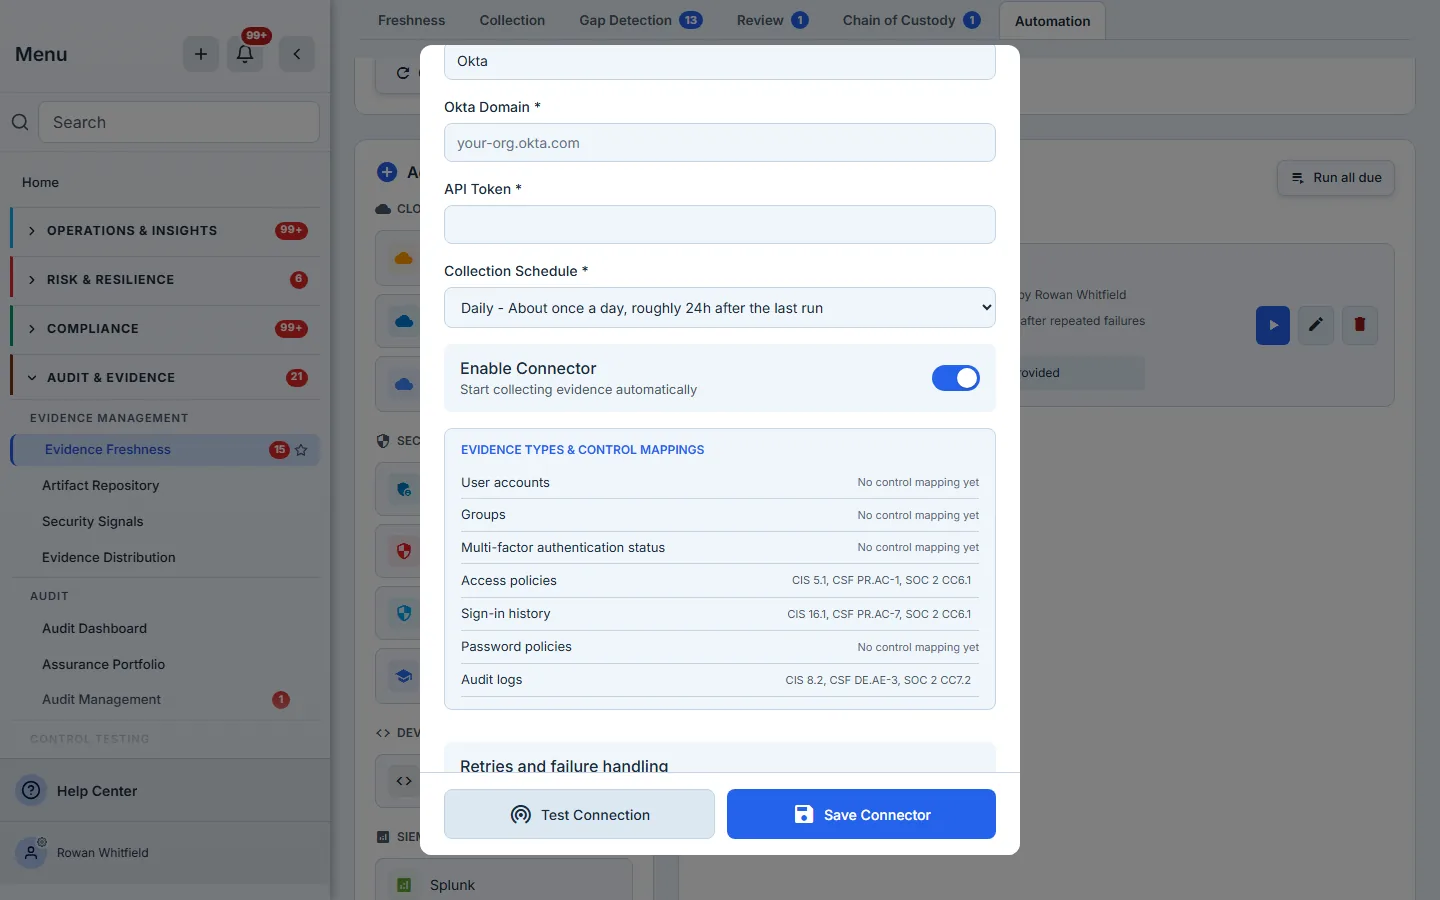
Where a type carries a framework mapping, every reference is named beside it — Okta’s audit-log
type reads CIS 8.2, CSF DE.AE-3, SOC 2 CC7.2 in full. There is no truncation and no “+1”: an
earlier version of this panel stopped at two references and offered a +1 with no way to reach the
third, which is not a useful answer for someone deciding whether a control is covered. There are at
most three and each is a handful of characters, so the abbreviation bought nothing and was removed.
A type with no mapping says so, in words — No control mapping yet — rather than rendering an empty space. That distinction is the point: “this type maps to no control” and “this type maps to controls we are not showing you” would otherwise look identical, and they are different answers to the question a compliance officer opened the dialog to ask. The panel only calls itself “Control Mappings” when at least one mapping actually rendered.
Below it, the page states its own retry behaviour.
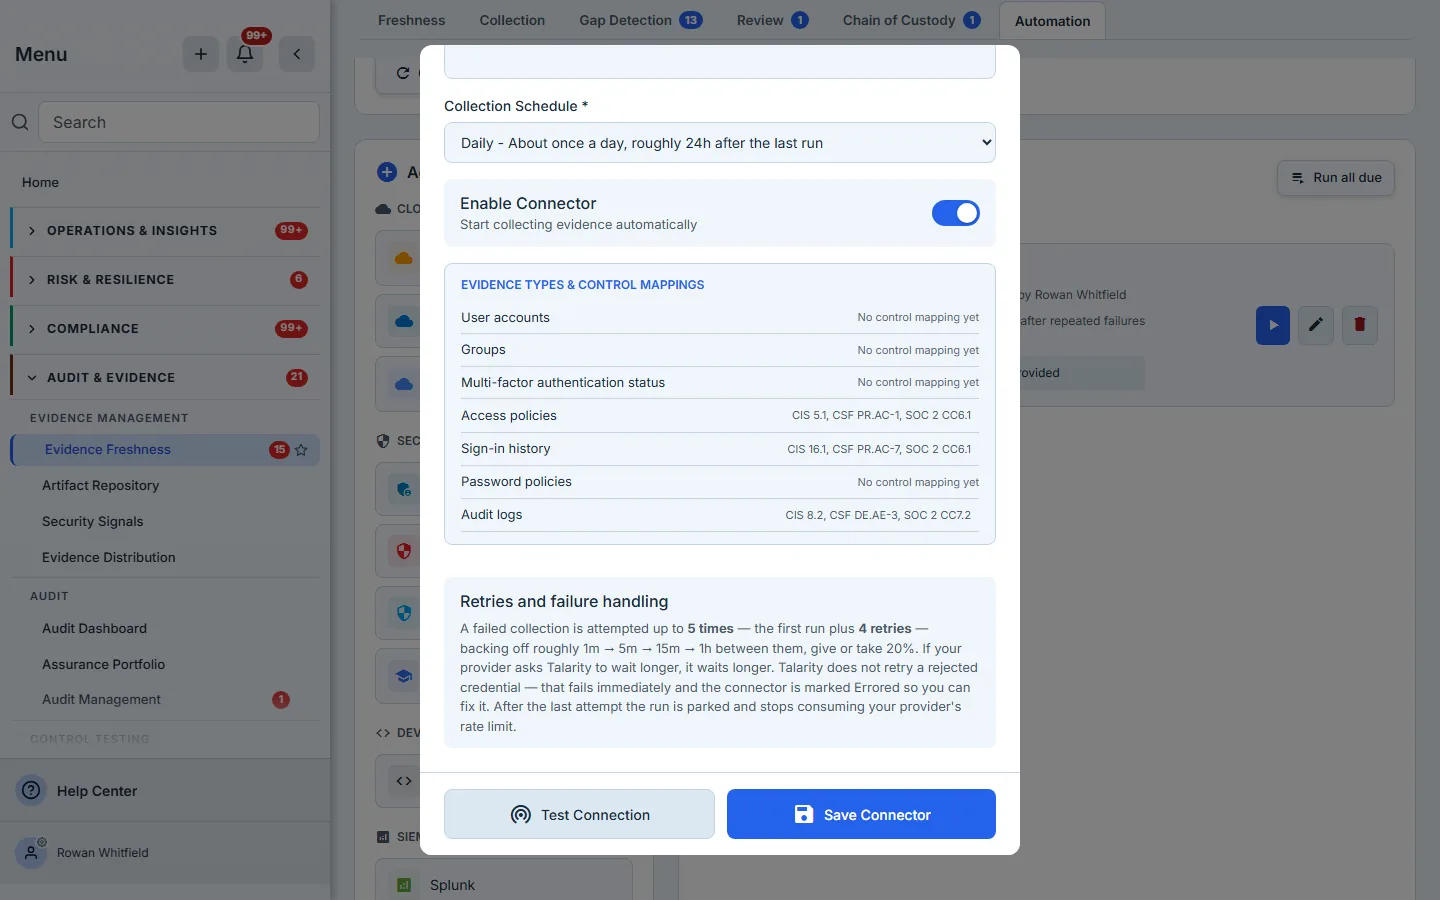
A failed collection is attempted up to five times — the first run plus four retries — backing off roughly 1m, 5m, 15m and 1h between them, give or take twenty percent. If your provider asks Talarity to wait longer, it waits longer. A rejected credential is not retried: that fails immediately and the connector is marked Errored, because retrying a wrong token four times only burns your rate limit to arrive at the same answer.
Test Connection is a real request
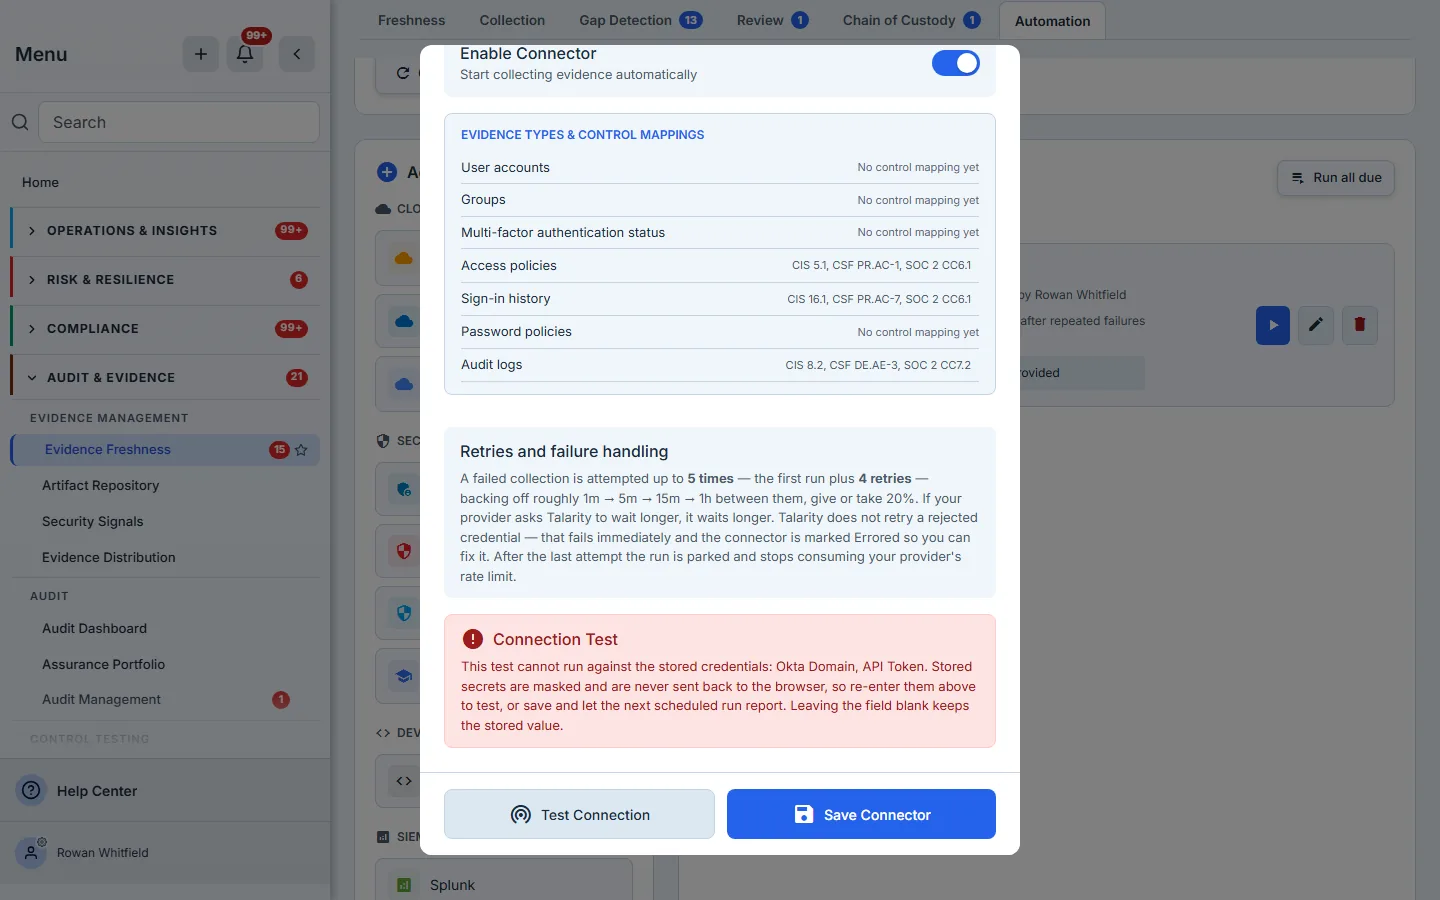
Test Connection makes a live round trip to the provider. It is not a format check on the credential you just typed, and its result is worth reading rather than glancing at: when Okta rejects a token, the page says the credentials were rejected and tells you to check that the token is correct, has not expired, and carries the permissions the connector needs. It never echoes credential material back at you.
Press it before saving. A connector that saves cleanly is not a connector that works.
On a connector you are editing rather than creating, Test says so instead of guessing. The stored secret is never sent back to your browser, so there is nothing for the test to sign with — rather than run a request without it and report the provider’s rejection, the page names the credential it cannot reach and tells you to re-enter it or let the next scheduled run report. A test that cannot run is worth more than a failure that means nothing.
Reading a failure
This is the part of the page that earns its place, and it is easiest to see on a connector that is genuinely broken.
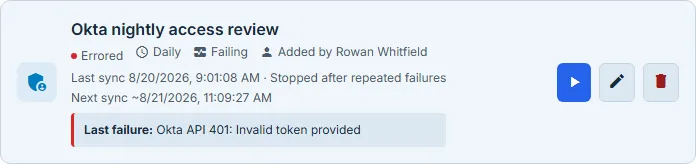
The card distinguishes three things that are easy to conflate. Status is what the connector is
— Active, Paused, Errored, or Setup incomplete. Note that errored is a state the
runtime moves a connector into by itself when a credential is rejected; it is not somebody
switching it off, and the card never reports a connector that stopped on its own as one a
colleague turned off.
Health is how recent runs have gone. Last failure quotes the provider verbatim — in the
frame above, Okta API 401: Invalid token provided, which is the sentence that tells you the fix
is a new token rather than a network problem.
Pressing Run on a connector in that state gets you a refusal, not a silent no-op.
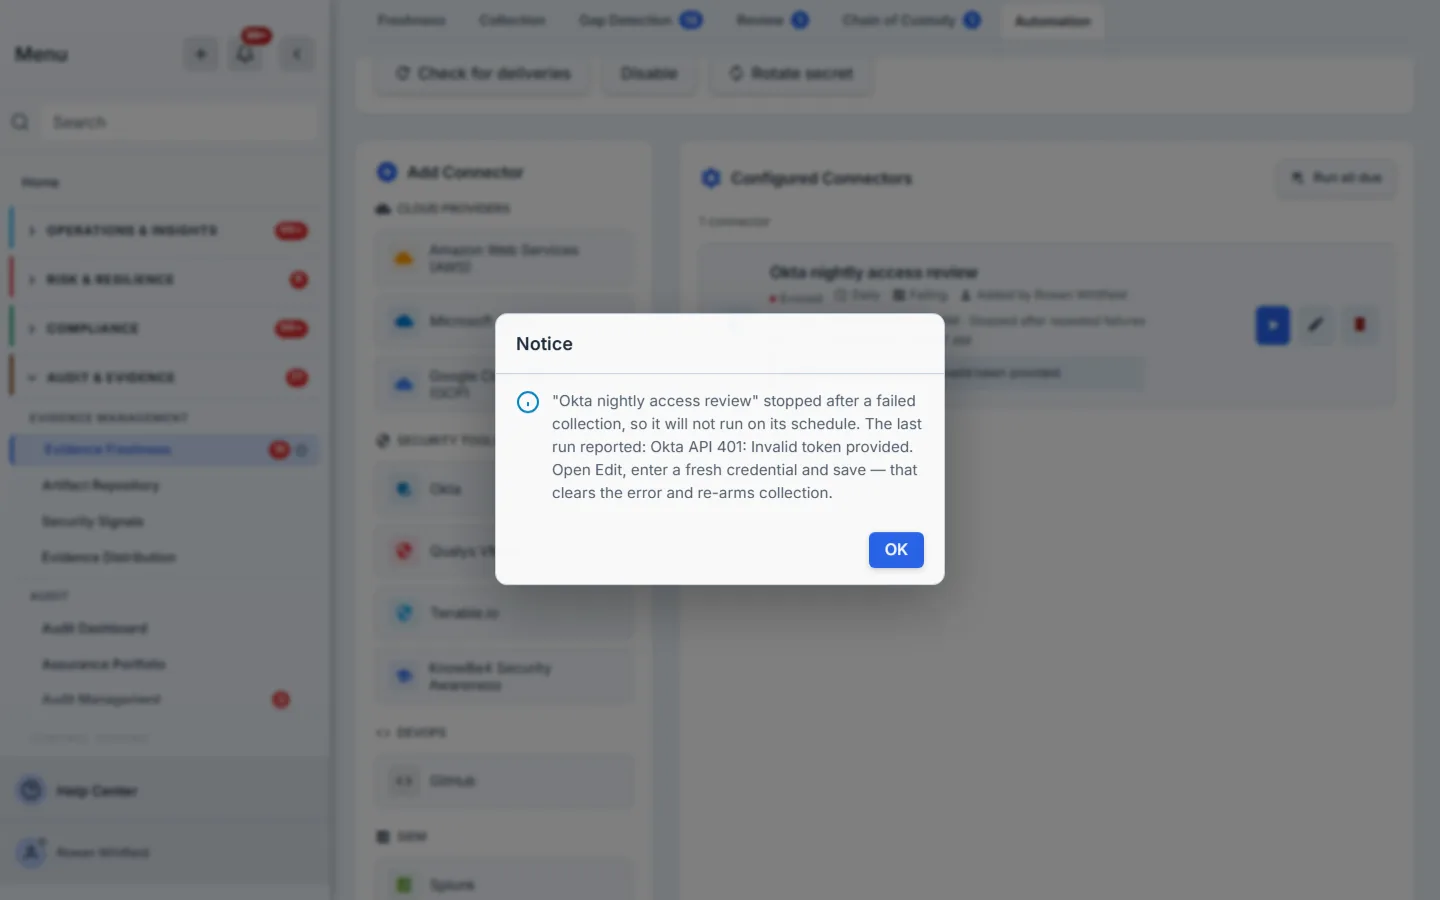
The refusal names the connector, states why, and gives you a next step you can actually take.
Editing an existing connector is where one behaviour surprises people.
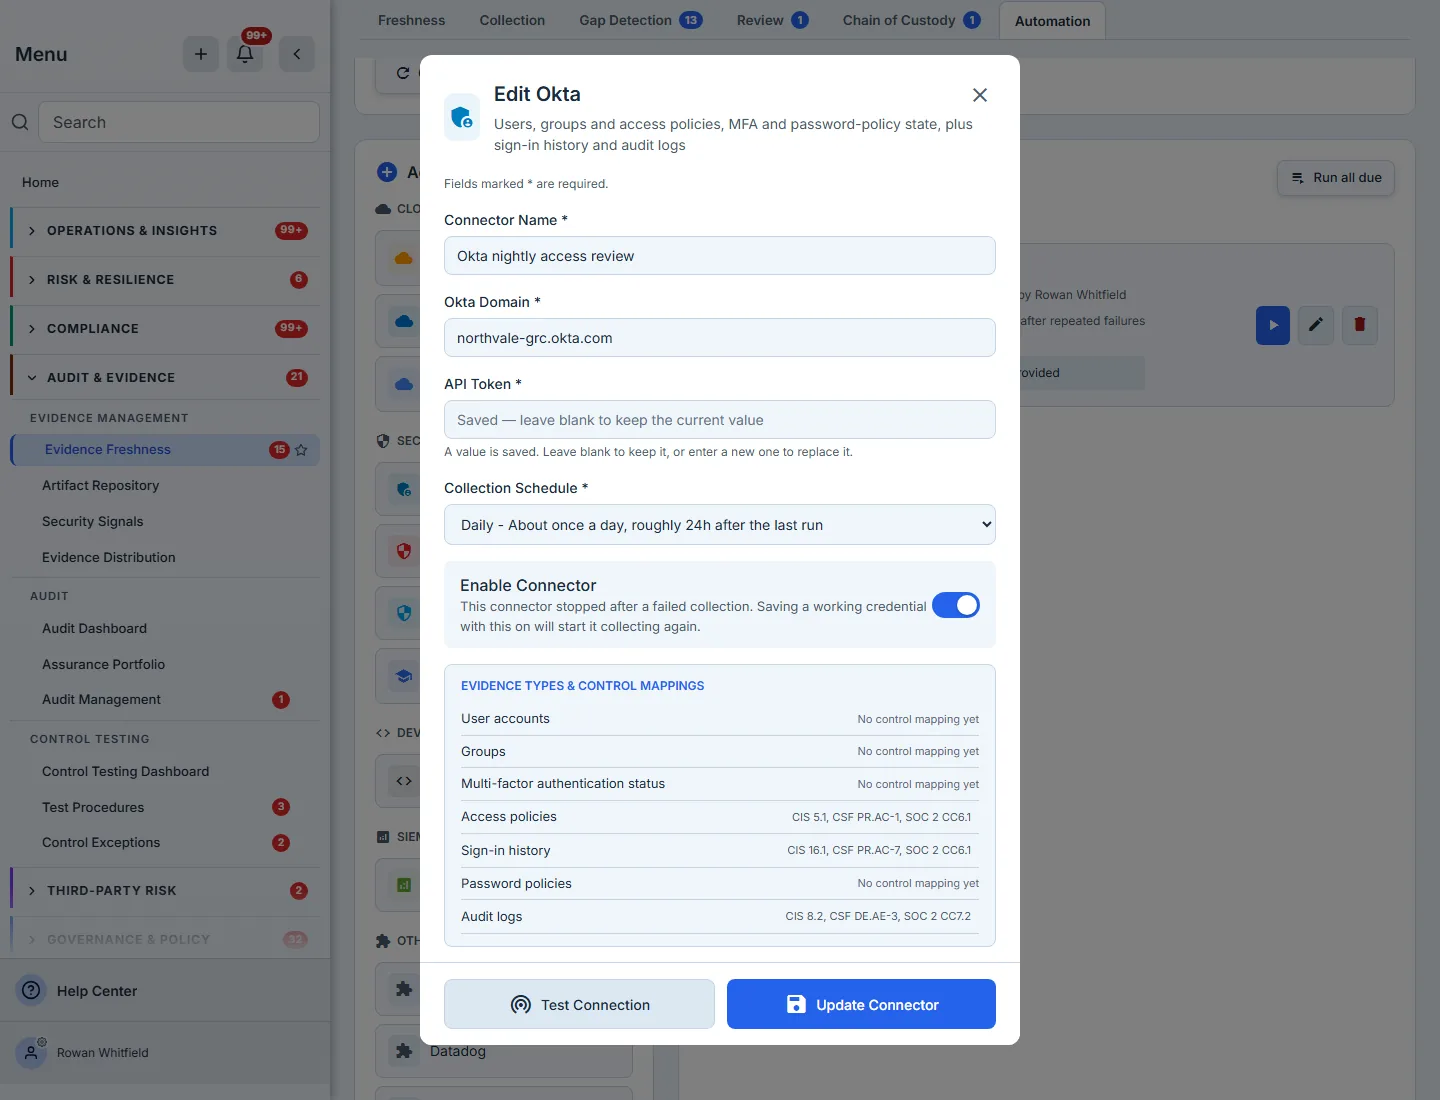
The stored credential is never sent back to your browser. The field is therefore empty, not filled with dots — it carries the placeholder “Saved — leave blank to keep the current value” and, beneath it, “A value is saved. Leave blank to keep it, or enter a new one to replace it.” An empty box on a saved connector means the secret is safe on the server, not that it has been lost. So you can rename a connector or change its cadence without re-pasting a token, and you rotate a credential by typing a new one into the empty field. Credentials are held encrypted at rest under an envelope key; the plaintext is not in the row.
One thing to expect before you go looking for it: the modal is titled for the connector type, not for the instance. Click a row you named Okta nightly access review and the dialog is headed Edit Okta — the name you gave it is the first field in the form, not the heading above it. Nothing is wrong; the form is the same one the type uses for every instance of it.
Door two: a webhook anything can push to
Everything above needs Talarity to support your vendor. The inbound webhook does not.
Before it is switched on, the card explains itself and offers one control — Enable / Generate secret — under a line saying that generating a signing secret produces an endpoint URL you can POST evidence to. (There is no screenshot of that state here: this organisation’s endpoint has been live since the feature was tested on it, and the only way to photograph the first-run card would be to destroy the configuration the rest of this article depends on.)
Generating the secret is one press, and the secret is shown exactly once.
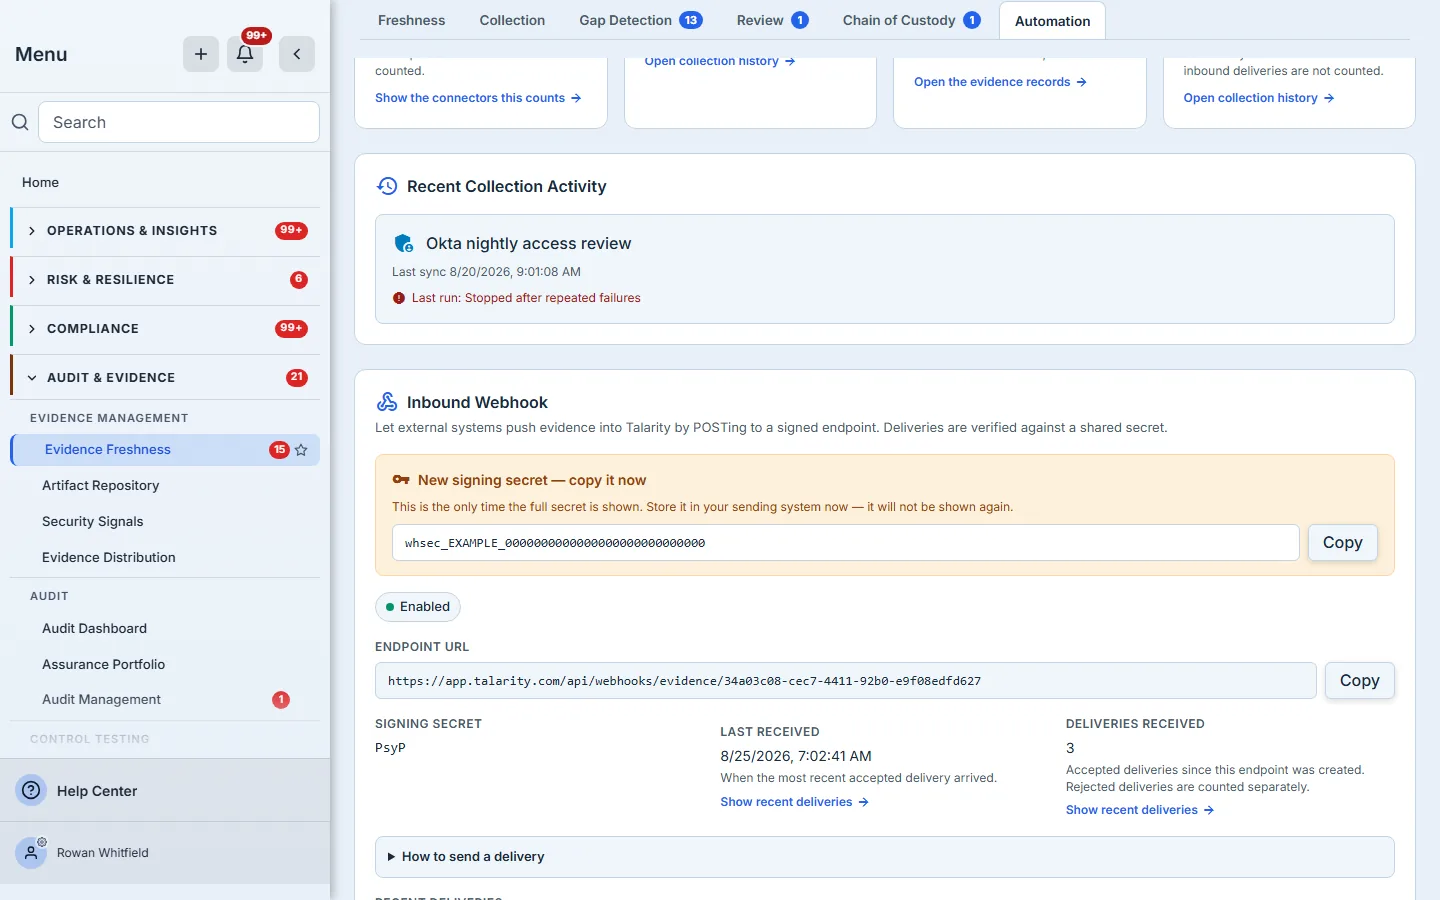
Copy it into your sending system now. After a reload only a four-character hint remains, which is enough to tell two secrets apart and not enough to sign anything. The copy control reports what actually happened rather than always claiming success — if the browser refuses clipboard access it says so and selects the value for you to copy by hand, which matters for a value you get one look at.
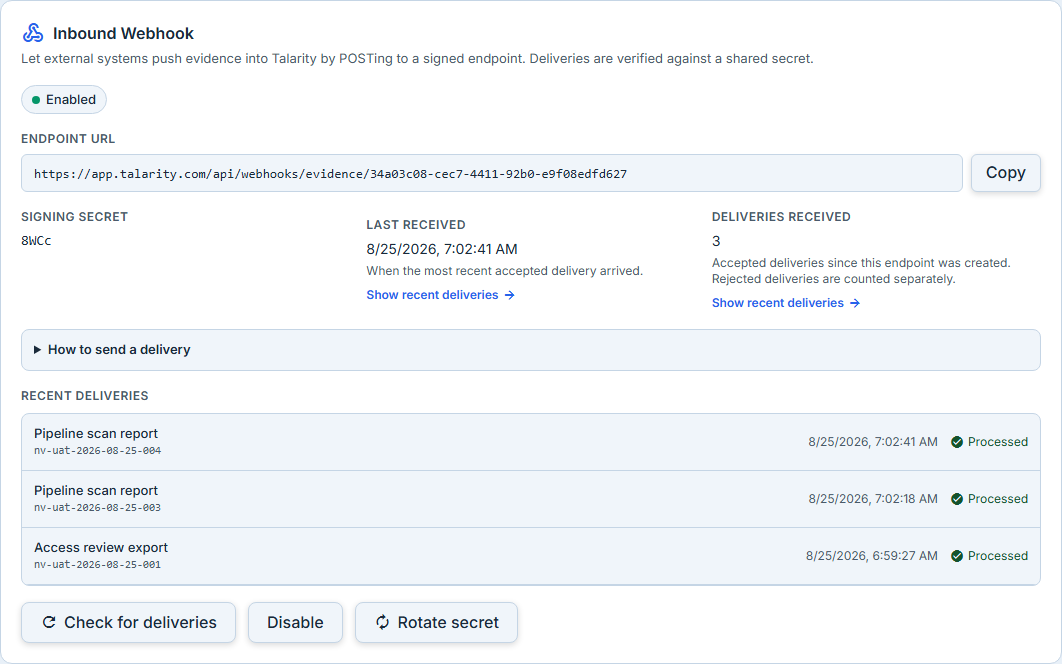
The endpoint URL is absolute and ready to paste into an external system. Beside it sit the secret hint, when a delivery last arrived, and how many have been accepted.
The contract
The card documents how to sign a delivery, which is the difference between an endpoint you can use and one you can only look at.
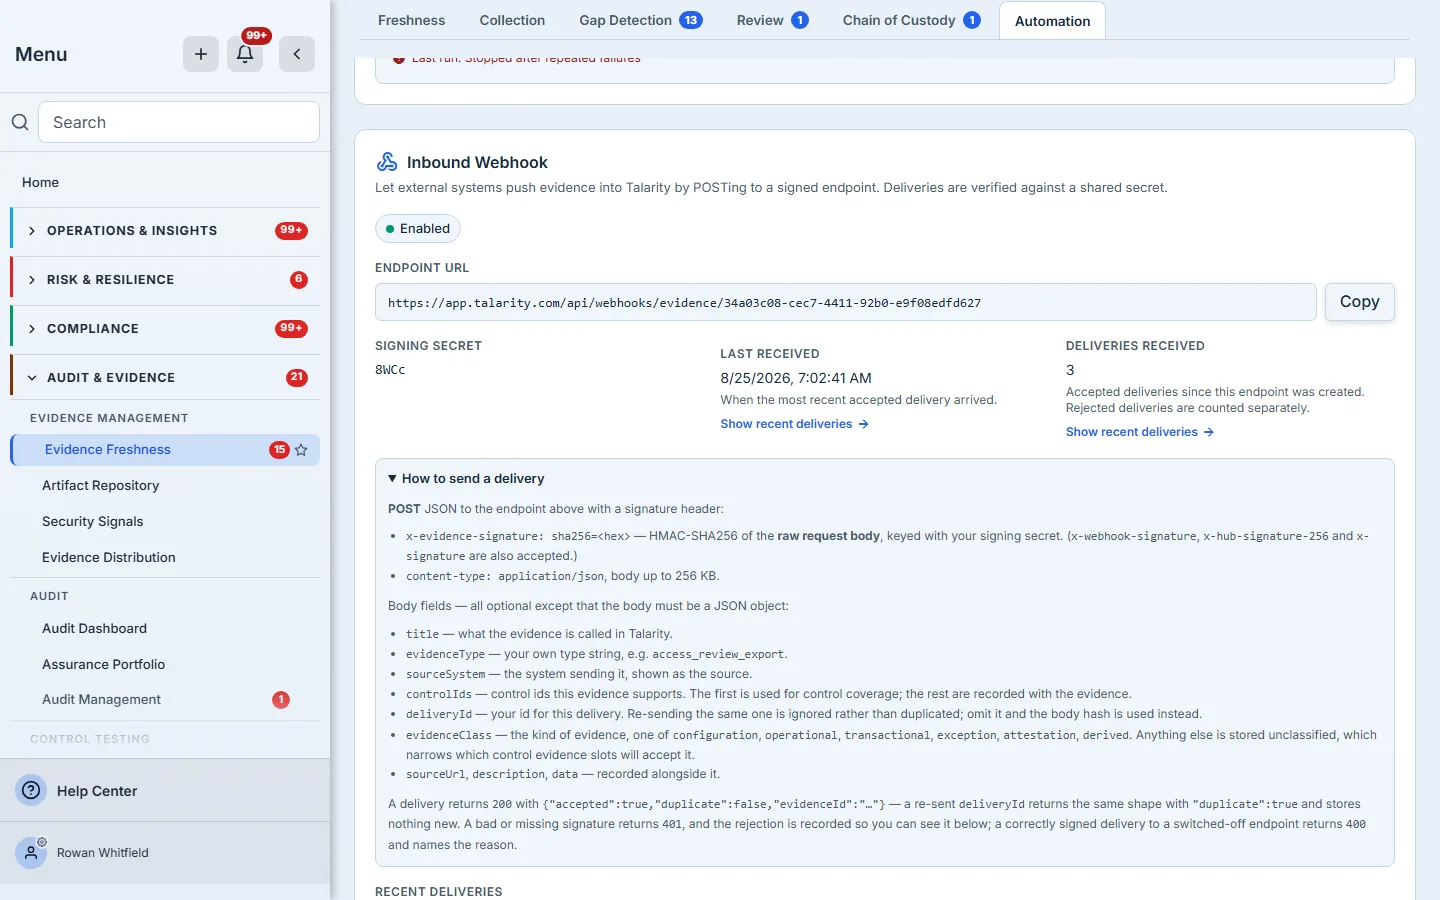
POST JSON with an x-evidence-signature: sha256=<hex> header, computed as HMAC-SHA256 of the raw
request body keyed with your signing secret. Sign the bytes you send, not a re-serialised copy of
them — that is the single most common way a first integration fails. Bodies go up to 256 KB;
this endpoint takes evidence metadata, not file contents.
Every body field is optional so long as the body is a JSON object, and six of them earn their keep:
title— what the evidence is called in Talarity.evidenceType— your own type string for what this is. It becomes the event type shown in the deliveries list; omit it and every row readsevidence.evidenceClass— the platform’s own vocabulary for the KIND of evidence: one ofconfiguration,operational,transactional,exception,attestationorderived. Anything outside that list is treated as if you had sent nothing, and the record is stored unclassified — which narrows which control slots will accept it. The card lists the six values beside the endpoint.sourceSystem— the system sending it, which becomes the source shown on the record.controlIds— the controls this evidence supports. Send the one that matters first: the first id is what control coverage is evaluated against, and the rest are recorded alongside the evidence rather than counted.deliveryId— your id for this delivery. Re-sending the same one is ignored rather than duplicated, which means a retrying pipeline is safe by construction. Omit it and the body hash is used instead, so byte-identical replays still collapse.
A delivery returns 200 with {"accepted":true,"duplicate":false,"evidenceId":"ce_…"}. Read
duplicate if you are building the retry loop described above: a re-sent deliveryId comes back
200 with "duplicate":true and nothing new stored, which is a success rather than a rejection.
A bad or missing signature returns 401 — and, against an endpoint that exists, the rejection is
recorded rather than discarded. The refusal increments a counter and stores the reason and the
time, which the page surfaces as a Rejected deliveries panel beneath the recent ones. That is
the difference between debugging a rotated secret in ten seconds and not knowing anything went
wrong at all: to the sender, a 401 it is not watching for is indistinguishable from silence, and
this is the surface that breaks the tie.
A request to an organisation that has no endpoint configured also returns 401, and that one
stores nothing — it is refused before any configuration is loaded, so there is nothing to record it
against. The two are deliberately identical on the wire: every refusal an unauthenticated caller
can provoke looks the same, so probing the endpoint tells you nothing about which organisations
exist or which have this switched on. The signature is checked before anything else, so a
switched-off endpoint is not a different answer to a bad signature either — an unsigned caller
still gets the same 401. Only a caller who already holds the signing secret gets the real
reason — 400, naming the webhook as disabled — and that is exactly the caller who needs to know.
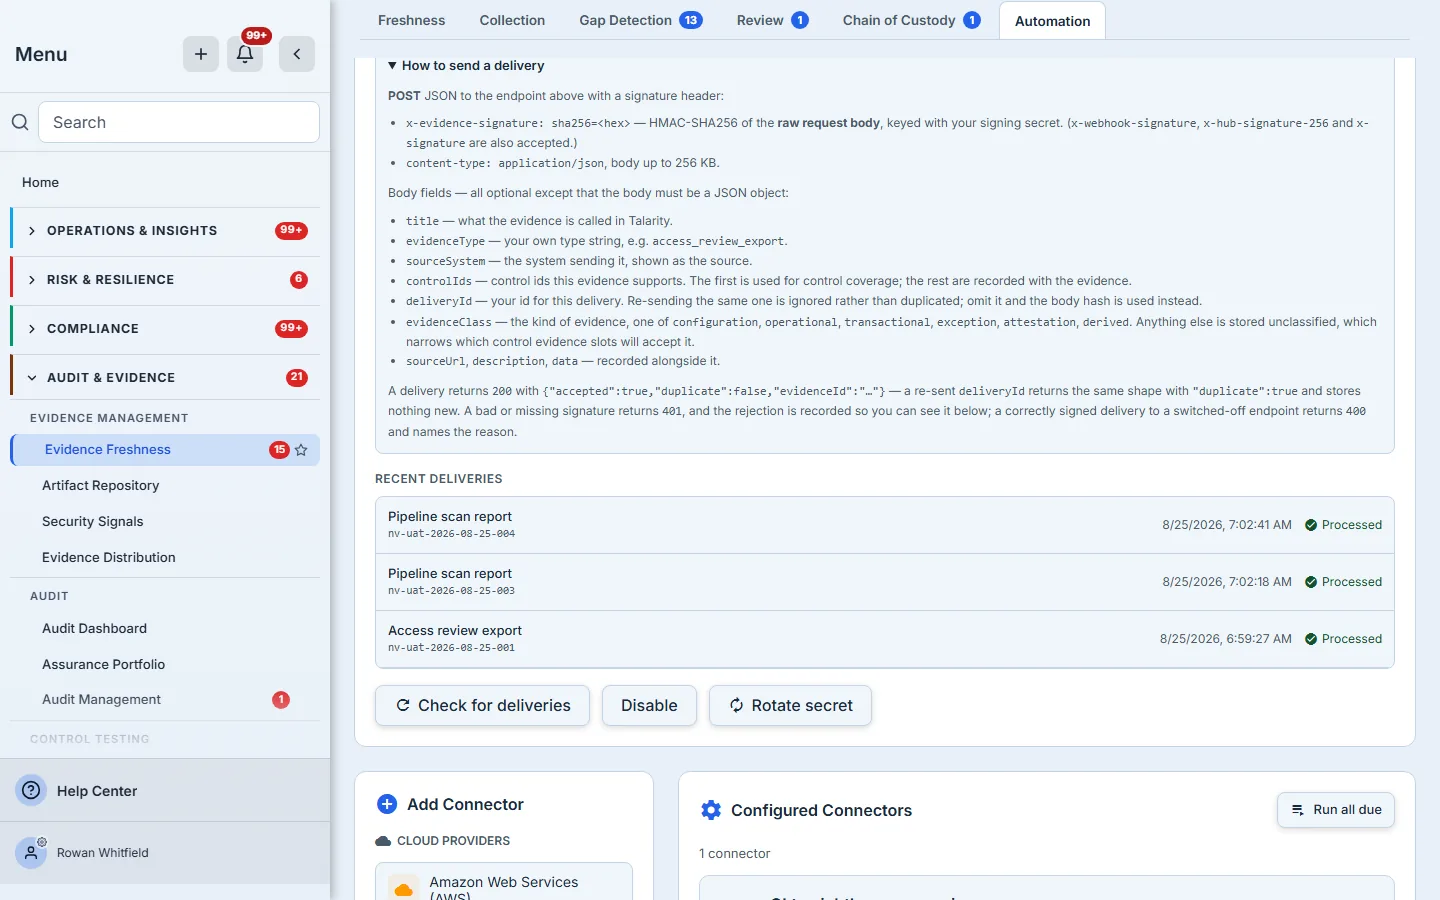
Accepted deliveries appear in the list underneath, most recent first, each showing the event type you sent and your own delivery id. It shows the ten most recent.
The card does not poll, so press Check for deliveries after sending one — the count, the last-received time and the list all re-read together. That matters most on your very first delivery, when a stale zero is easy to misread as a rejection.
Rotating the secret
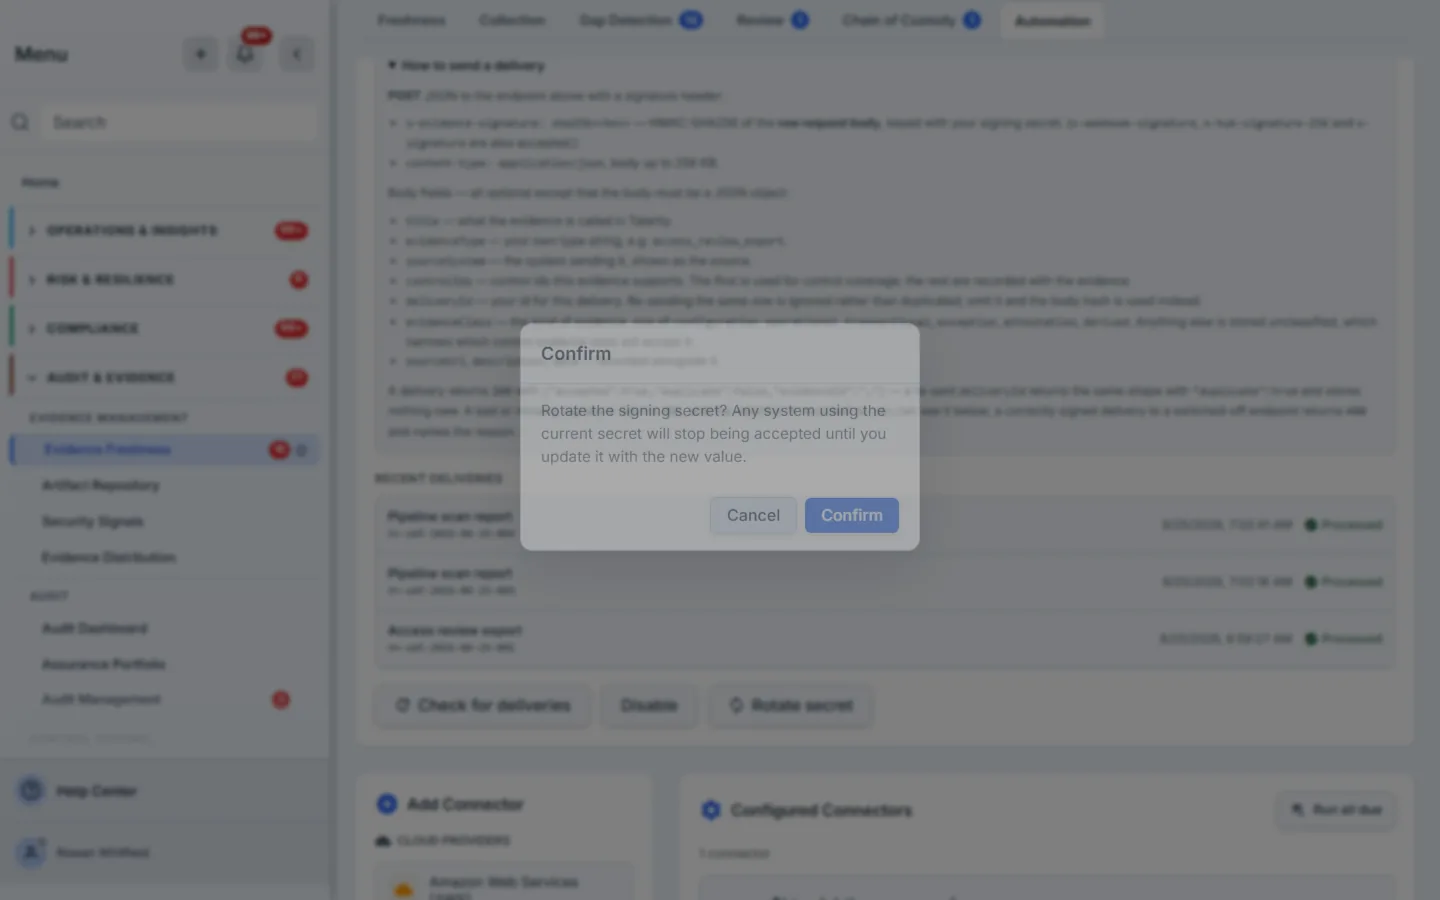
Rotation is immediate and total: the moment a new secret is minted, the previous one starts
returning 401. The confirmation says so, and it is not a formality — if three pipelines push into
this endpoint, all three stop until each has the new value. Rotate when a secret may have leaked or
when someone with access to it leaves, and stage the change so the sending systems are updated in
the same maintenance window.
Beside the rotate control is a Disable button, and that is the switch behind the 400 above:
disabling leaves the endpoint and its secret intact but stops accepting deliveries, so a correctly
signed sender is told the webhook is off rather than that its credentials are wrong. It is the
right control for pausing a noisy pipeline, because re-enabling does not invalidate anything the
senders already hold — unlike rotation, which invalidates all of it.
Where pushed evidence goes
A delivery writes an evidence record and files it alongside connector-collected evidence, so it
appears on Evidence Review’s Collected Evidence tab with your sourceSystem as the source. Your
configured compliance reviewers are notified that it arrived, and the notification links to the
page that holds it.
Pushed evidence does reset the freshness clock. Drift detection reads collected evidence by control and takes the most recent collection date, so a delivery naming a control clears an evidence-missing signal and restarts the staleness window immediately. It also advances the control’s own last-verified date — and it does that for every control the delivery names, not just the first one. A push is a first-class collection here, not a lesser one.
That matters because the next paragraph is about a limit that sounds like the same thing and is not. Freshness and coverage are two different questions, and a delivery answers them over different sets: it refreshes every control you name, but only one of them can be credited.
Two things decide whether a delivery counts towards a control, and both are easy to miss. Only the
first id in controlIds is evaluated for coverage — the rest are stored against the record and
will refresh those controls’ dates, but they do not fill an evidence slot. And if you send no
evidenceClass, the
evidence is stored unclassified, which satisfies only those evidence slots that do not name a
class — so a control expecting an attestation will not accept an unclassified record. Send the
class, and put the control that matters first.
What this page does not do
It does not assign anyone. Each card names the person who added the connector, which is a record the system kept rather than a decision anyone made: there is no assignee, and a failing connector raises no work item. Someone is told — an hourly sweep notifies organisation administrators once per unhealthy episode, and a related signal drives the integrations nav badge — but a notification is not an assignment, and on a large estate the follow-up is worth someone’s calendar rather than someone’s inbox.
The two are close but not identical, which is worth knowing if you are deciding what to watch. The badge counts connectors that are outright failing (or have failed three times in a row); the hourly sweep also fires on degraded health and on evidence that has gone overdue. So the sweep will tell you about a connector the badge is still counting as fine.
It does not show run history. The last failure is here; the per-run detail is on Evidence Review.
There is no export and no duplicate. Connectors are created one at a time, and a second instance of the same provider is a fresh form rather than a copy of the first. There is one bulk action — Run all due beside the Configured Connectors heading — and it does exactly what its name says: it queues a collection for every connector that is active, on a schedule, and due now, skipping paused, manual and not-yet-due ones, and it tells you how many that was. If nothing was due it says so rather than claiming to have queued something. The audit trail is the export you do have: creating, editing and deleting a connector each land in the organisation’s audit log, which does export.
Recent Collection Activity shows five connectors, most recently run first, and Recent deliveries the ten most recent deliveries. Note the different units: the activity panel is one card per connector showing that connector’s last run, not one card per run. Neither of those two panels paginates — but each now says what it covers when there is more than it is showing, so a five-tile panel over a thirty-connector estate no longer reads as the whole picture. They are a pulse, not a log.
The Configured Connectors list itself is the exception, and it is worth knowing about before your estate grows into it: that one does paginate, with a pager beneath the cards once there is more than a page of them, and it tells you which range you are looking at. Once you have eight or more connectors it also grows a search box and an Active only filter. The stat cards are not purely decorative either — Active Connectors is clickable, and it drops you into the list with that filter already applied.
Where it fits
Evidence Automation is the front of the chain. What it collects feeds the Evidence Collection dashboard and Evidence Review, contributes to connector-coverage widgets and the security-signal surfaces, and shows up in the nav badge when something needs attention. The configuration lives here; the consequences live everywhere else.
It is also a credential-administration surface, and it is gated as one. A standard user cannot reach this page, list connectors, rotate the signing secret or delete a connector — those are administrator actions, enforced at the page gate rather than only hidden in the interface.
What you walk away with
- A connector is Talarity polling your system on a cadence; the inbound webhook is your system pushing into Talarity whenever it likes. The second door works for tools no connector will ever support.
- The scheduler is interval-based. “Daily” means about twenty-four hours after the last run, not midnight — do not plan a quarter-end deadline around it.
- Test Connection is a real request to the provider, and a clean save is not a working connector.
- Status, health and last failure are three different facts, and the card keeps them apart. Errored is something the runtime decided, not something a colleague did.
- Sign the raw bytes you send, and send a
deliveryId— that makes a retrying pipeline idempotent for free. - The signing secret is shown once, and rotating it breaks every sender until each is updated.