A connector that collects evidence on a schedule is only half a control. The other half is knowing whether it worked — and if it did not, why.
That is what /app/evidence/review is for. It holds what the collectors brought back, the
schedules that produce it, the sixteen connectors available to run, and the history of every
collection run with the reason any of them failed.
It is worth saying plainly what this page is not, because its name has misled people inside this company as well as outside it. Nothing is approved or rejected here. There is no review queue, no reviewer assignment, no pending state. Evidence submitted by a person for human judgement goes through Smart Evidence Intake; this page is about what machines collected while nobody was watching.
What the four tabs answer
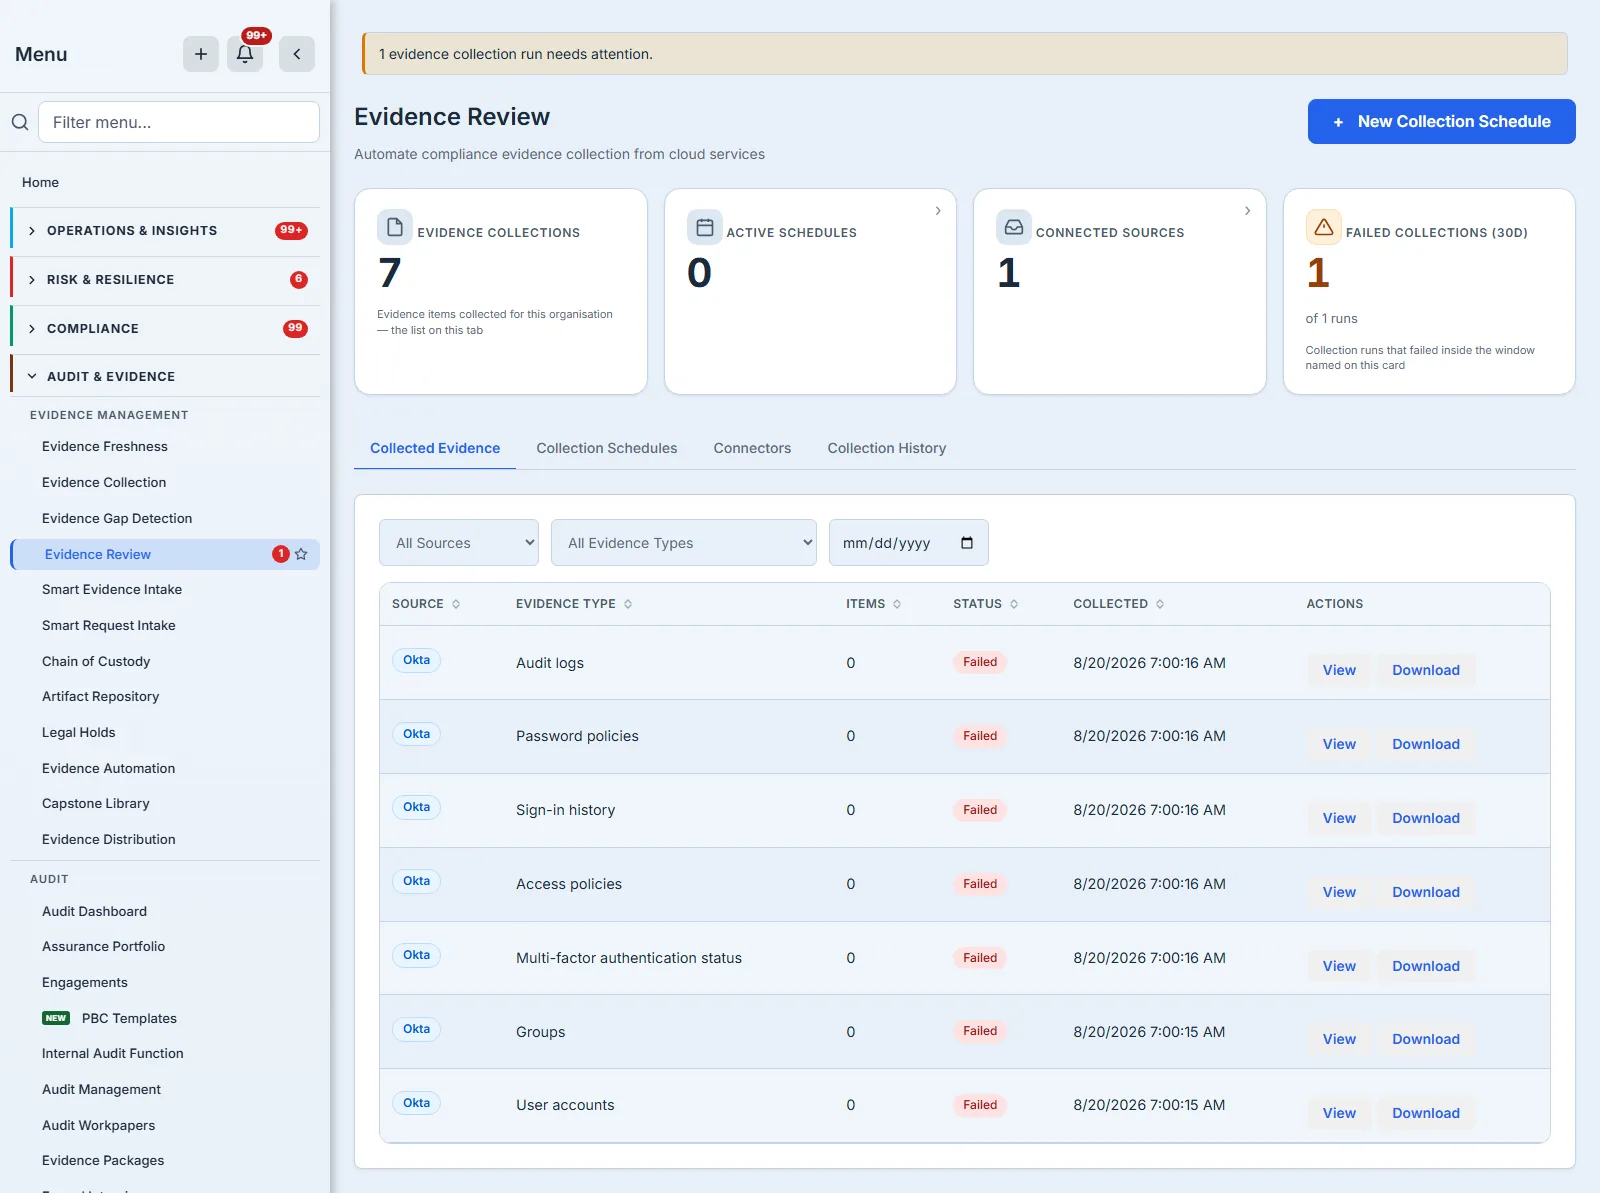
Collected Evidence lists one row per evidence type a run attempted, with the connector that produced it, an item count and a status. Read that carefully: a row here records an attempt, not a success. A run that failed still writes a row per type, with no items and a Failed status — which is why this tab can hold seven entries on an organisation that has collected nothing at all.
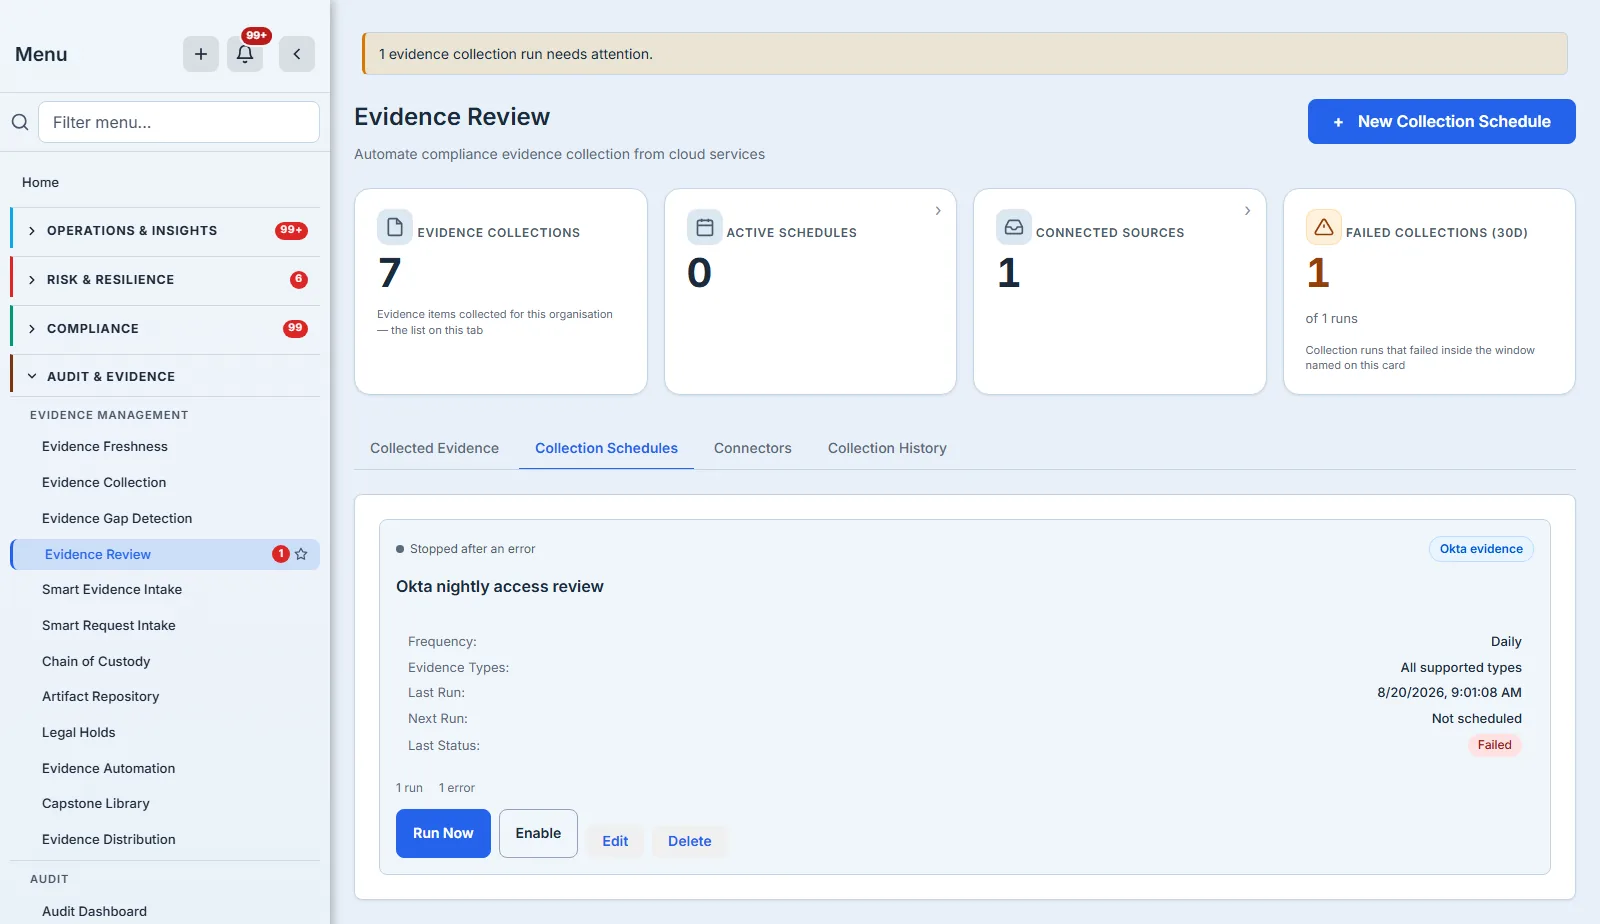
Collection Schedules lists every schedule and the state it is in: a connector, a cadence, the evidence types it gathers, when it last ran, and whether it is running at all — a schedule can be active, paused by someone, or stopped by the runtime after a failure, and those are three different answers to “why is this not collecting?”.
Connectors lists all sixteen the engine can drive, marking which you have configured.
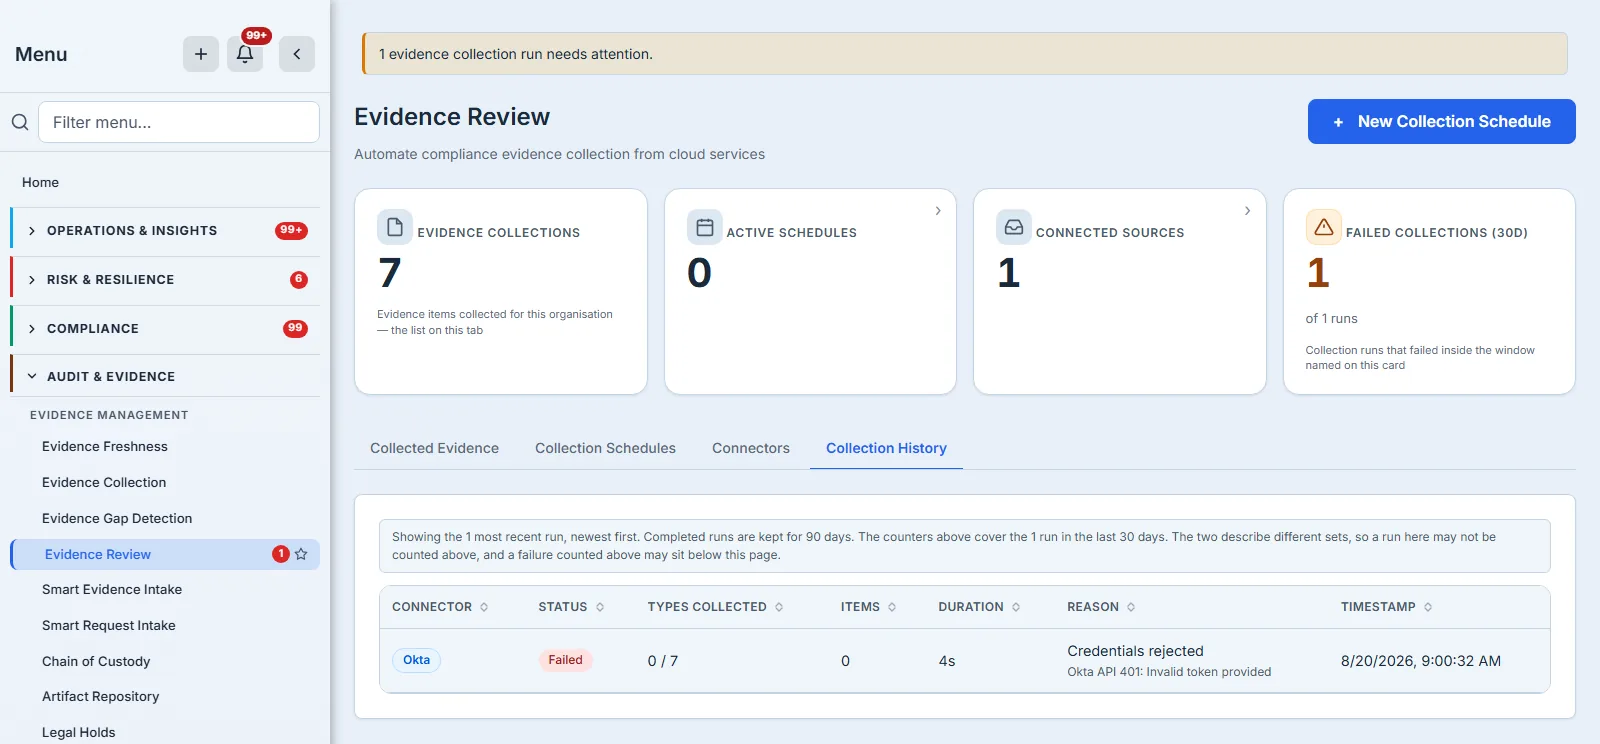
Collection History is the one most people need and the one most people miss. Every time a schedule fires, the runtime records a run — what it collected, how many items, how long it took, and, if it did not succeed, the classified reason.
Reading a failure
A failed collection is not a mystery to be solved by guesswork. The runtime classifies every failure into one of six causes — credentials rejected, rate limited by the provider, timed out, a network error, a configuration error, or unclassified — and Collection History shows that classification in its own column, with the provider’s own message beneath it.
That distinction is the whole point, because the status alone never names the cause. Expired credentials and a rate-limited provider both stop a collection and both need completely different responses — one needs a new key, the other needs a slower cadence or a wait — and no badge can tell you which you are looking at. A row that says only “Failed” sends you looking in the wrong place.
Read the status and the reason together, because “Partial” is a real answer. A single schedule collects several evidence types — an Okta schedule can pull user accounts, groups, MFA status, sign-in history and more — and they are fetched independently. Partial means the run came back with some of what it asked for, and it has two quite different causes: one of the evidence types failed while the others succeeded, or the provider capped how much it would return in a single call and the collection was truncated. The first leaves a type missing; the second leaves a type incomplete.
Two columns tell you which one you have. Types Collected short of what the schedule asks for means a type failed; Items lower than the source really holds means a collection was truncated. Be aware that this is an inference you are making on the page’s behalf: the run record stores which individual evidence type failed and which was capped, and this table shows you the tally rather than the breakdown. Until it shows the breakdown, the two columns above are how you get at it. Partial is the status worth reacting to — Failed is obvious and Success needs nothing, while Partial is the one that quietly leaves a gap, and citing a truncated collection as full coverage is a specific way to be wrong in front of an auditor.
A failed run usually retries itself, and the status says whether it still is. “Retrying after failure” means the runtime intends to try again and the problem may resolve without you; “Failed” means it has stopped, and nothing further will happen until someone acts. That distinction is worth more than it looks, because it decides whether a failure is yours to chase this morning. It also interacts with the reason: a rate-limited provider is exactly the case where waiting works, and a rejected credential is exactly the case where it never will — so the runtime does not retry that one at all.
Three things about this table are worth knowing before you rely on it.
It shows the most recent runs; the counters above cover the last thirty days. Those are different sets, and the page says so above the table rather than leaving you to discover it. A run visible here may not be counted above, and a failure counted above may sit below the page.
Completed runs are kept for ninety days, and the evidence they collected for a year. After those windows the records are deleted — ninety days for the run log, three hundred and sixty-five for the connector-collected evidence itself — and neither is configurable per organisation. So the history is an operational record rather than a permanent archive, and the evidence behind it is not an archive either. If a run or its records matter to an audit file, get them into an evidence package before the clock runs out; a control you intend to evidence across a multi-year cycle cannot rely on the connector store to still hold last year’s proof.
A run that has not executed yet shows an em dash, not a zero. A collection queued thirty seconds ago has measured nothing; reporting “0 of 0 types” would be a confident answer to a question that has not been asked.
Setting one up
A schedule pairs a connector with a cadence and a set of evidence types. The credential fields come from the connector itself — AWS asks for an access key ID and secret with an optional region and role ARN, Okta for a domain and an API token, Microsoft 365 for nothing at all, because it authenticates through a connection you establish once under Integrations.
Required fields are marked. That sounds like a small thing and is not: a schedule saved without the credential it actually needs saves cleanly and fails on its first unattended run.
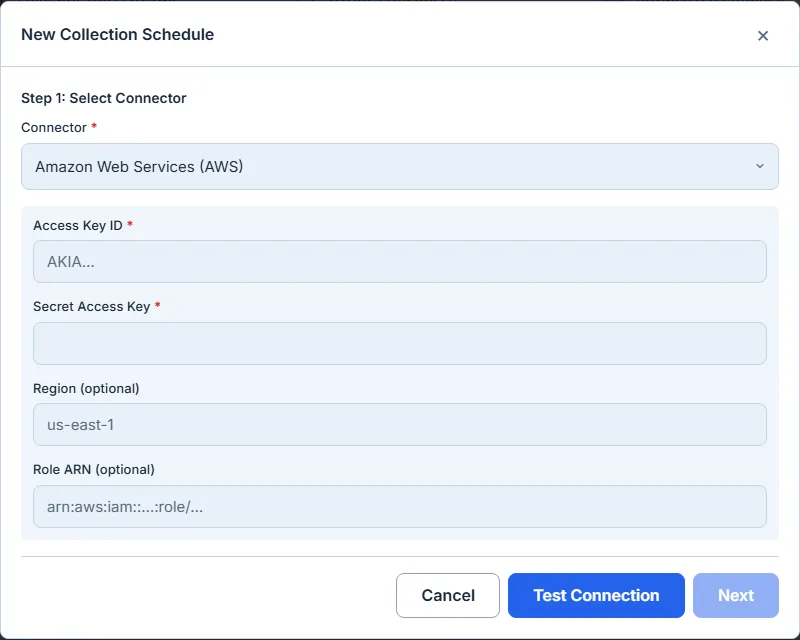
Test Connection is not optional here, and that is deliberate. The dialog will not let you continue until the test succeeds — it authenticates with what you have entered and reports the identity it resolved, and only then does it let you name the schedule and save it.
That is worth knowing because the sibling Evidence Collection page does not work this way: there, a schedule saves whether or not you test it, and a clean save is no evidence of a working connector. Two doors onto the same records, one of which checks the lock. If you create schedules from that page, press the button yourself.
Changing one
A schedule can be renamed, re-scheduled, re-scoped to different evidence types, paused, run on demand, or deleted. Editing opens the same dialog with the schedule’s current settings filled in, including the evidence types it already collects.
Credentials are the exception, and only half an exception. They are stored encrypted and are never re-displayed, so the fields come back blank rather than showing you a row of dots that means nothing. Type a new value into one and it replaces that credential; leave it blank and the stored one is kept. So an expiring API token is a rotation you perform in place, without touching anything else about the schedule.
A rotation has to pass Test Connection before it will save. Press Back, enter the new secret, test it, and only then save. Leave the fields blank and no test is asked of you, because nothing about the credential has changed — the gate is on the new value, not on the act of editing. That is deliberate: an unverified key saved here does not fail in front of you, it fails hours later on an unattended run, and the whole point of this page is that you should not have to discover a broken collector by noticing missing evidence.
That matters more than a convenience usually would, because the alternative would be deleting the schedule and creating it again — and deleting a schedule also deletes its run history. In a product whose job is provenance, that is a real cost, and there is no bulk export of the run log to take with you first: what the Collected Evidence tab can download is the individual collected records, not the history of the runs that fetched them. If you want a schedule to stop, pause it. Delete it only when you genuinely mean to discard what it has recorded.
What it asks of your permissions
One thing to check before you send someone here. Three of the four tabs — Collection Schedules, Connectors and Collection History — are served by an action gated on the permission that also lets you create schedules and rotate credentials, and that permission is granted by write access to Evidence Automation rather than by read access to this page. A group given read-only access to Evidence Review therefore sees the Collected Evidence tab and a permission error on the other three, including the run history this article is mostly about.
If the person who needs to read failures is a reviewer rather than an administrator, give them write access to Evidence Automation, or ask for the read path to be separated — the requirement is real today and worth knowing before you promise someone a read-only view of why collection failed.
Where it fits
Evidence Review sits between the collection engine and everything that consumes evidence. Connectors write here; the control-mapping bridge promotes what it can into your compliance evidence; freshness grading reads what arrives. The same connector records are visible from Evidence Automation settings and the Evidence Collection dashboard — they are one set of records, not three copies.
What you walk away with
- Evidence Review shows what was collected and why a run failed. It approves nothing — that is Smart Evidence Intake.
- A failure has a classified reason, and the reason decides what you do next.
- Partial is the status to look at hardest: Types Collected tells you a type failed, Items tells you a collection was truncated.
- The table and the counters cover different windows, and the page says so.
- A queued run reports an em dash, not a zero.
- Deleting a schedule deletes its run history with it.