Every framework that scores you expects you to know your gaps — NIST CSF 2.0 makes it explicit in GV.OV-03 (risk management performance is evaluated), ISO 27001:2022 hangs risk treatment on it in 6.1.3, and CIS Controls v8.1 is built entirely around the distance between your maturity and your Implementation Group’s bar. For a holding company, an MSP, or any organization with subsidiaries, the harder question is the portfolio one: which of your companies is furthest behind, what is failing everywhere at once, and who still hasn’t even been assessed?
Most teams answer that with a spreadsheet assembled the night before the board meeting. Talarity treats it as a live dashboard — every linked account ranked, every shared gap surfaced — and, when it’s time to put something in front of leadership or an auditor, a one-click formal report that is honest about coverage: who finished, who is overdue, and who was never assigned at all.
Who’s involved
- Program owner / vCISO — reads the enterprise ranking weekly, decides which account gets remediation attention, generates the report each quarter.
- Subsidiary admin — completes their own assessment in their own org; their released score flows into the parent’s ranking automatically.
- Compliance lead — reviews the report’s narratives, finalizes it, and owns the retention copy.
- Auditor — receives a finalized PDF whose every number traces to a specific completed assessment run, with the methodology printed inside the report itself.
What’s on the page
/app/gap-analysis has two scopes, toggled at the top of the page:
- Enterprise — the cross-company view: average score, rankings, common gaps, domain averages, and the Generate Report button.
- Linked Account — one company’s own gap list: score gauge, projections, the priority gap list with per-gap actions, and severity reclassification.
The framework selector drives both scopes — every licensed framework with gap-analysis support is listed, whether or not it has runs yet.
Step 1 — Read the enterprise ranking
Switch the scope toggle to Enterprise. The KPI band answers the four questions a program owner actually asks: portfolio average, how many accounts have a scored run, total open gaps, and the weakest account. Every card is clickable — the average drills to the rankings, total gaps drills to the common-gap list.
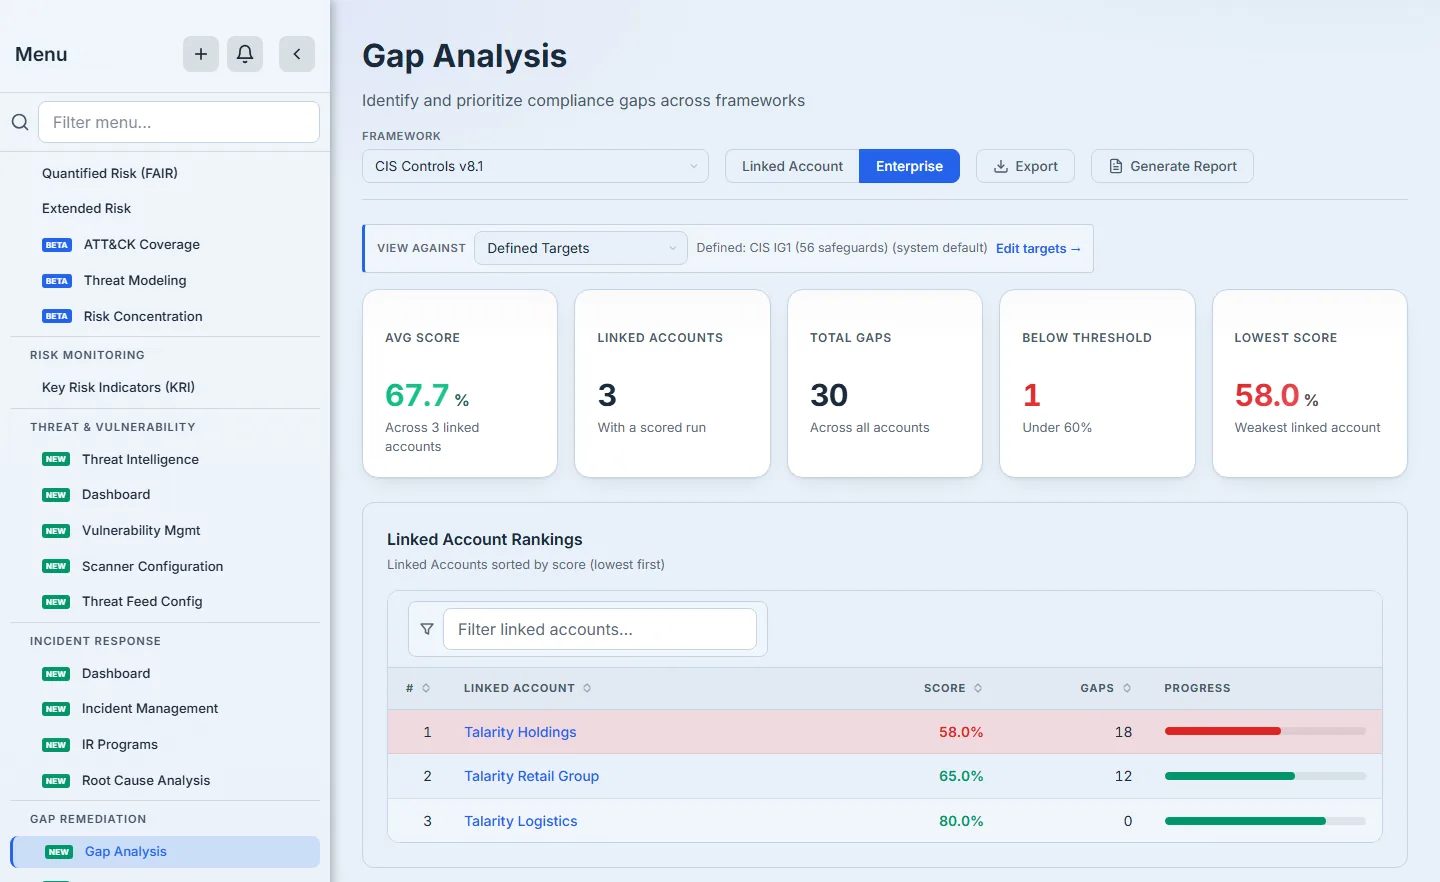
Below the cards, the Linked Account Rankings table sorts every account lowest-score-first — rank #1 is the account that needs help, not the one winning. An account below the passing threshold gets a red wash across the whole row so it can’t hide in a long list. Accounts whose data arrived through a share or subscription (rather than a direct link) carry a provenance chip — you always know why you can see a number.
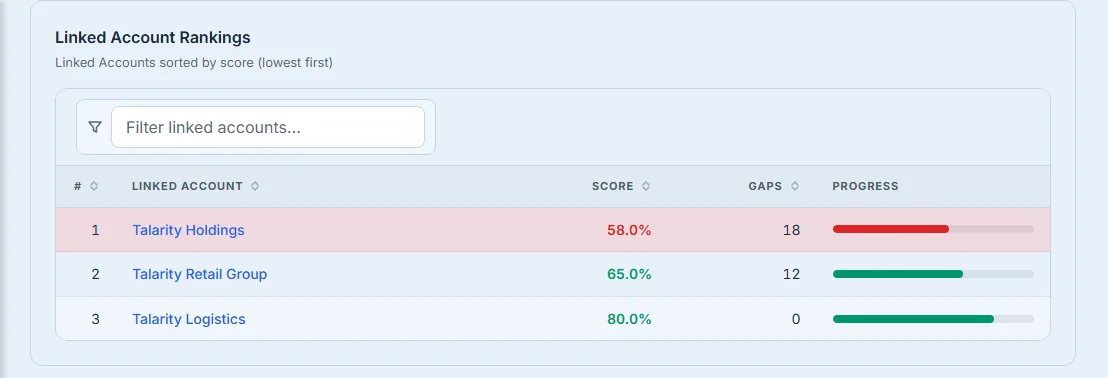
Behind the scenes, the ranking is computed server-side from each account’s own gap-analysis document and its own effective target — a subsidiary with a custom bar is scored against its bar, not a blanket org default. Accounts with a completed run but no analysis cache are flagged “needs recompute” instead of being silently dropped, and an account that has never been assessed is listed unranked — Talarity never scores absence as zero.
Step 2 — Find what’s failing everywhere at once
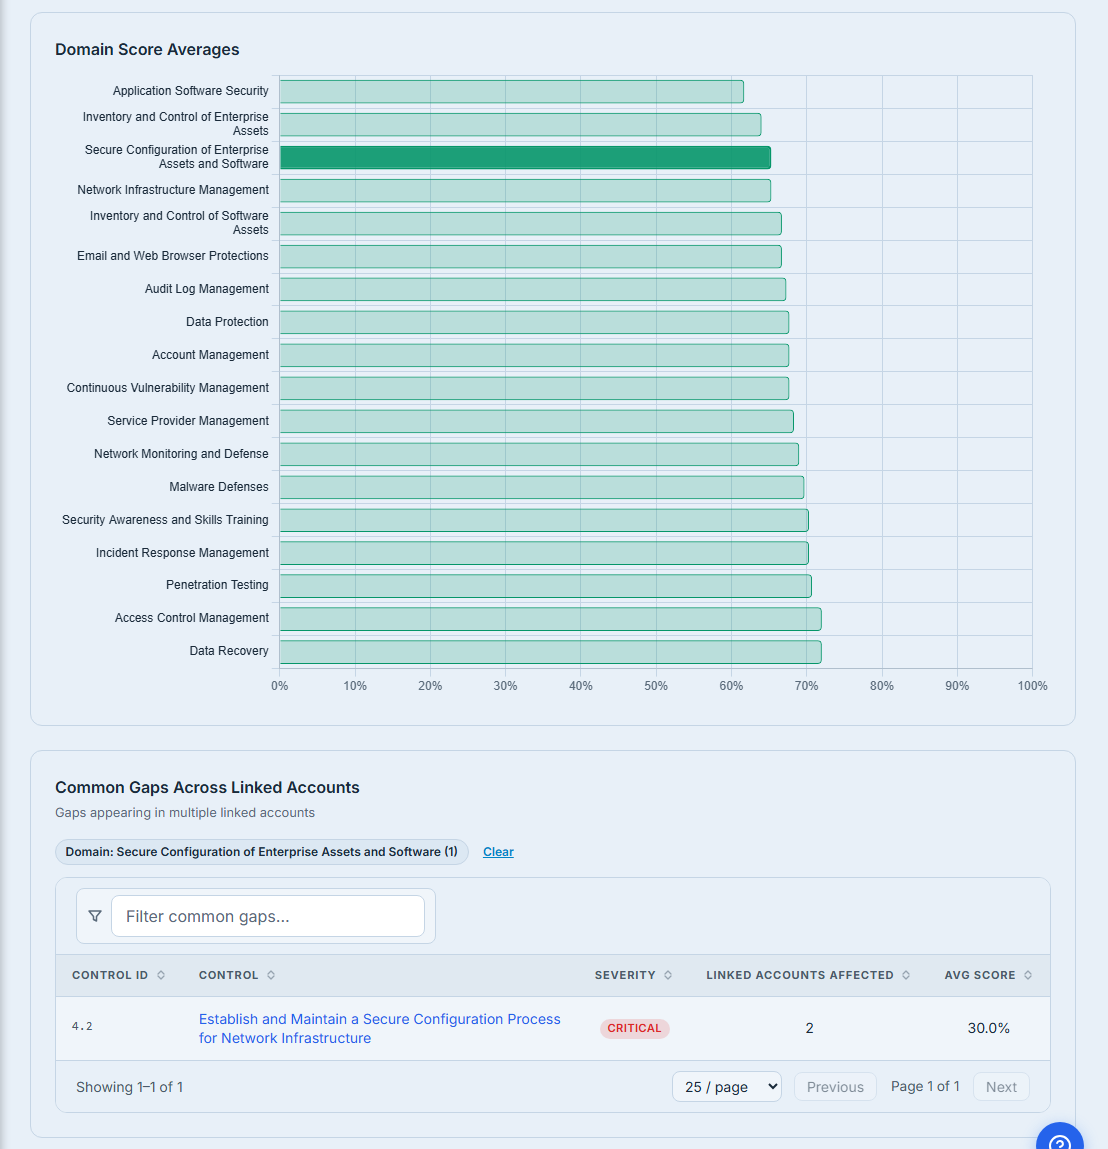
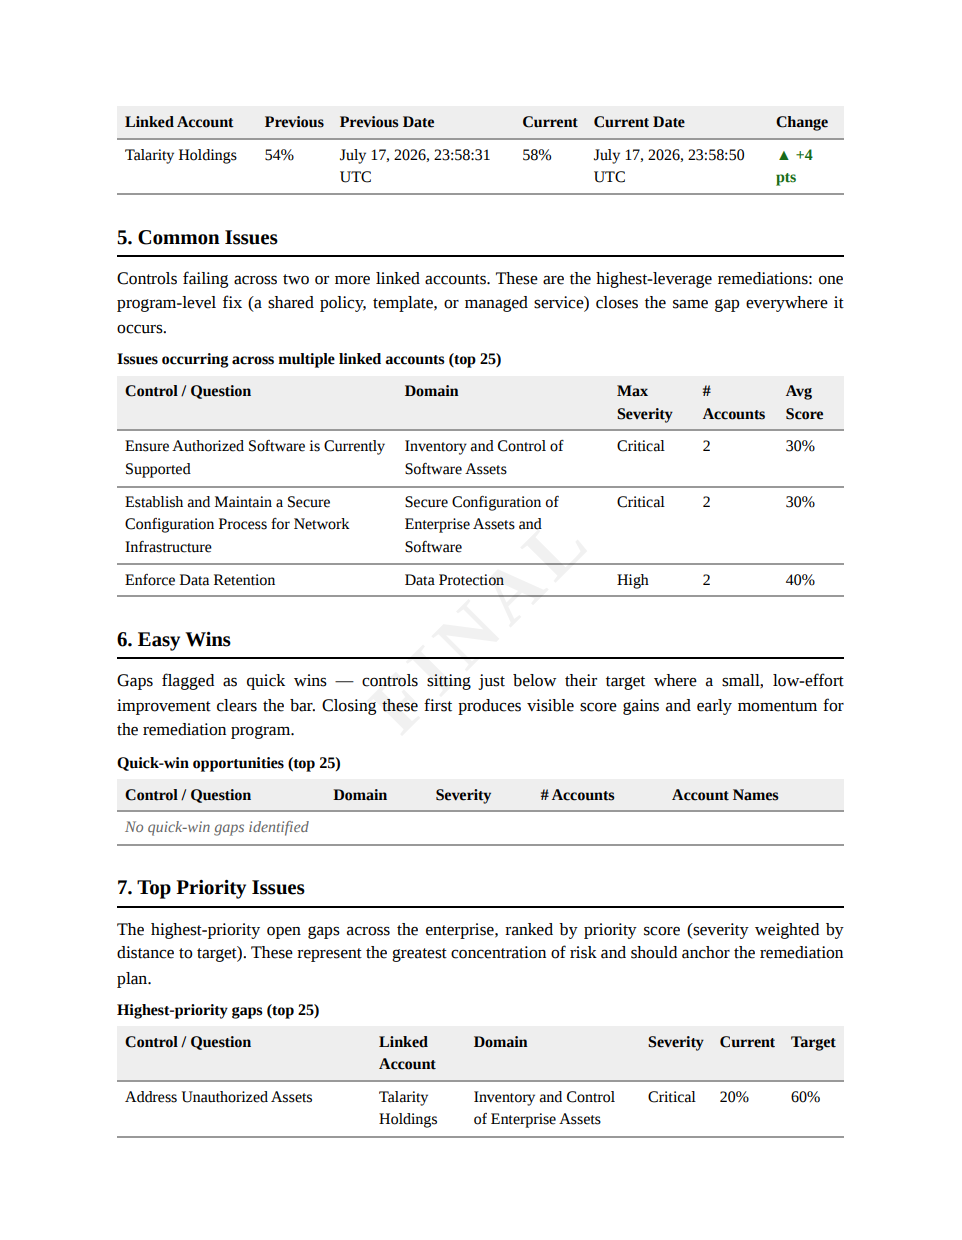
Common Gaps Across Linked Accounts lists every control failing in two or more accounts, worst average score first. These are the highest-leverage items on the page: one program-level fix — a shared policy, a common baseline, a managed service — closes the same gap in every account it touches.
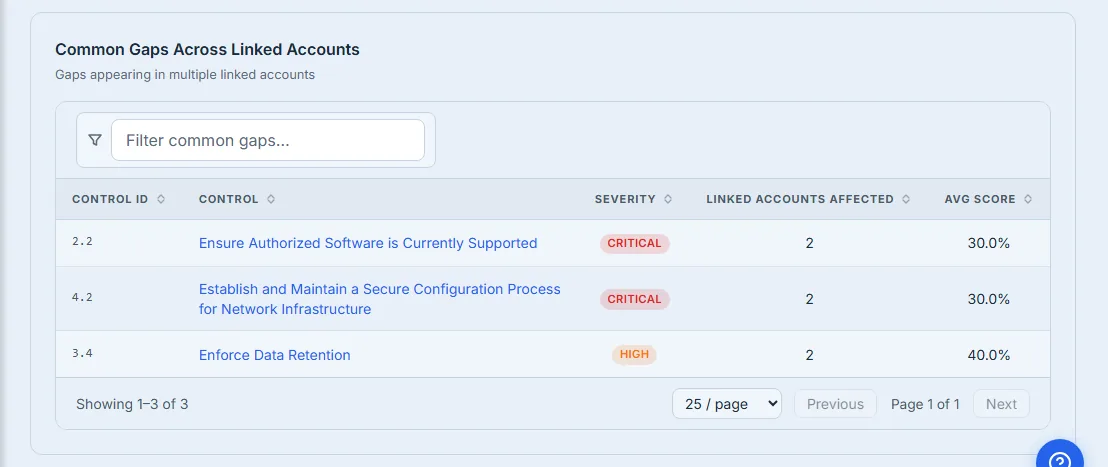
Click any row and the drill-down names the affected accounts, worst first, each with its own score on that control — so “2 accounts affected” is never a number you have to take on faith.
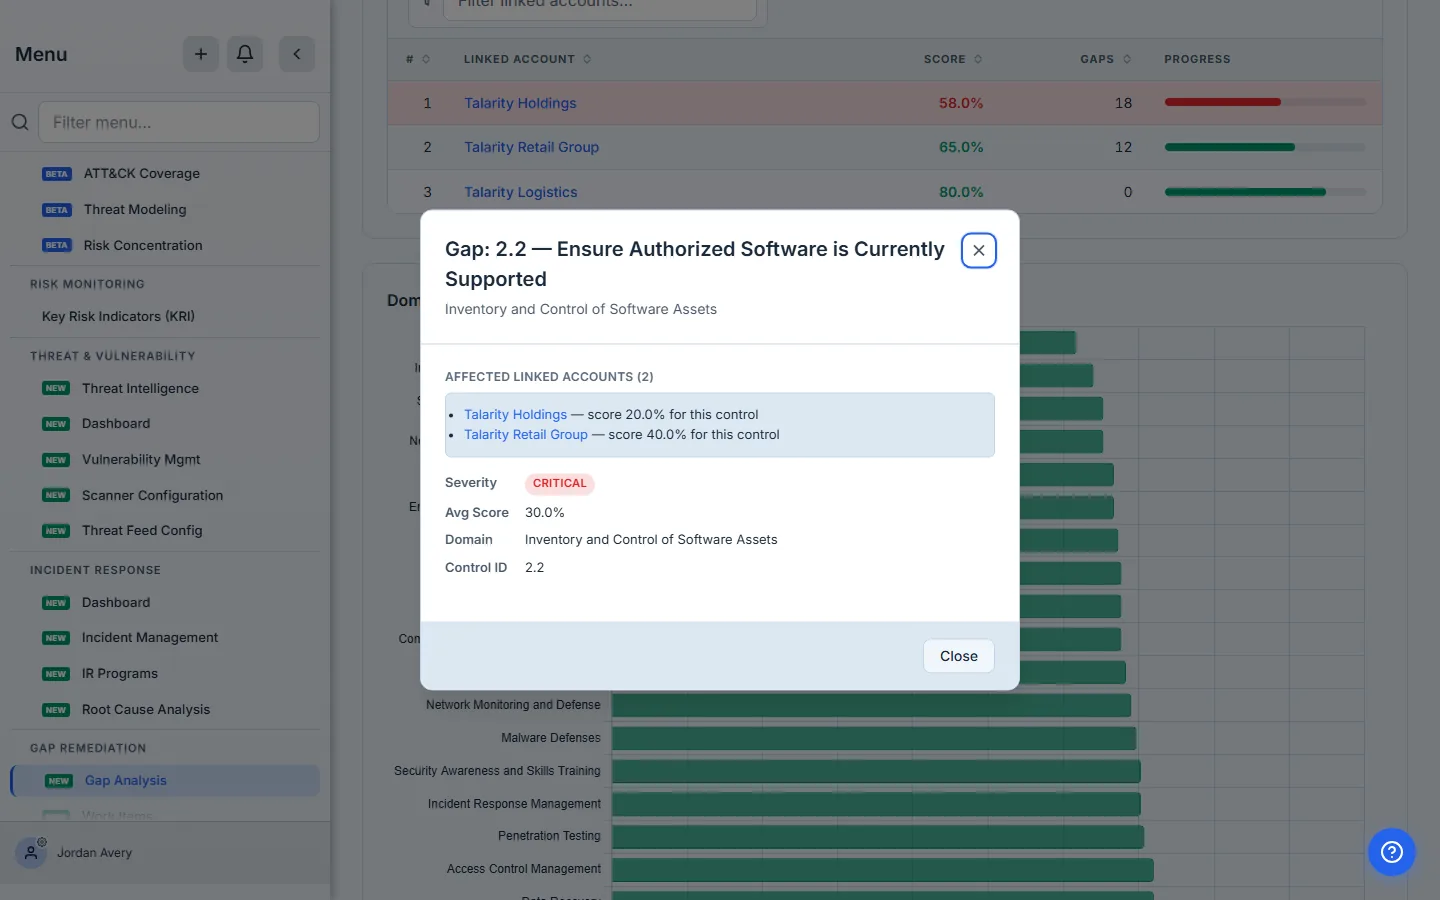
The Domain Score Averages chart works the same way: click a domain bar and the common-gap table filters to that domain, with a clearable chip showing the active filter. If a domain’s low average comes from gaps unique to a single account, the empty state says exactly that instead of showing a blank table.
Step 3 — Drill into one account
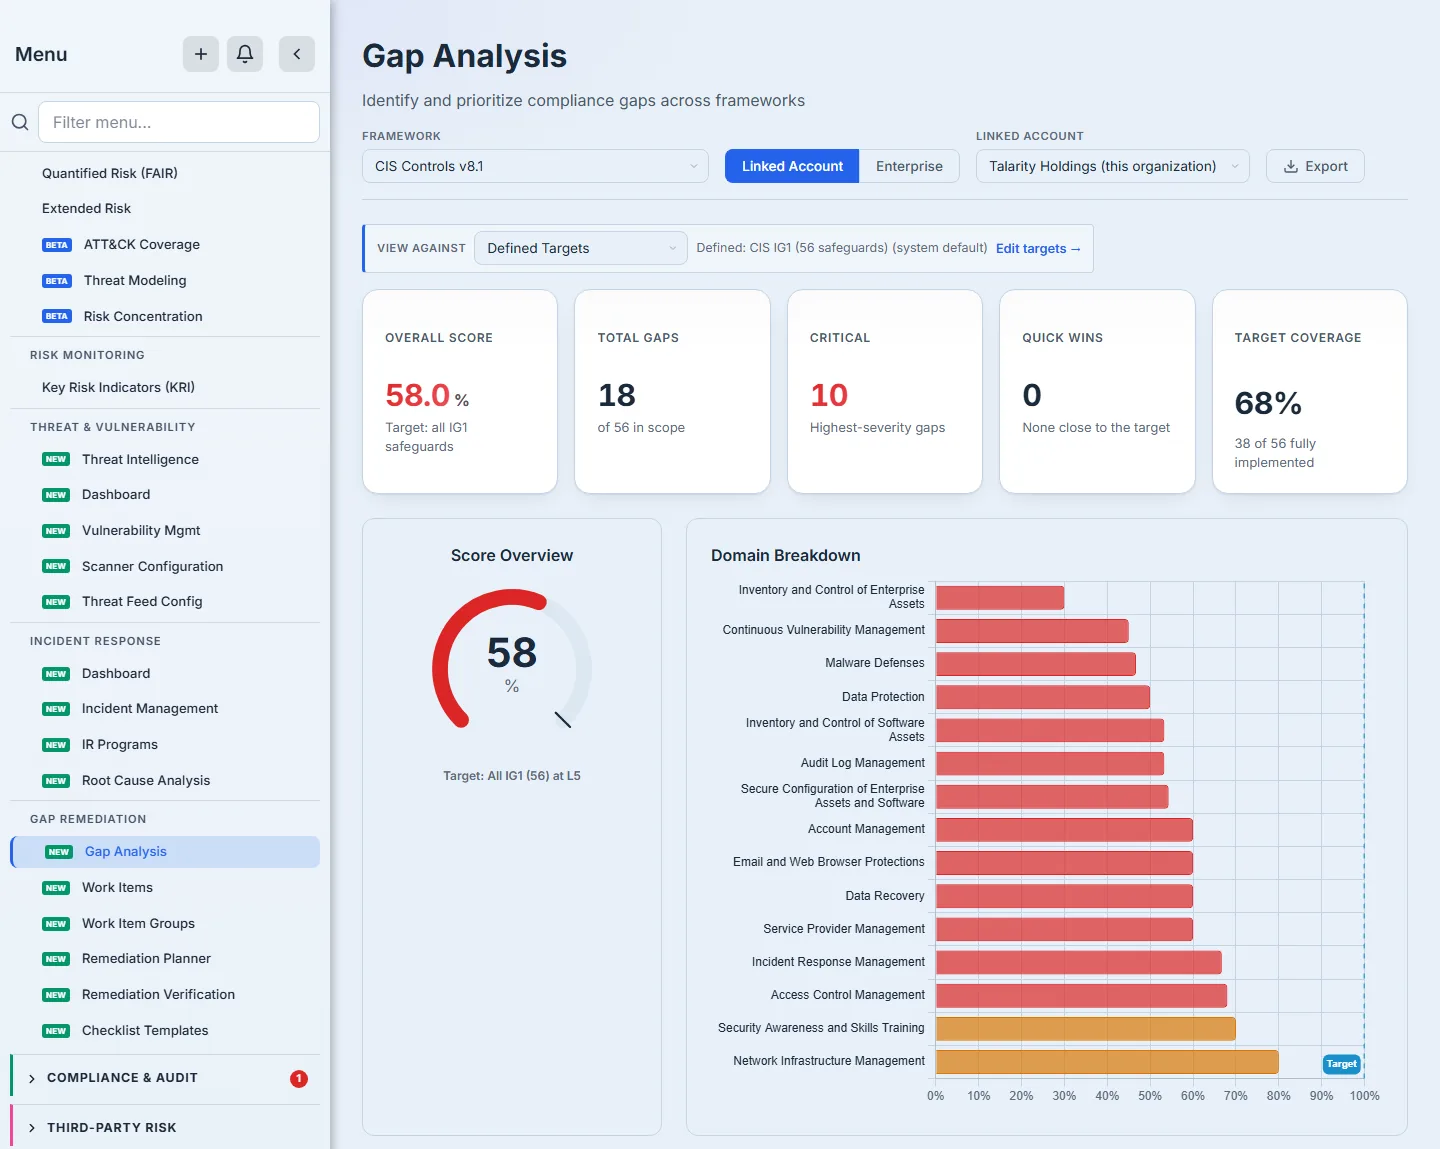
Flip the scope toggle to Linked Account (or click any account name in the rankings). The gauge shows the account’s score against its effective target — the target strip above it names the exact bar in force (“CIS IG1, 56 safeguards”) and where that bar came from: account override, organization goal, or system default. The View against selector lets you preview the same data against a different target without saving anything.
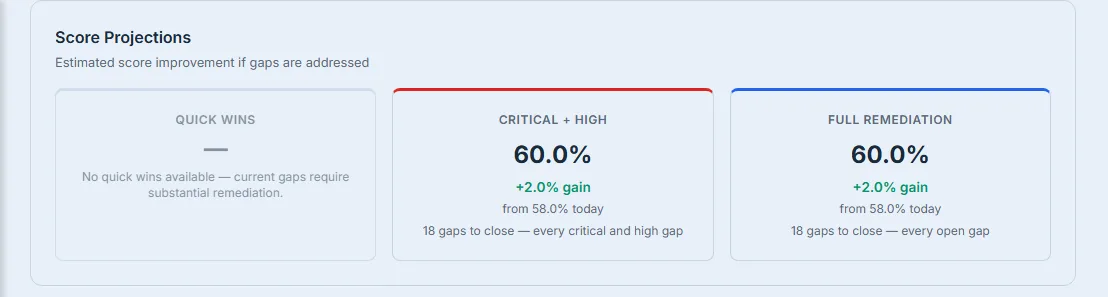
Score Projections are re-scored scenarios, not estimates: each card re-runs the framework’s real scoring engine with that scenario’s gaps closed to their bar. When a scenario can’t be modelled honestly, the card says so and shows a dash — it never invents a number.
The Priority Gap List is the working queue: filter by severity (the dropdown shows live counts), domain, or type, or search by control text. Each row carries the control’s current maturity, the bar it needs to hit, and its priority score.
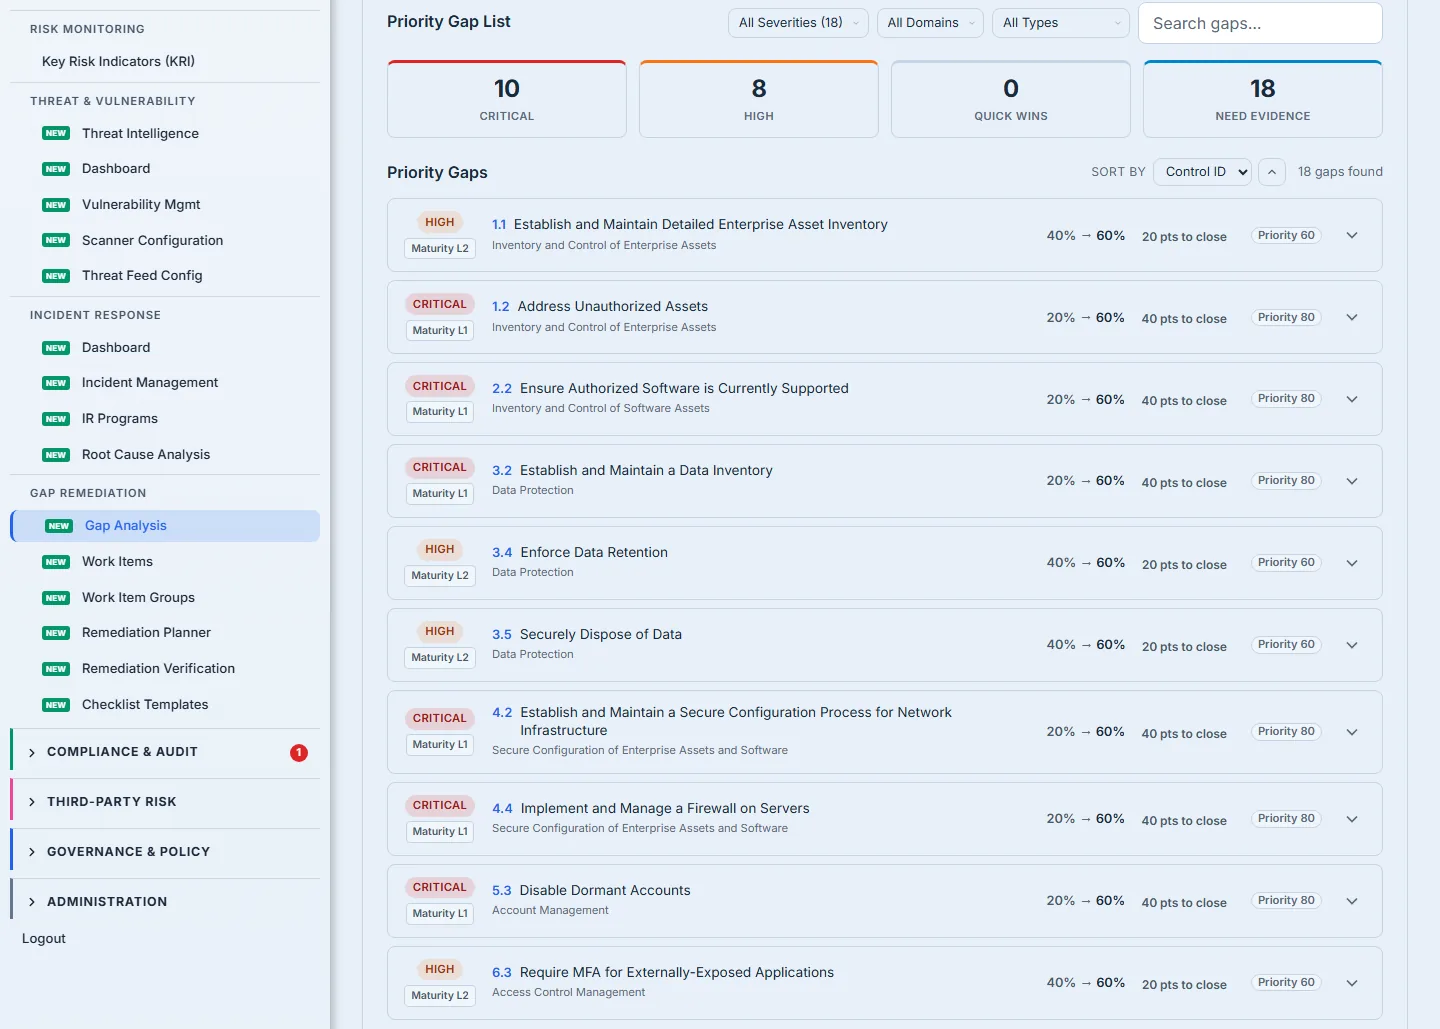
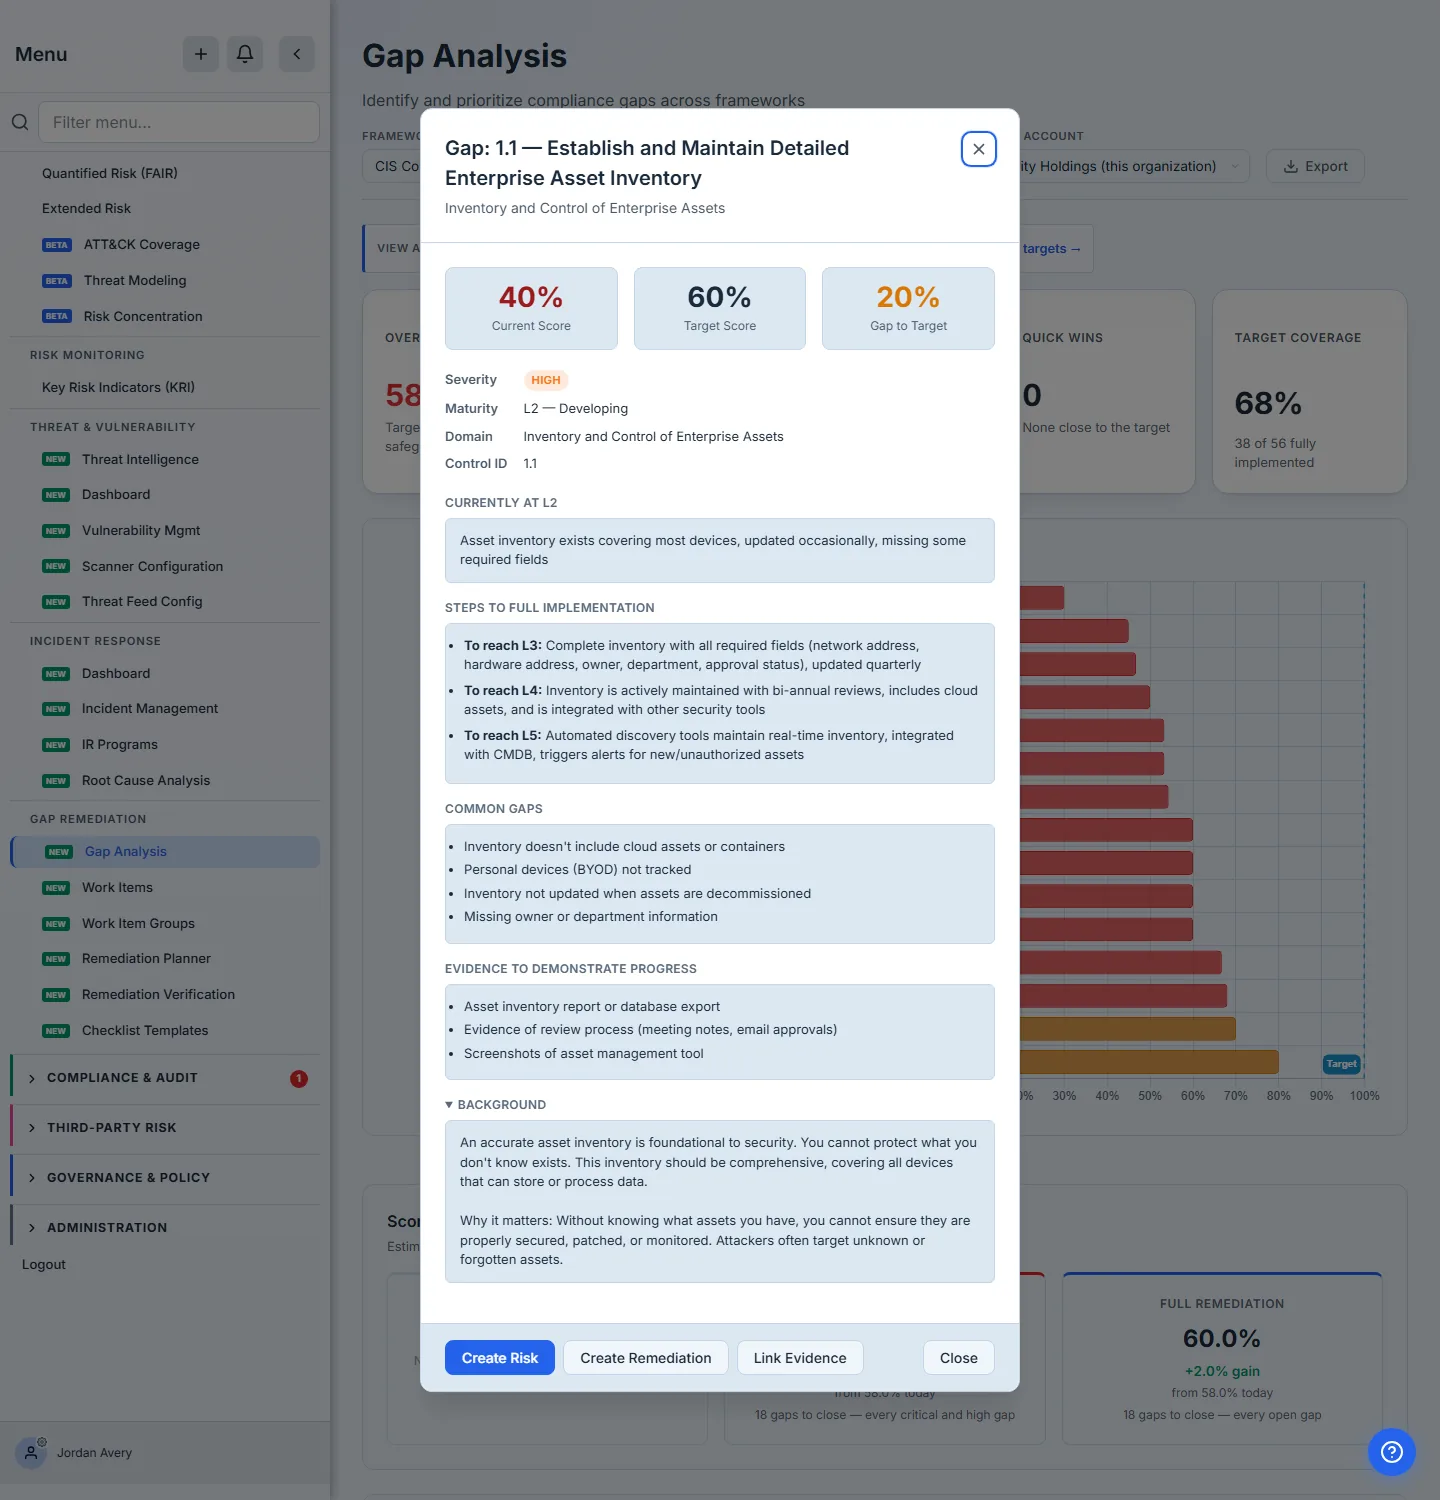
Every gap opens into a case-file view — maturity staircase (“you’re at L2; here’s what L3 requires”), evidence suggestions, and the background for the control. From the same row you can Create Risk, Create Remediation, or Link Evidence without leaving the page; risk creation pre-fills likelihood and impact from the score bands.
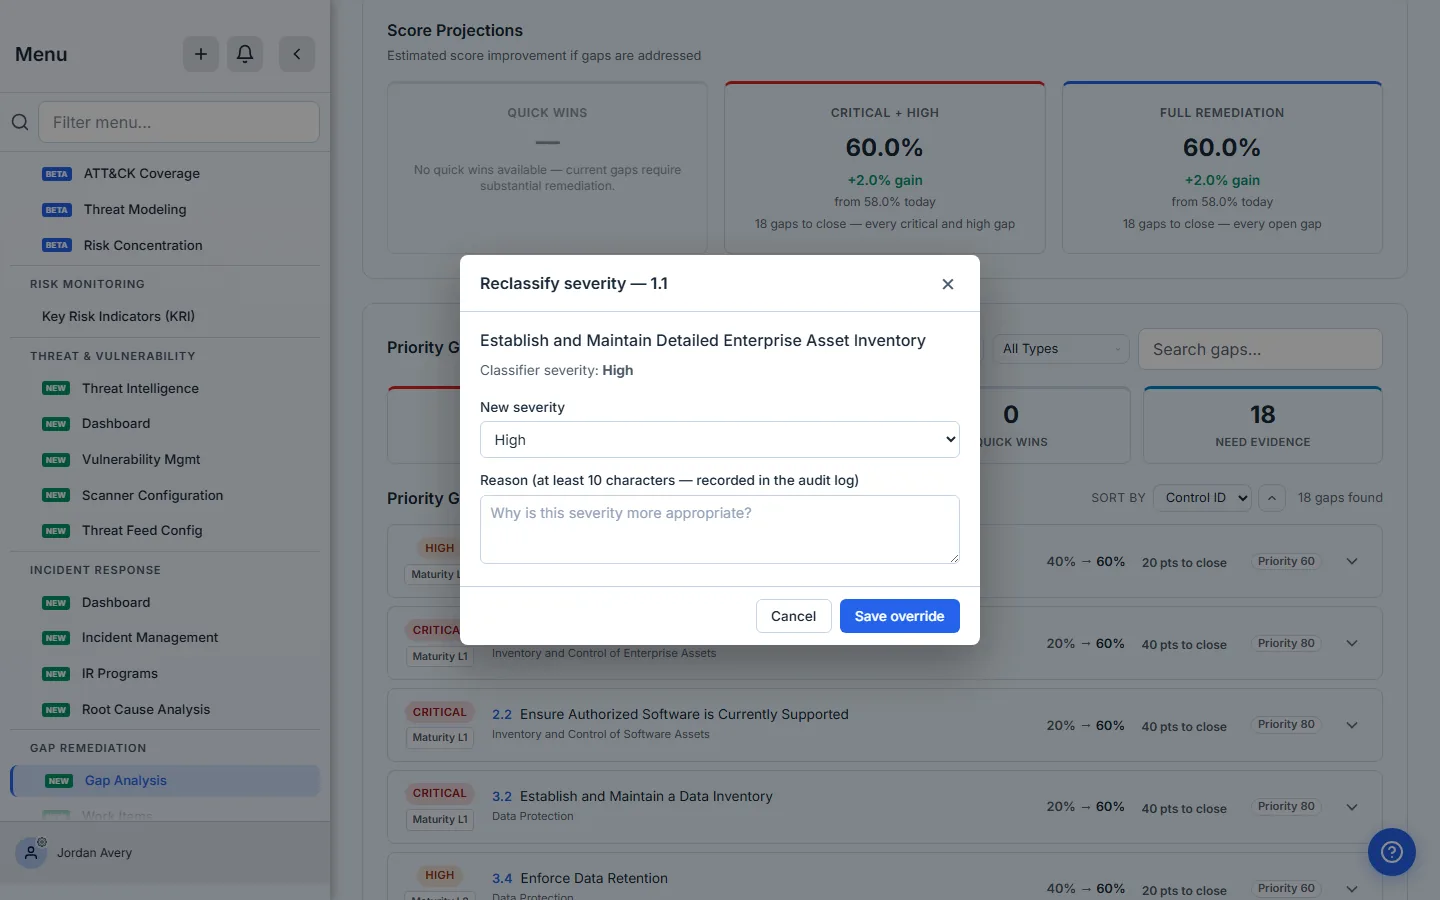
Disagree with a severity? Reclassify it. The override requires a written reason (ten characters minimum), records who set it and when, and keeps the classifier’s original severity beside the override — auditors see both.
Step 4 — Generate the enterprise report
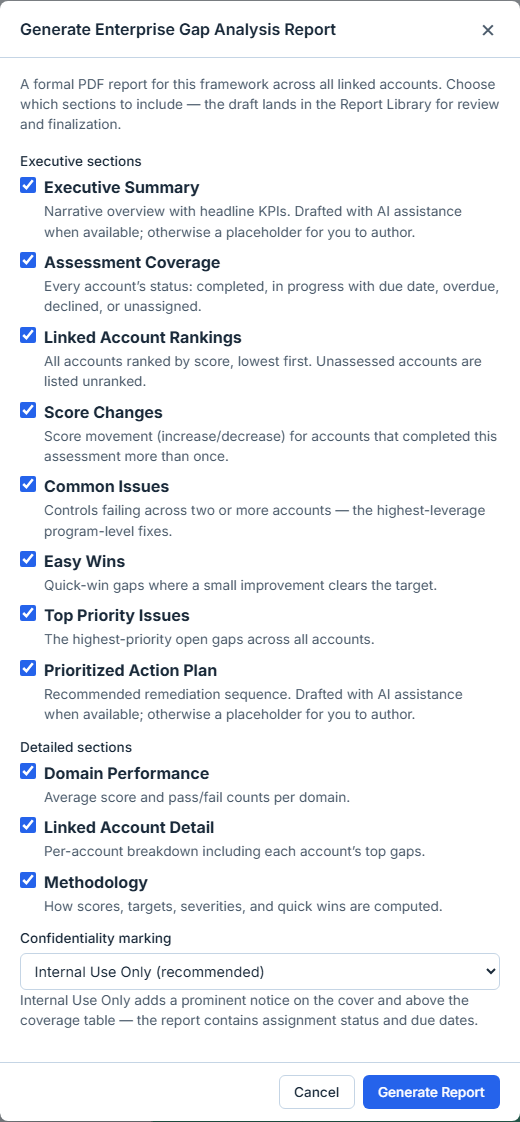
Back in Enterprise scope, click Generate Report. The modal is the report’s control panel:
- Executive sections — Executive Summary, Assessment Coverage, Rankings, Score Changes, Common Issues, Easy Wins, Top Priority Issues, Prioritized Action Plan.
- Detailed sections — Domain Performance, per-account detail, Methodology.
- Confidentiality marking — Internal Use Only (the default, and the right choice: the report contains assignment status and due dates), Confidential, or no marking.
Every checkbox is captioned so you know what you’re including before you include it. Untick what a given audience doesn’t need — a board pack might be executive sections only; the working copy for your remediation team keeps everything.
Generation takes a few seconds: Talarity assembles the same enterprise rollup the page shows, merges in the latest assignment per account, renders the PDF server-side, and files a draft artifact in the Report Library. The draft PDF opens immediately.
The coverage truth table
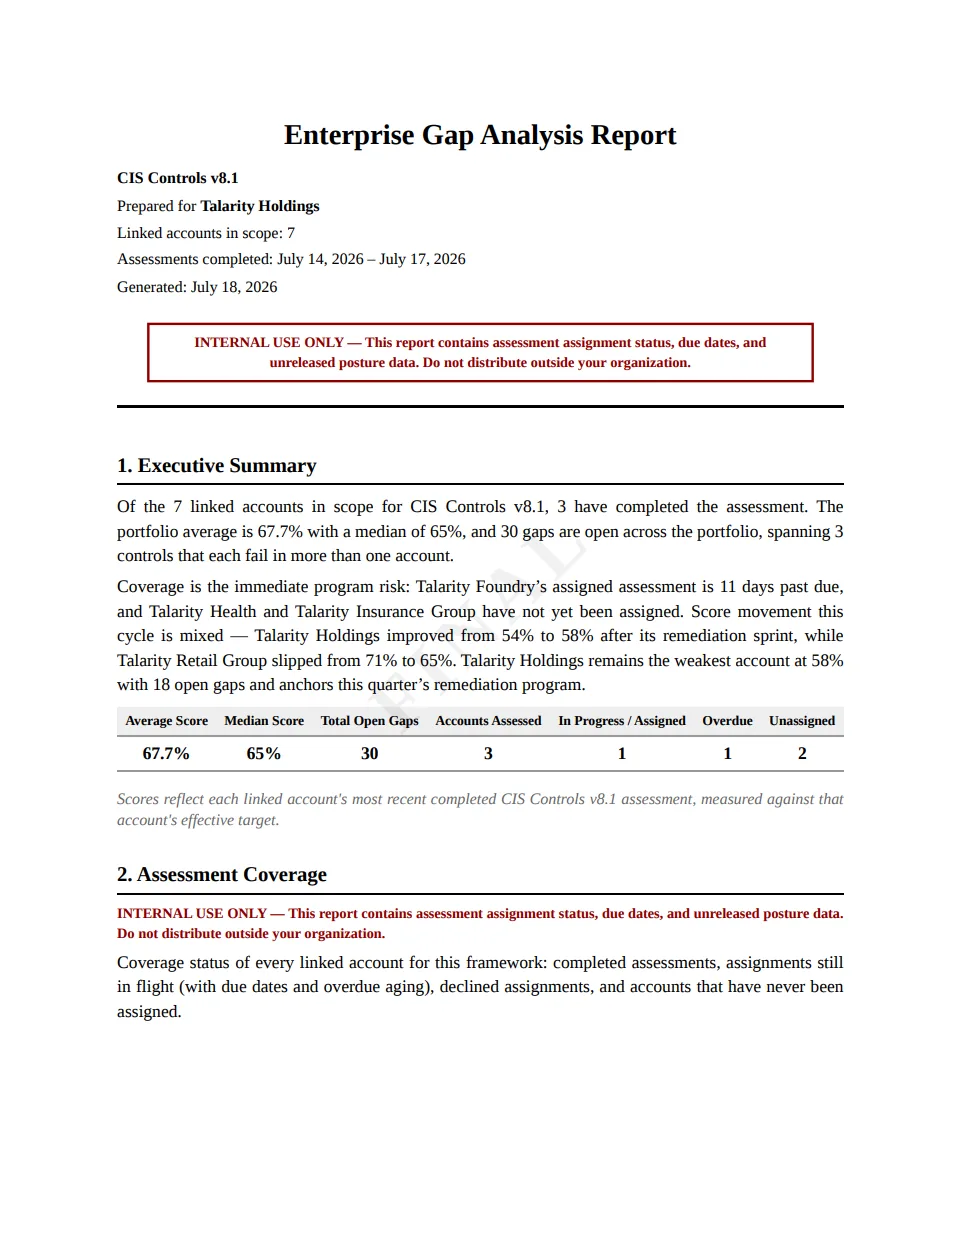
This is the section the user asked for by name, and the one spreadsheets always get wrong. Every linked account appears with its real state: Completed with a date and score, Assigned with its due date, Overdue with days-past-due aging, Declined, or Unassigned — no assessment has been assigned. Attention-demanding states sort first. Cross-organization accounts show in-progress detail only if the counterpart released it — assigning work never leaks the recipient’s progress.
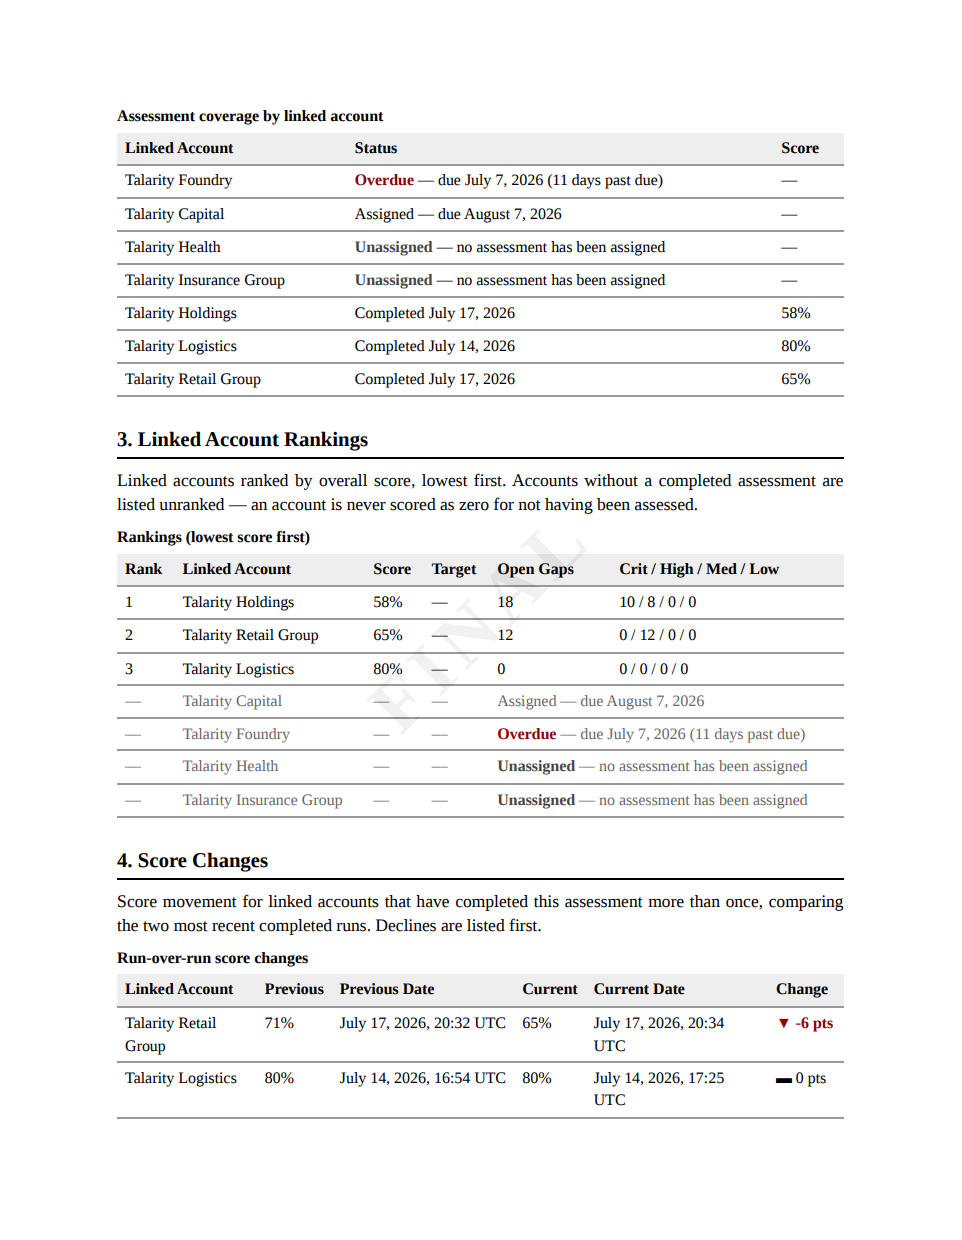
Score Changes compares each account’s two most recent completed runs — declines listed first with a red ▼, improvements with a green ▲, flat runs with a dash. An account that has assessed only once says “no trend yet” instead of pretending.
Common issues, easy wins, top priorities
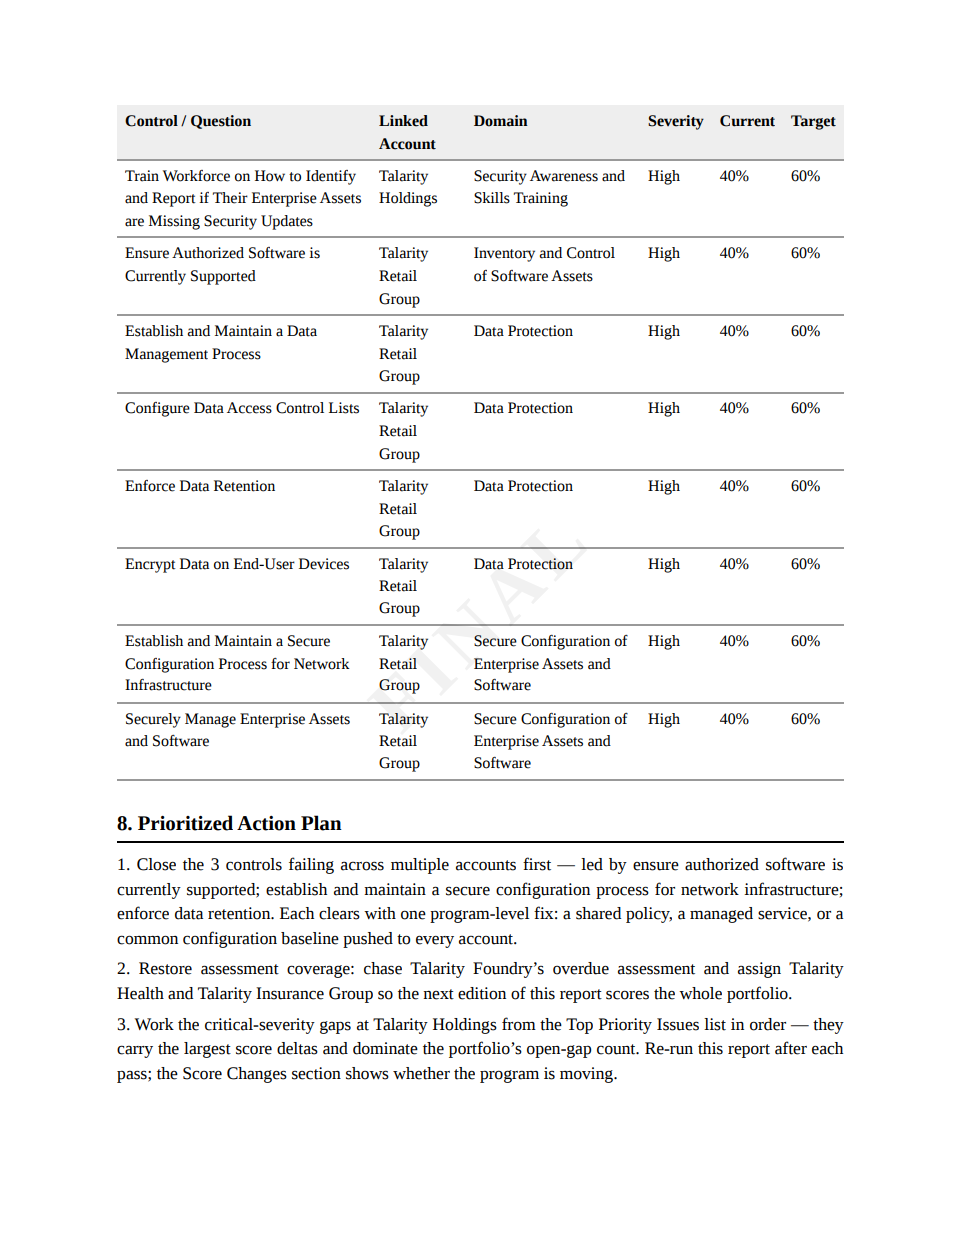
The analytical middle of the report mirrors the dashboard: Common Issues (controls failing in 2+ accounts, the program-level fixes), Easy Wins (gaps flagged as quick wins — mostly-closed controls where a small push clears the bar; when there are none, the section says so honestly rather than padding), and Top Priority Issues (the highest severity-weighted gaps across the whole portfolio).
The two narrative sections — Executive Summary and Prioritized Action Plan — are AI slots. When AI drafting is enabled for your organization, they arrive pre-drafted and badged “AI-drafted”, and the report cannot finalize until a human reviews each one. With AI off, they’re placeholders you author yourself at finalize time. Either way, every table in the report is deterministic — AI never generates a number.
Step 5 — Review and finalize in the Report Library
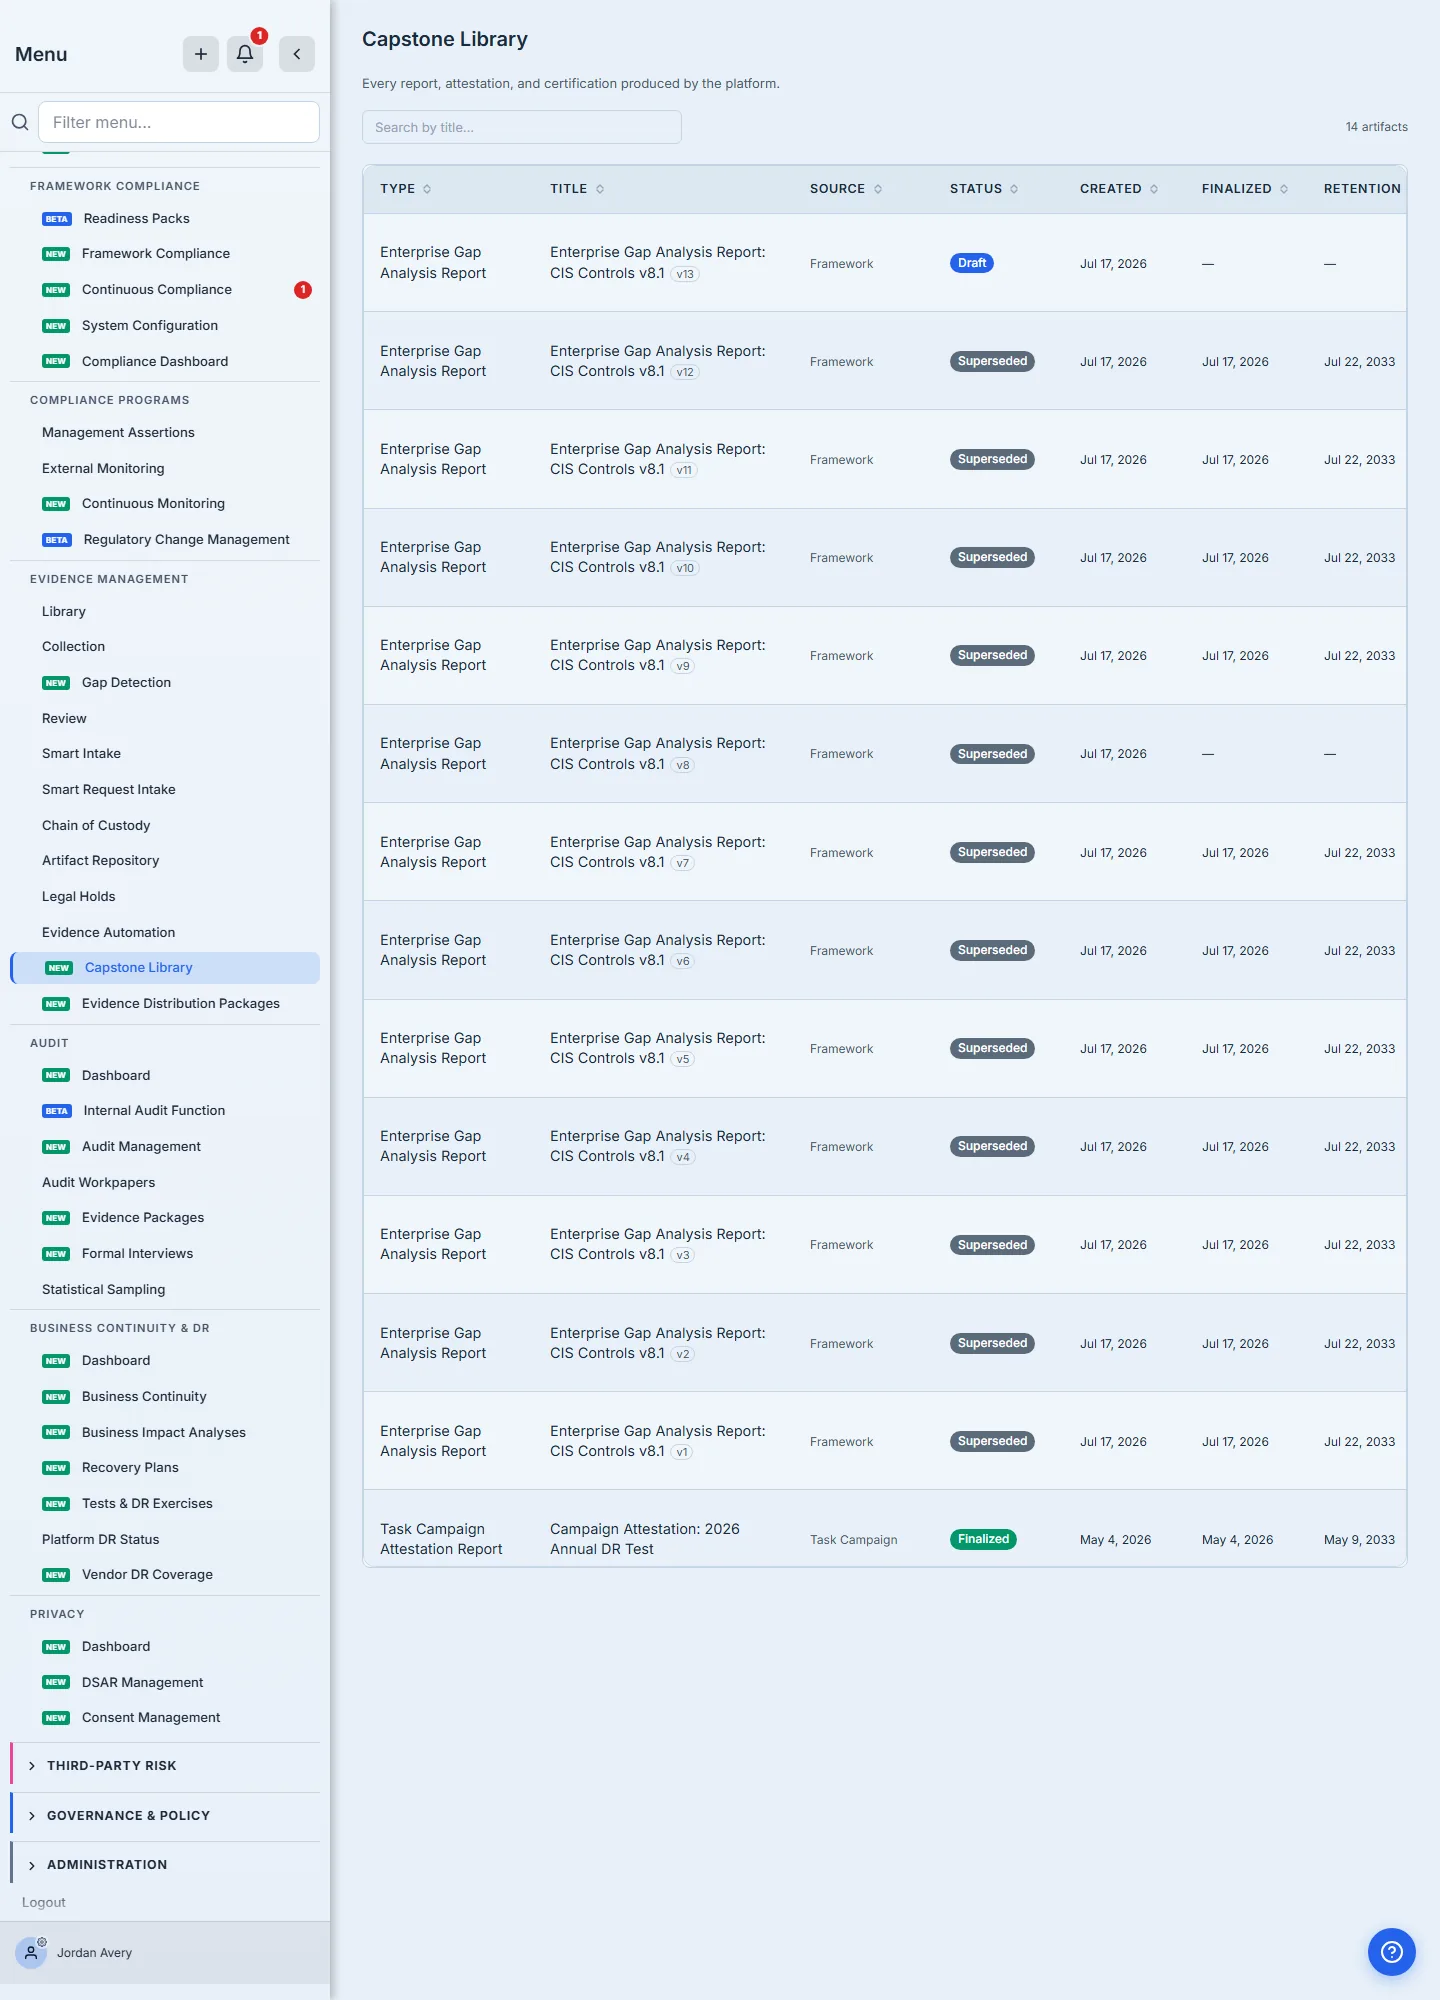
The draft lands in /app/capstones alongside every other report the platform produces, with status, retention, and export tracking per row.
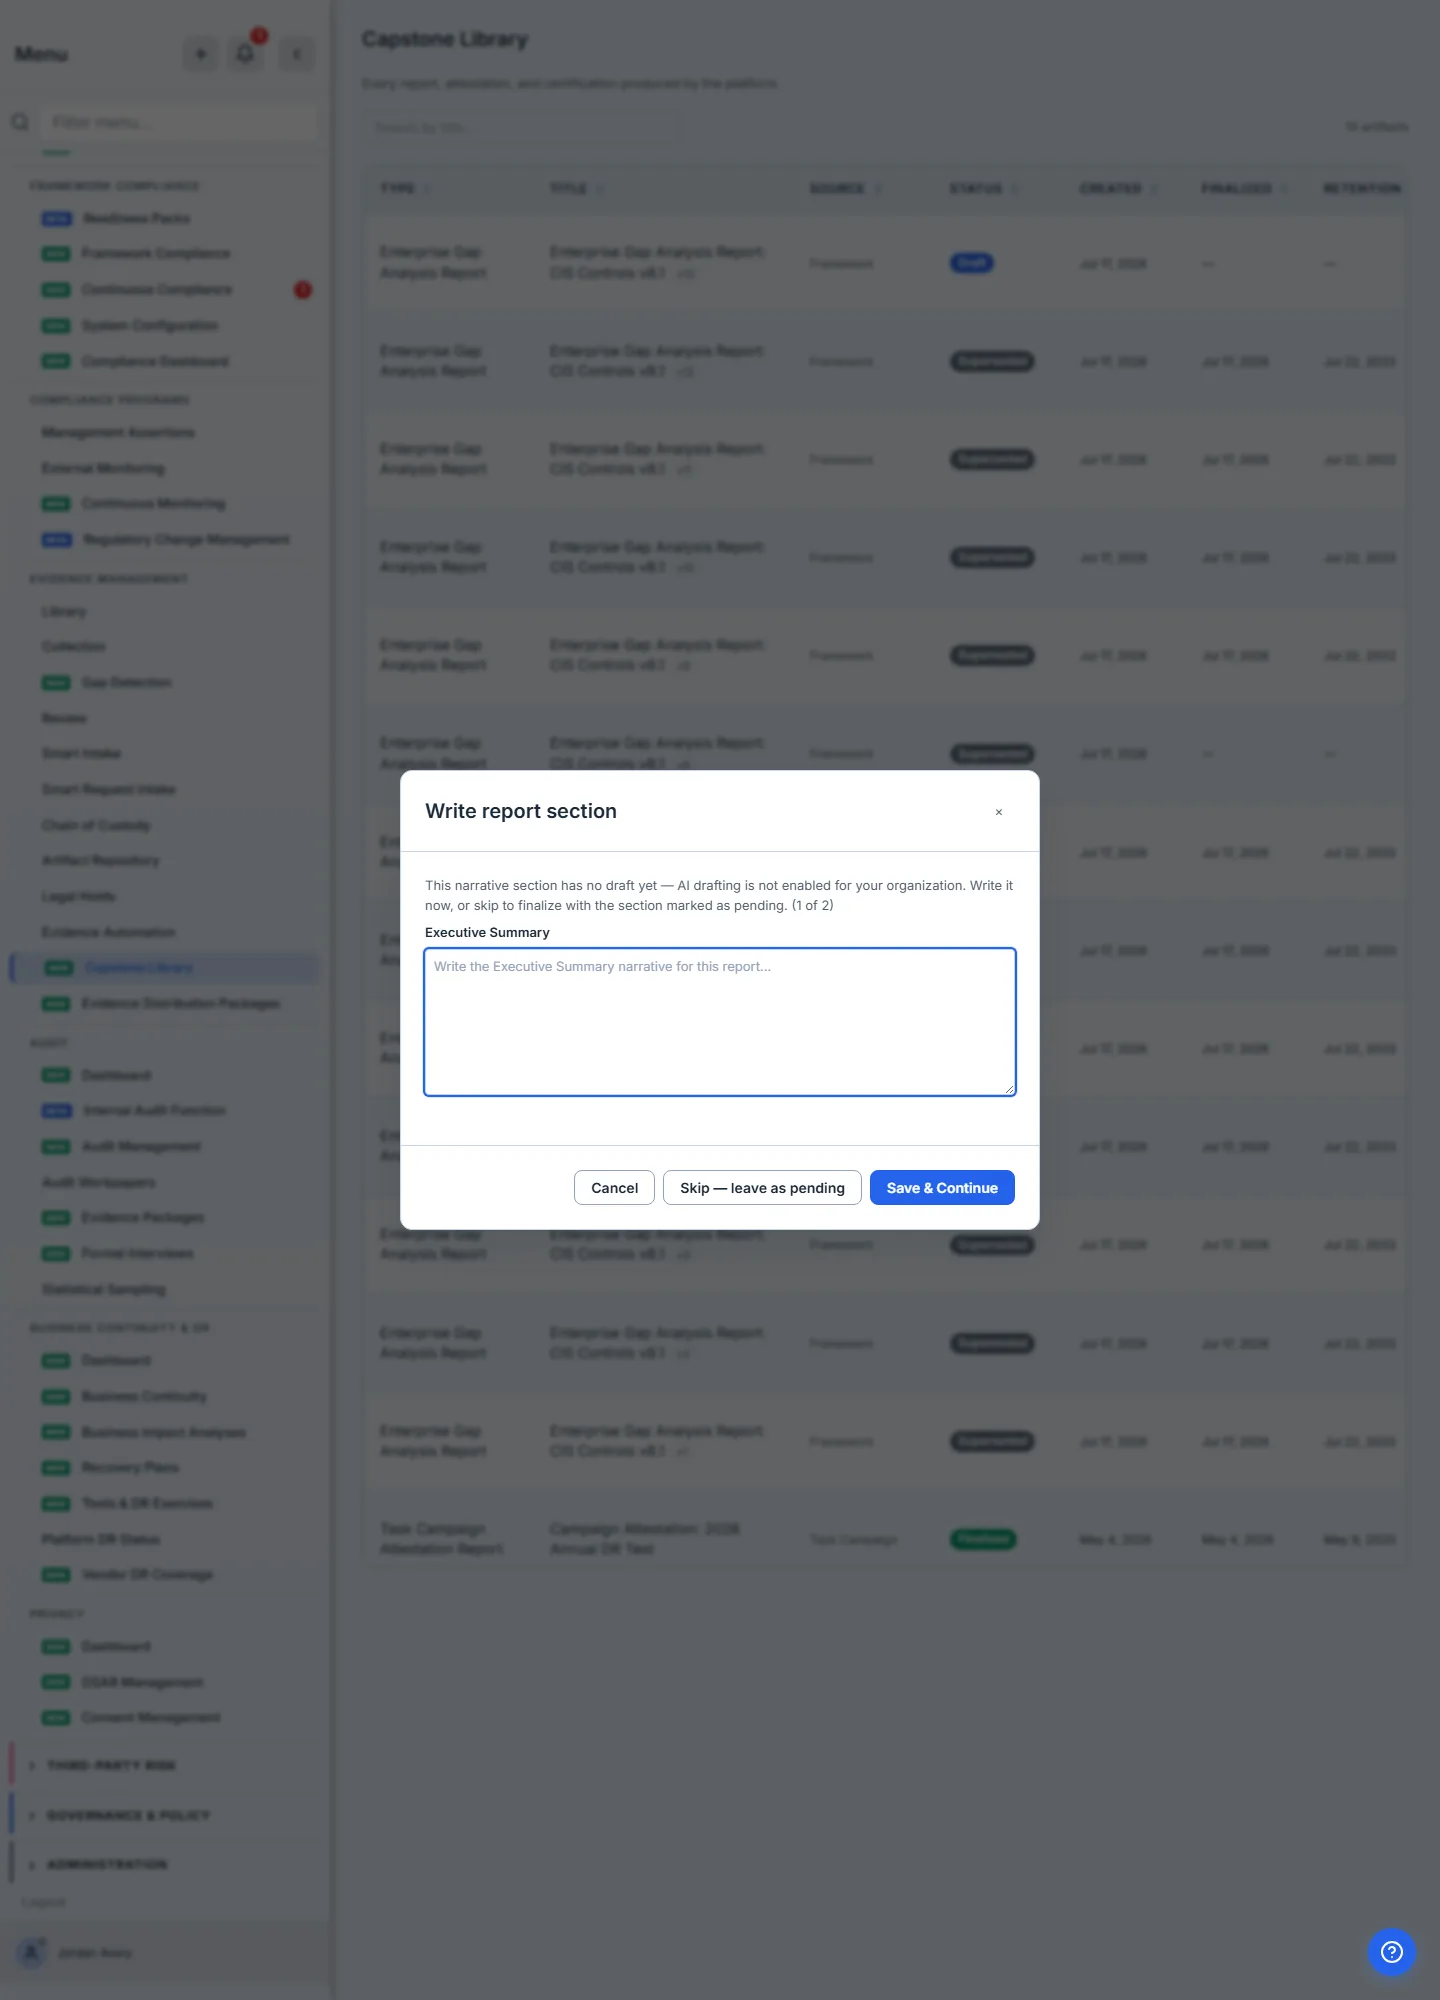
Click Finalize and Talarity walks you through every narrative that needs attention — AI drafts require an explicit accept-or-edit; empty sections offer a Write step (or skip, and the section finalizes marked as pending). This is where the executive summary gets its human voice.
Finalize re-renders the PDF with a FINAL stamp, locks a seven-year retention date, and flips the row to Finalized. Generating a newer edition later automatically marks this one Superseded — the history is preserved, never overwritten. Finalized reports can also be exported as Word or PowerPoint from the same row, placed under legal hold, or superseded with a reasoned note.
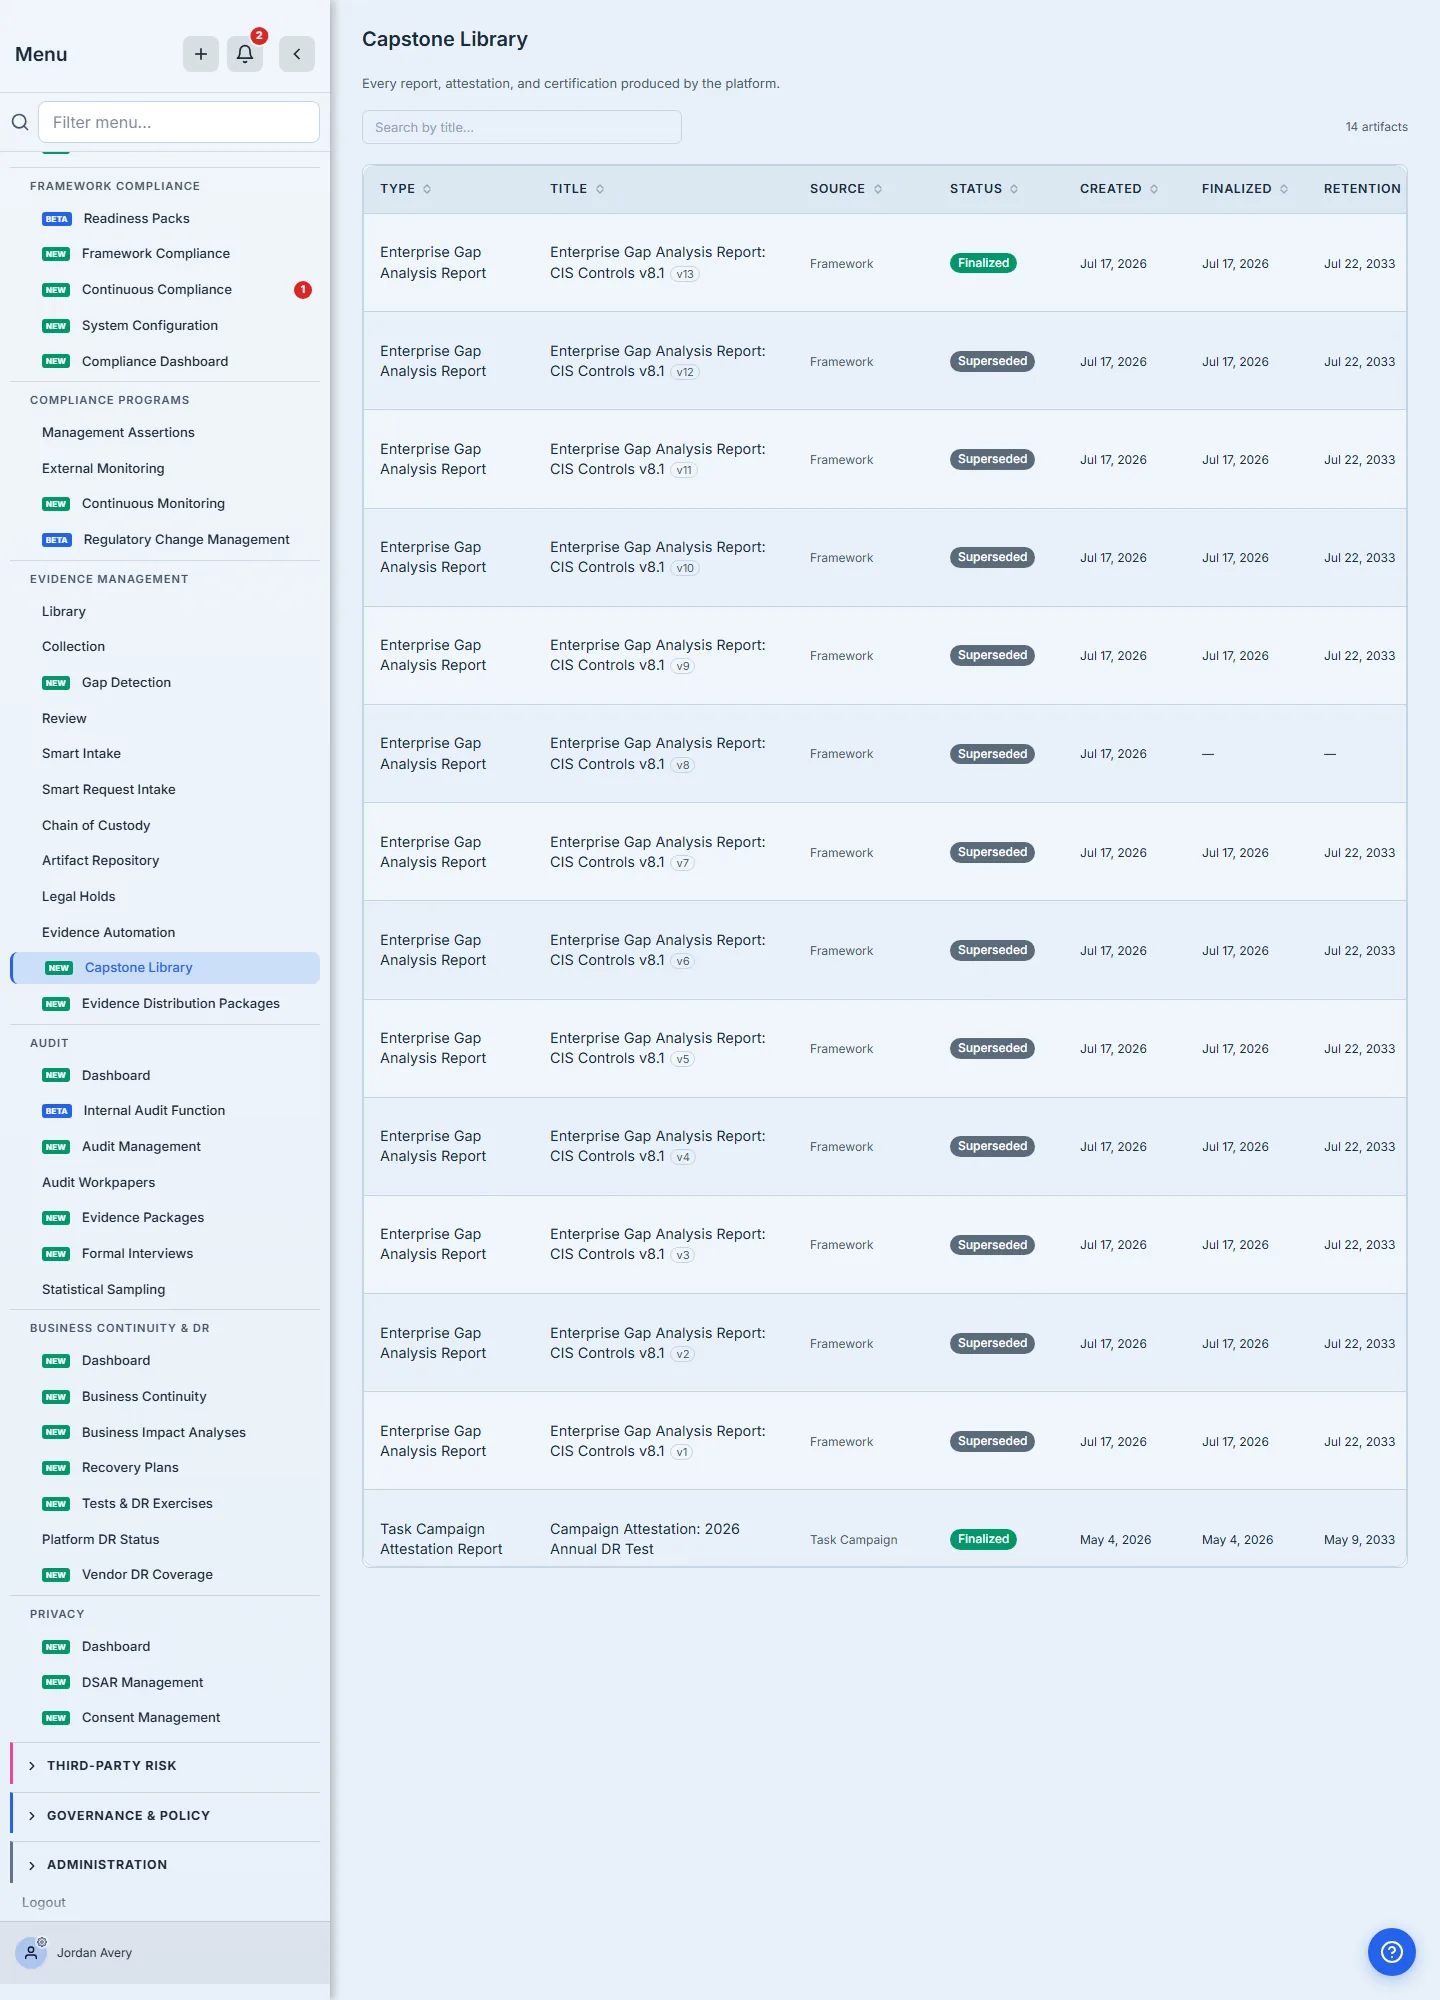
Why the report supersedes rather than overwrites: each finalized edition is an immutable artifact with its own retention clock. When the auditor asks what leadership was told in Q3, the Q3 edition still exists — with the exact rankings and coverage it reported at the time.
What’s deliberately not in this walkthrough
- CSV export — the Export button next to Generate Report downloads the current scope as CSV (rankings in Enterprise scope; the full gap list in Linked Account scope) for spreadsheet work.
- White-label branding — organizations with white-label reporting licensed get their logo and colors on the report letterhead automatically; the capability is part of the branded-reports package.
- Cross-org requests — viewing a company that hasn’t shared its analysis yet offers a request flow; that lifecycle is covered in the data-sharing article.
- Assigner perspective — subsidiaries whose parent set targets for them get a “perspective” picker to see their data through the parent’s bar; it appears only in that configuration.
What you walk away with
- A live ranking of every linked account, lowest-first, each scored against its own effective target — with unassessed accounts listed, never zeroed.
- The coverage truth: who completed, who’s assigned with what due date, who’s overdue by how many days, who was never assigned.
- Common issues across accounts — the shortlist where one program-level fix pays off N times.
- A finalized PDF report with an Internal Use Only band, human-reviewed narratives, dynamic section selection, and a seven-year retention lock in the Report Library.
- Run-over-run score movement per account, so the next edition of the report shows whether the program is working.
Run yours this afternoon. Open /app/gap-analysis, switch to Enterprise, and click Generate Report — the default sections are the full report, and the first draft takes under a minute. Every quarter after that, the same button regenerates it from live data and retires the old edition on finalize.