ESG used to live in a slide deck. Now it lives in a filing. The EU’s CSRD, the ISSB standards, SEC climate rules — the ask is the same: report your environmental, social, and governance performance against a recognized framework, with numbers you can stand behind and a trail that shows how you got them. A spreadsheet of hand-keyed figures, re-assembled every reporting season, is not that trail.
Talarity’s ESG Program Management turns it into a maintained program: a register of metrics with targets and time-series values, framework disclosures you move from draft to published, an initiative tracker for the projects moving the numbers, and a dashboard that shows where you stand — so the sustainability statement is an export, not an all-nighter.
The program at a glance
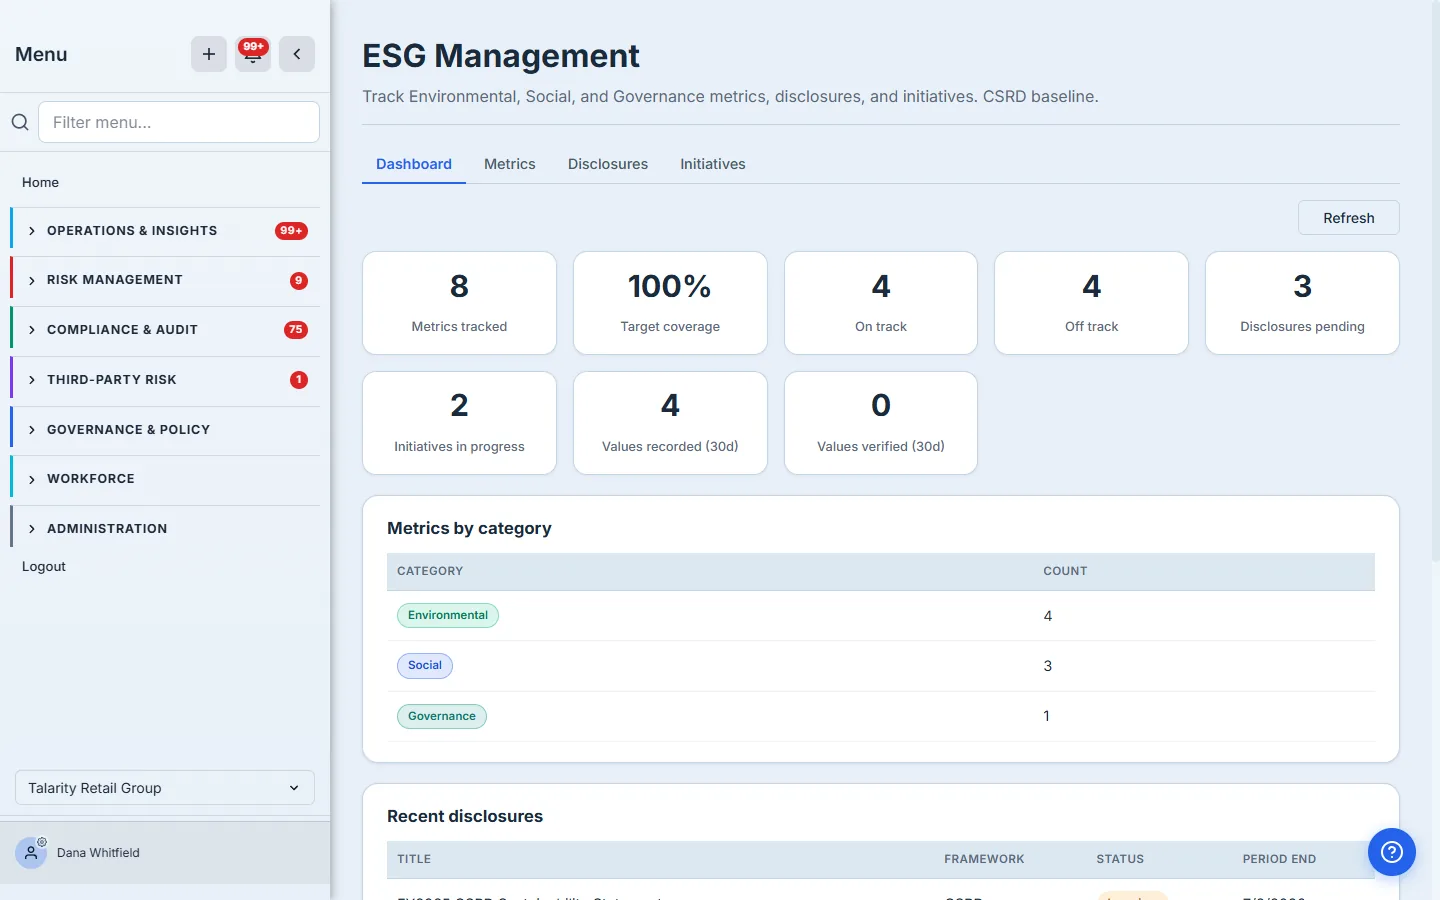
The Dashboard opens on the state of your ESG program: how many metrics you track, what share have a target, how many are on- versus off-track, disclosures pending, initiatives in progress, and how many values you’ve recorded and verified in the last 30 days — plus a breakdown of metrics by E, S, and G.
Your metric register
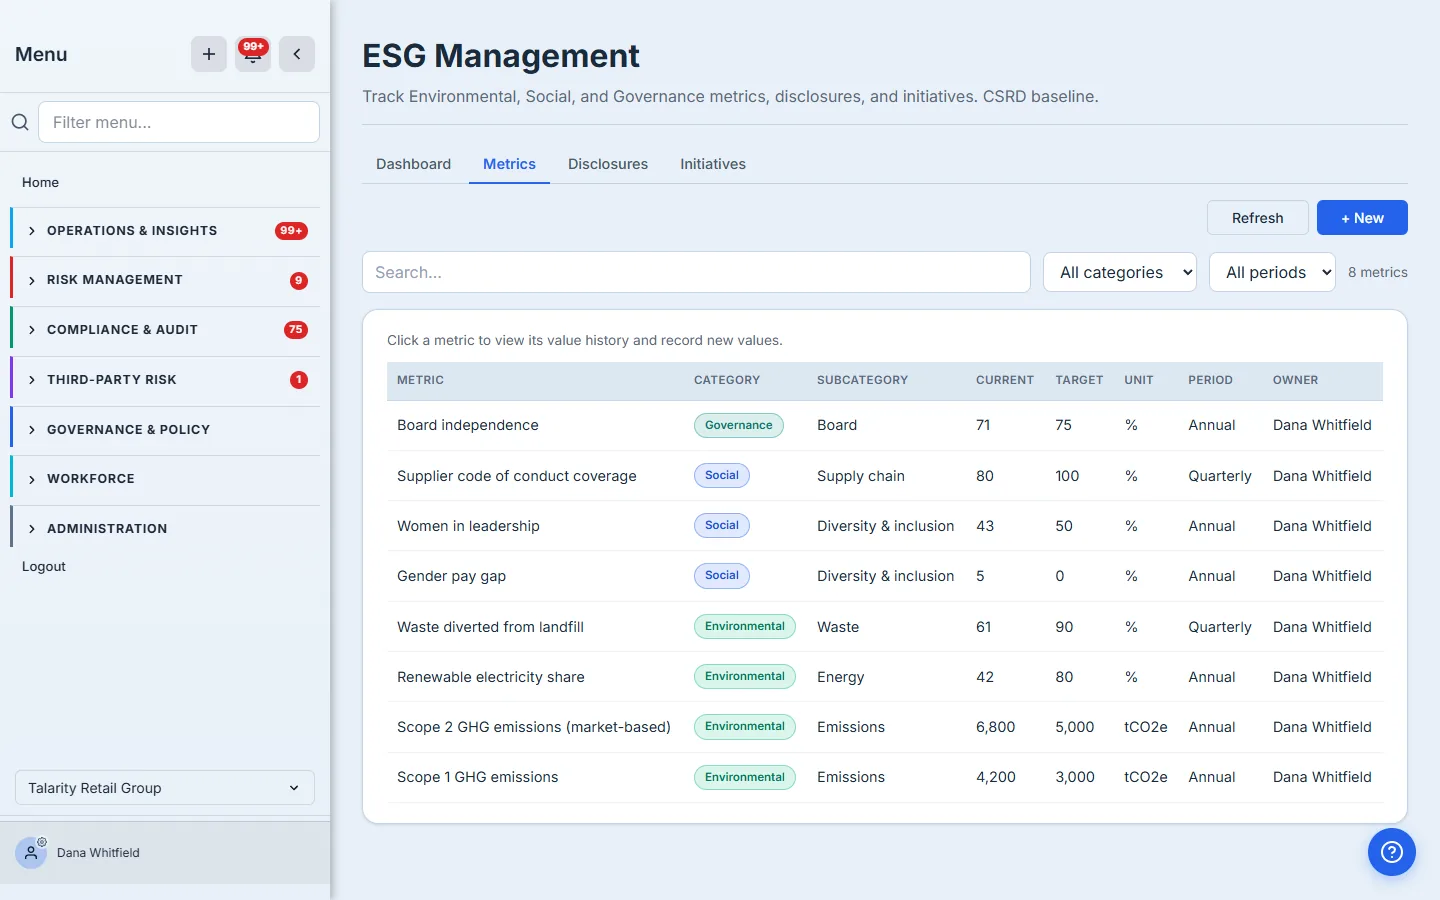
The Metrics tab is the register — every ESG metric you track, tagged Environmental, Social, or Governance, with its current value, target, unit, reporting period, and owner. It’s searchable and filterable by category and period, so it stays usable as your program grows from a handful of metrics to a full CSRD data set.
Every metric is a time series
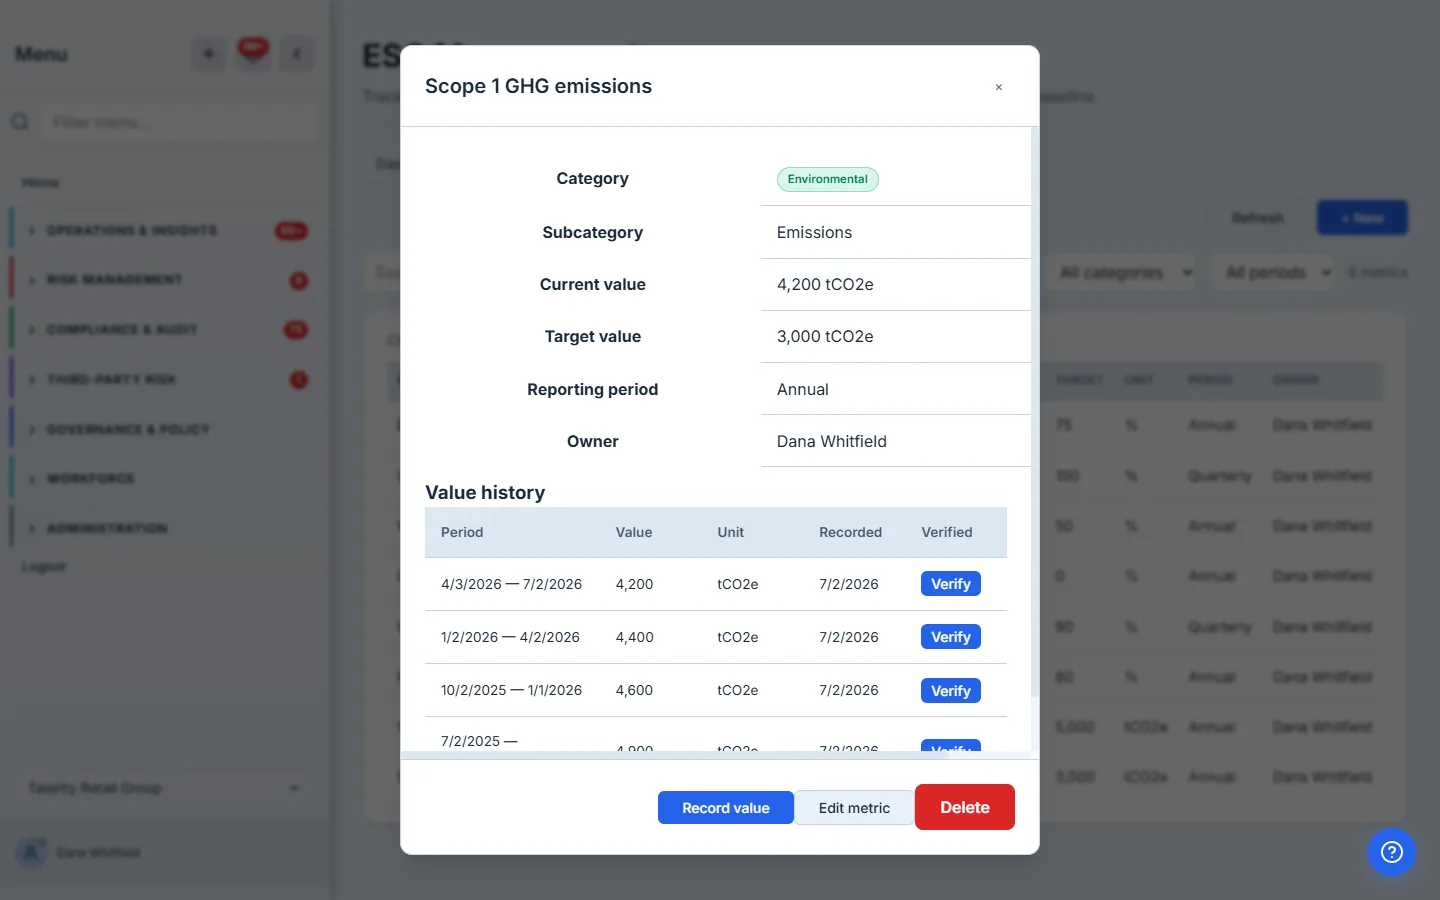
A metric isn’t one number — it’s a trend. Open any metric to see its full history: each period’s value, when it was recorded, and whether it’s been verified. That’s how a target becomes measurable — you can see whether Scope 1 emissions are actually coming down quarter over quarter, not just whether today’s figure beats the goal.
Recording — and verifying — a value
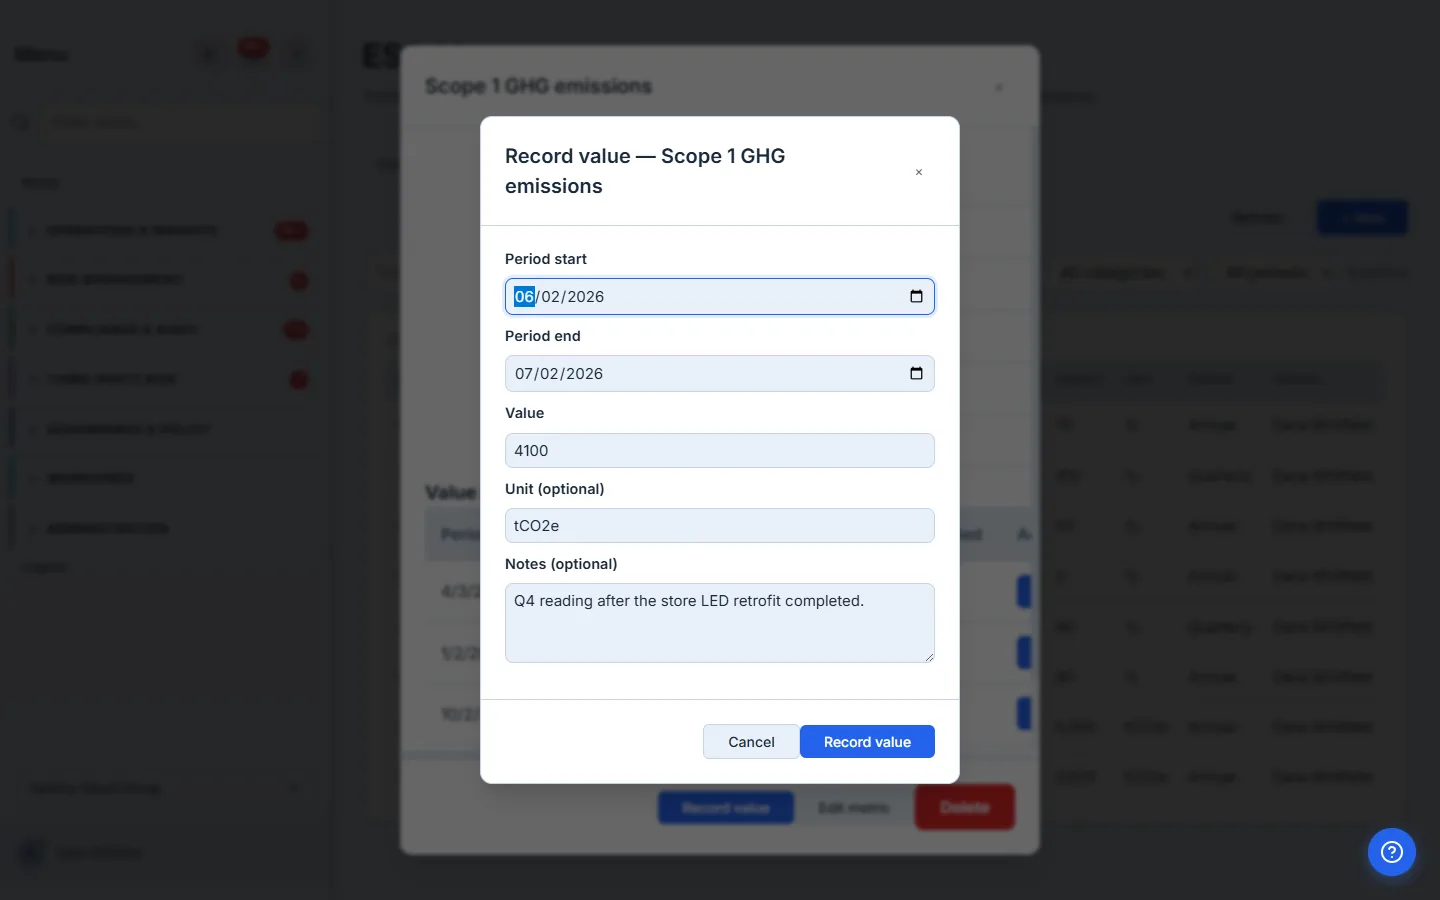
Each reporting period, you record the new value against the metric: the period it covers, the figure, the unit, and a note on where it came from. Recording it updates the metric’s current value and the dashboard; a separate verify step lets a reviewer sign off on the number, so a published figure isn’t just entered — it’s checked.
Framework disclosures, draft to published
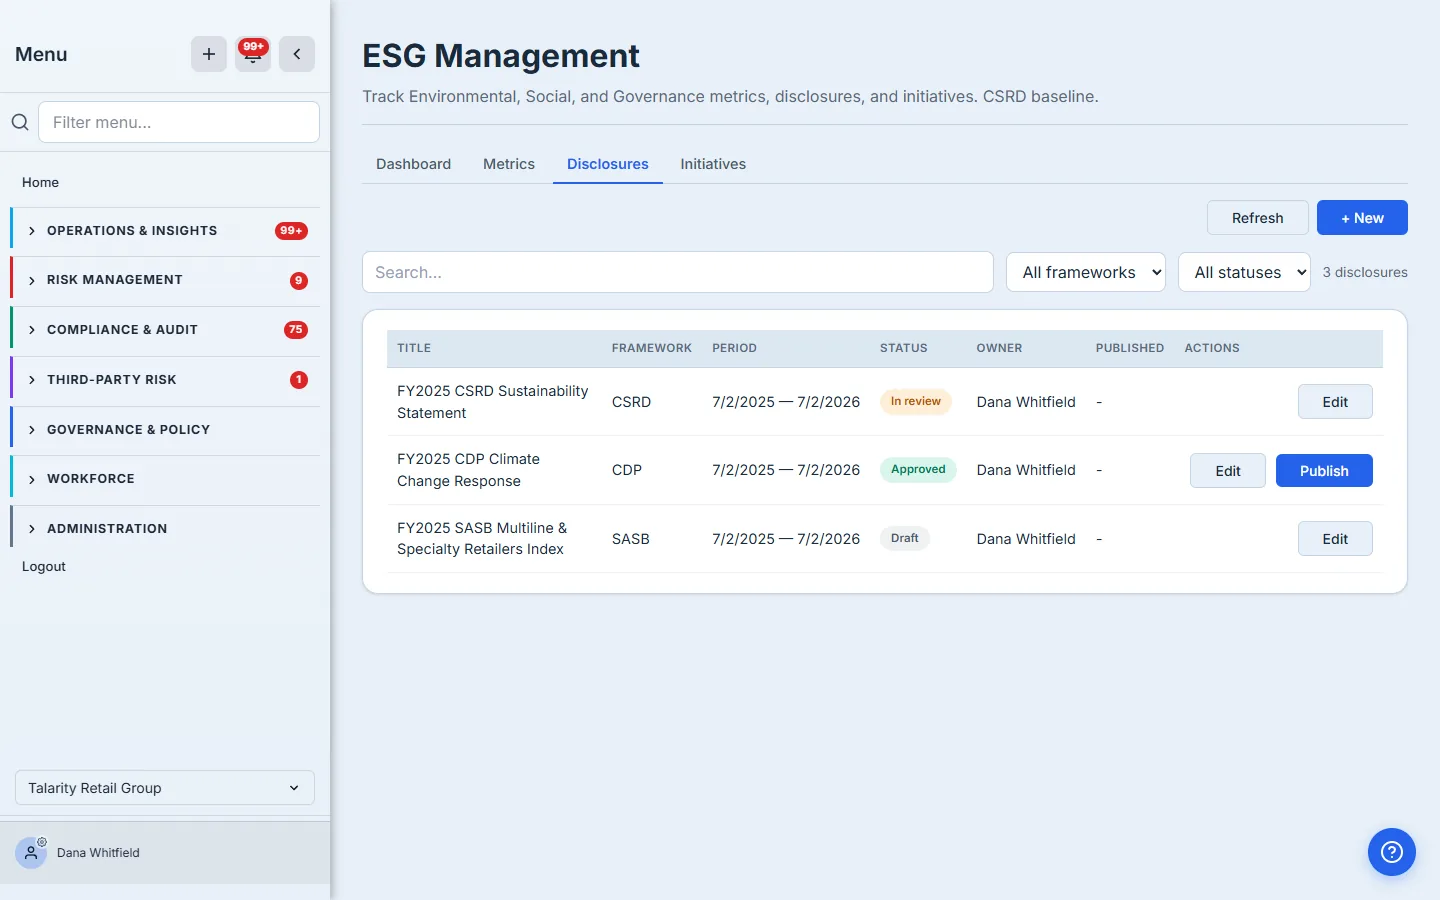
The Disclosures tab is where the metrics become a report. Start a disclosure against a framework — CSRD, SASB, GRI, TCFD, or CDP — for a reporting period, and move it through its lifecycle: draft, in review, approved, and finally published. Only an approved disclosure can be published, so the sign-off is real, not a formality.
The initiatives moving the numbers
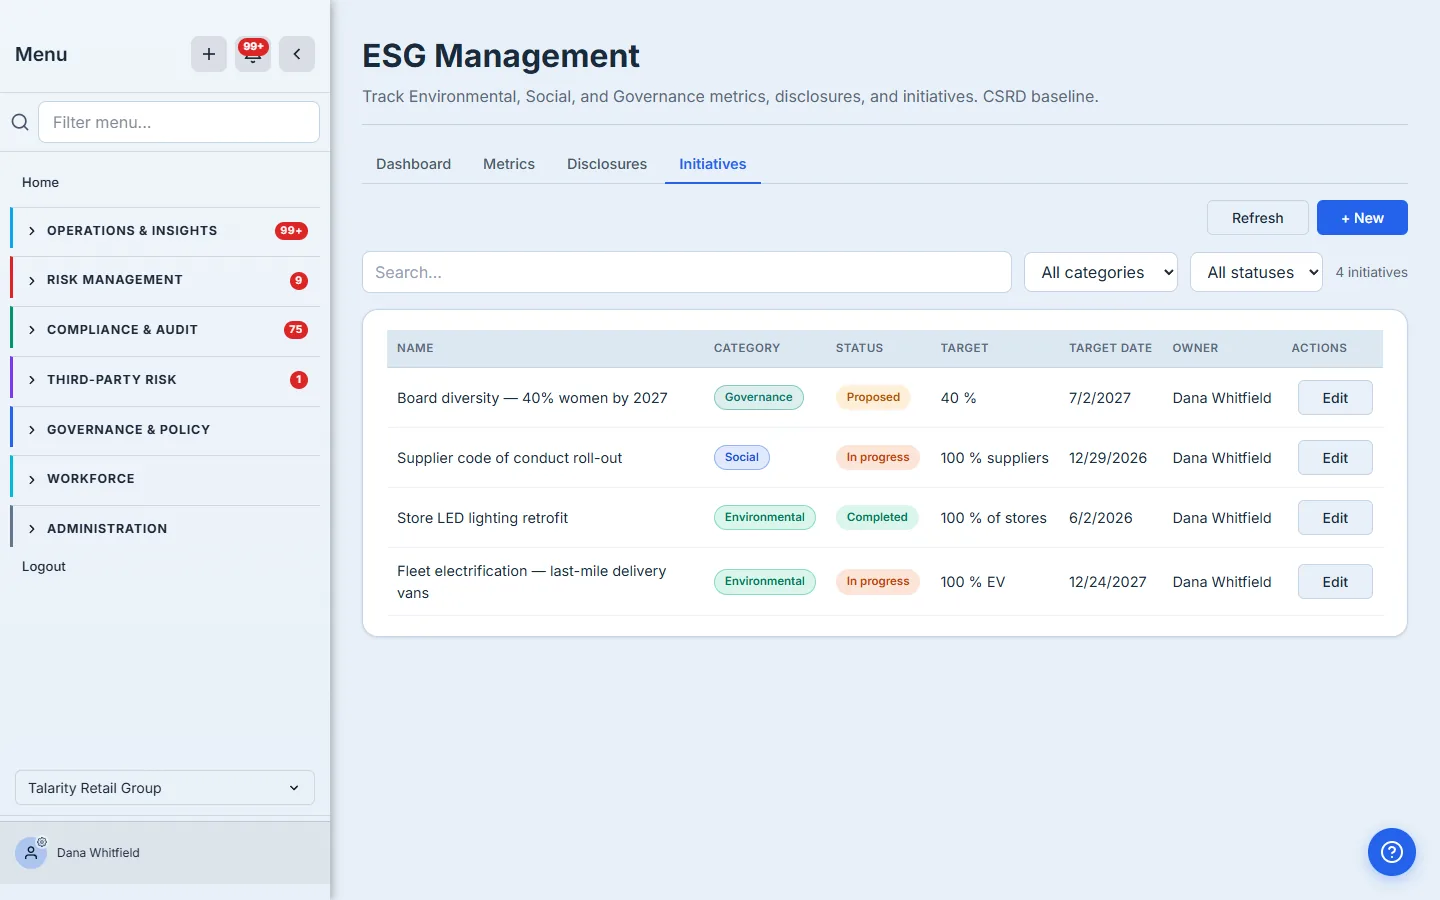
Metrics tell you where you are; initiatives are how you improve them. The Initiatives tab tracks the projects behind your targets — fleet electrification, an LED retrofit, a supplier code roll-out, a board-diversity push — each with a category, a status from proposed to completed, a target, and a date.
What you walk away with
- A metric register across Environmental, Social, and Governance, each with a target and a full time-series of values.
- Verified data — values recorded per period and signed off, so a published number is one someone checked.
- Framework disclosures for CSRD, SASB, GRI, TCFD, and CDP, moved from draft to published with a real approval gate.
- An initiative tracker tying the projects to the targets they move, and a dashboard of coverage, on-track status, and what’s pending.
When the CSRD deadline arrives, you won’t be building a report from a spreadsheet. You’ll be publishing a program you already run.