Most report builders are a page of boxes you drag around. That is the easy half. The hard half is the part nobody photographs: where each box gets its numbers, which rows it is allowed to count, what the person running the report is asked before any of it happens, and what has to be true before it may be produced at all. Get those wrong and you have a document that looks authoritative and answers a different question from the one you asked — or one that should never have been issued.
Talarity’s builder makes those five decisions separately and makes each of them visible. This walkthrough builds one report end to end — starting from a template we deliver, because starting from an empty page is almost never the right move.
Who’s involved
- Report author — copies a delivered template, adds what is missing, narrows it to the rows that matter, and decides what the report asks before it runs.
- Analyst — generates the finished report, answering whatever it asks. Never sees the builder.
- Administrator — publishes a version colleagues can rely on, and retires the ones the organisation has outgrown.
Step 1 — Start from something that already works
A template Talarity delivers cannot be edited, by anyone. That is not a permissions accident: the reports your audit committee has been reading for a year must not change because somebody adjusted a filter.
So the builder opens a delivered template in a state that refuses every edit and says why. The rule is stated in a bounded panel with the way out inside it — “Publishing and changing the layout need your own copy”, directly above a Save a copy button — rather than as a sentence floating over the page. That panel names both of the controls it governs, because both are inert: Publish is greyed to a disabled treatment rather than merely faded, so it cannot be mistaken for the live button beside it, and the layout selector — the one that chooses paged or continuous — will not open. Neither carries its own caption in the toolbar, which is deliberate: a sentence added to that strip in one state only pushes every action in it onto another row, so the two frames you are about to compare would disagree about where the buttons live. The data sources panel explains that you may read it freely but cannot add from it yet, and the settings pane says the same in its own words.
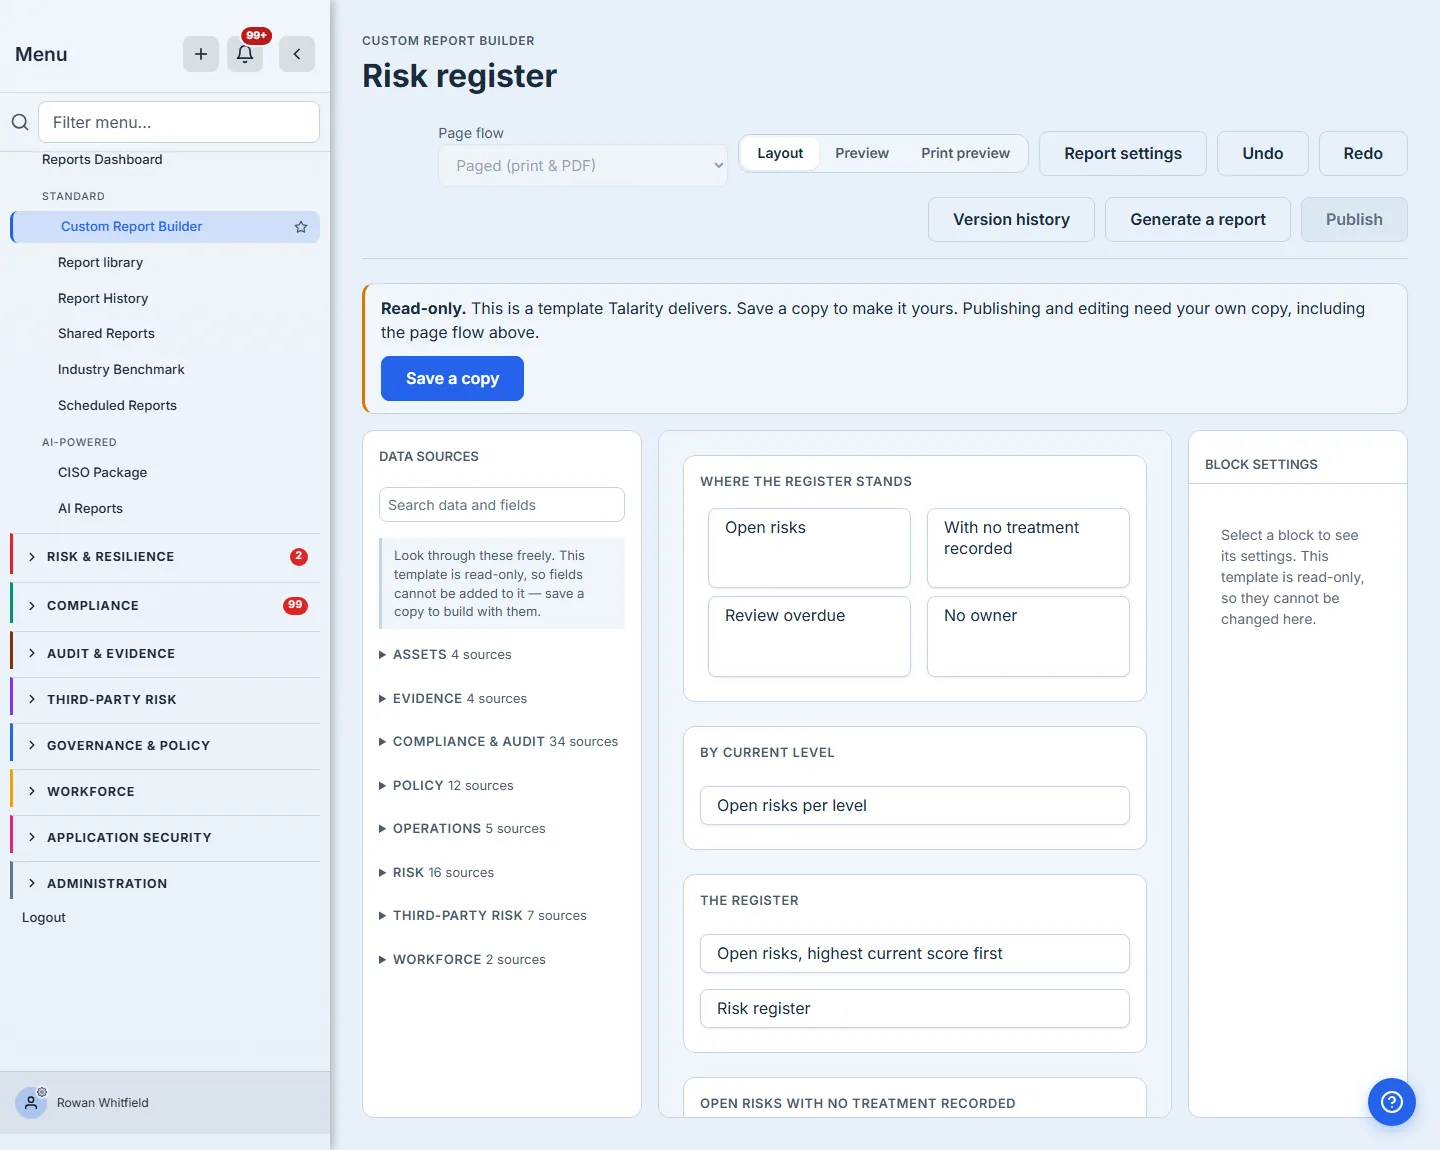
Save a copy makes a private draft that belongs to you, stamped with the template and version it came from. Everything below happens in that copy.
Step 2 — Add a block, in two steps rather than one
The + between any two blocks opens the picker. It lists everything a report page can contain — twenty-eight types, starting with text, headings, a single metric, a metric row, a table, a chart, a risk matrix, a roadmap, a coverage heatmap and a timeline — with a search box once the list is long enough to need one.
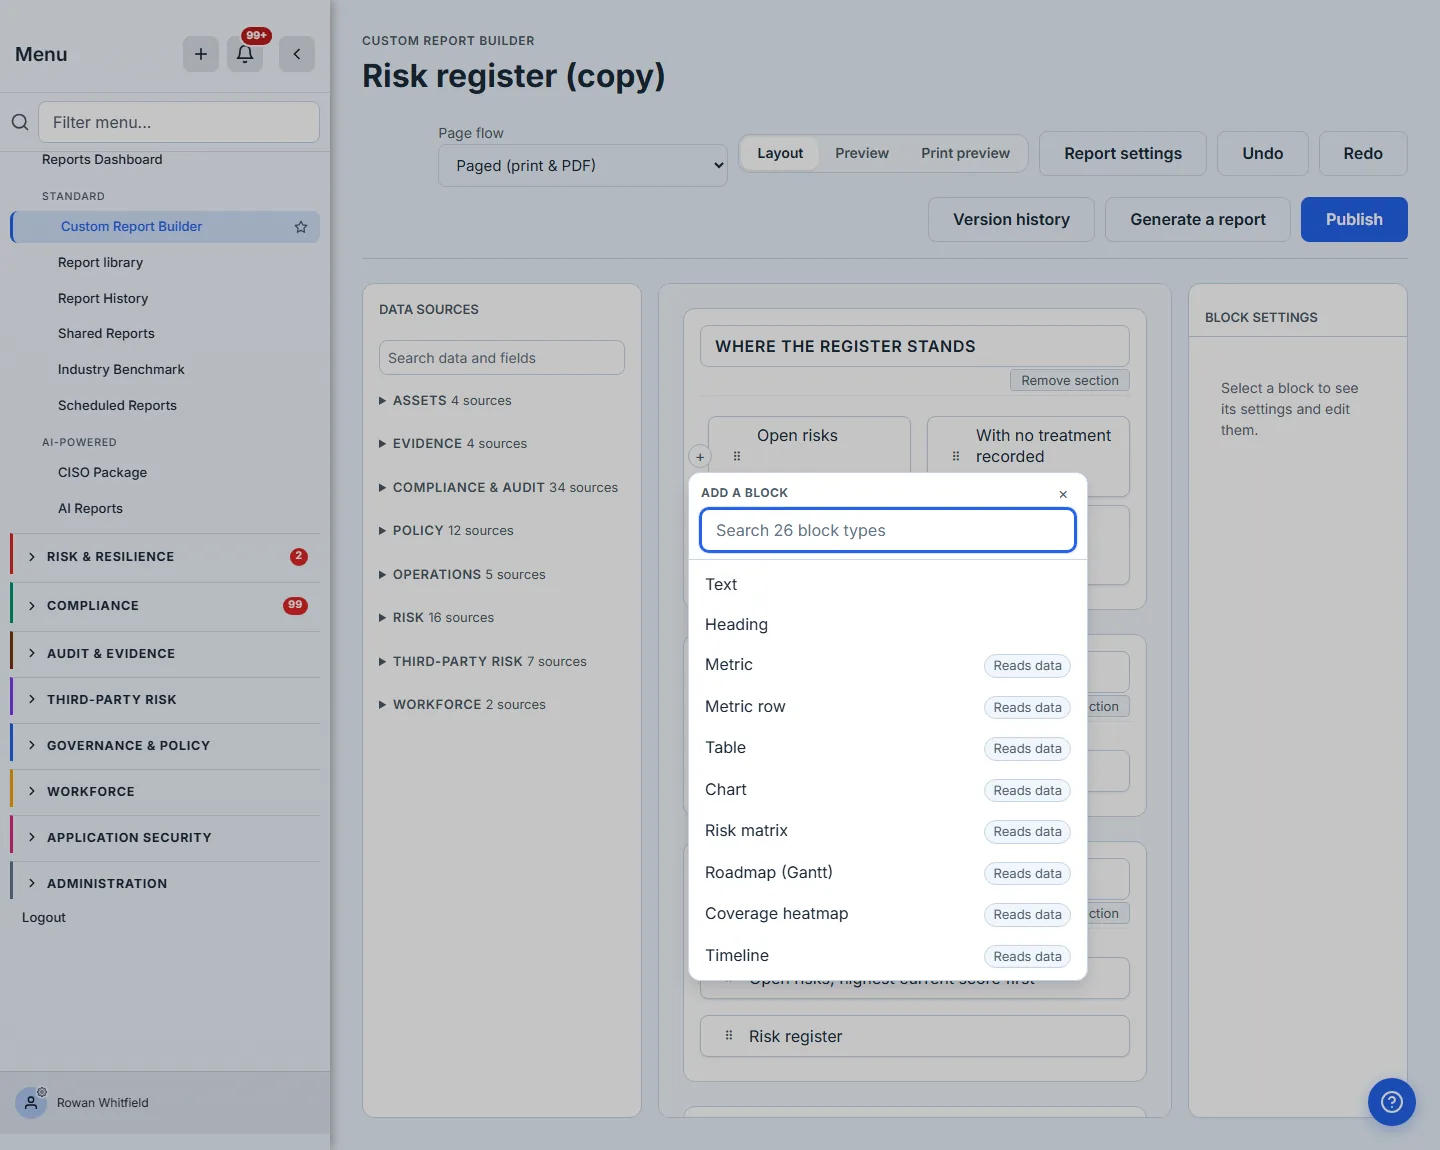
Two of the thirty the registry defines never appear: the builder withholds two types the renderer cannot yet draw, rather than offering a door that ends in a blank space on a finished PDF.
The Reads data chip is doing real work. A block that reads data cannot be inserted on its own — the document would be invalid the moment it was saved, and autosave would fail a second later. So those types open a second step first, and the block arrives already bound. The chip says which ones on the item itself, rather than leaving the list to be decoded.
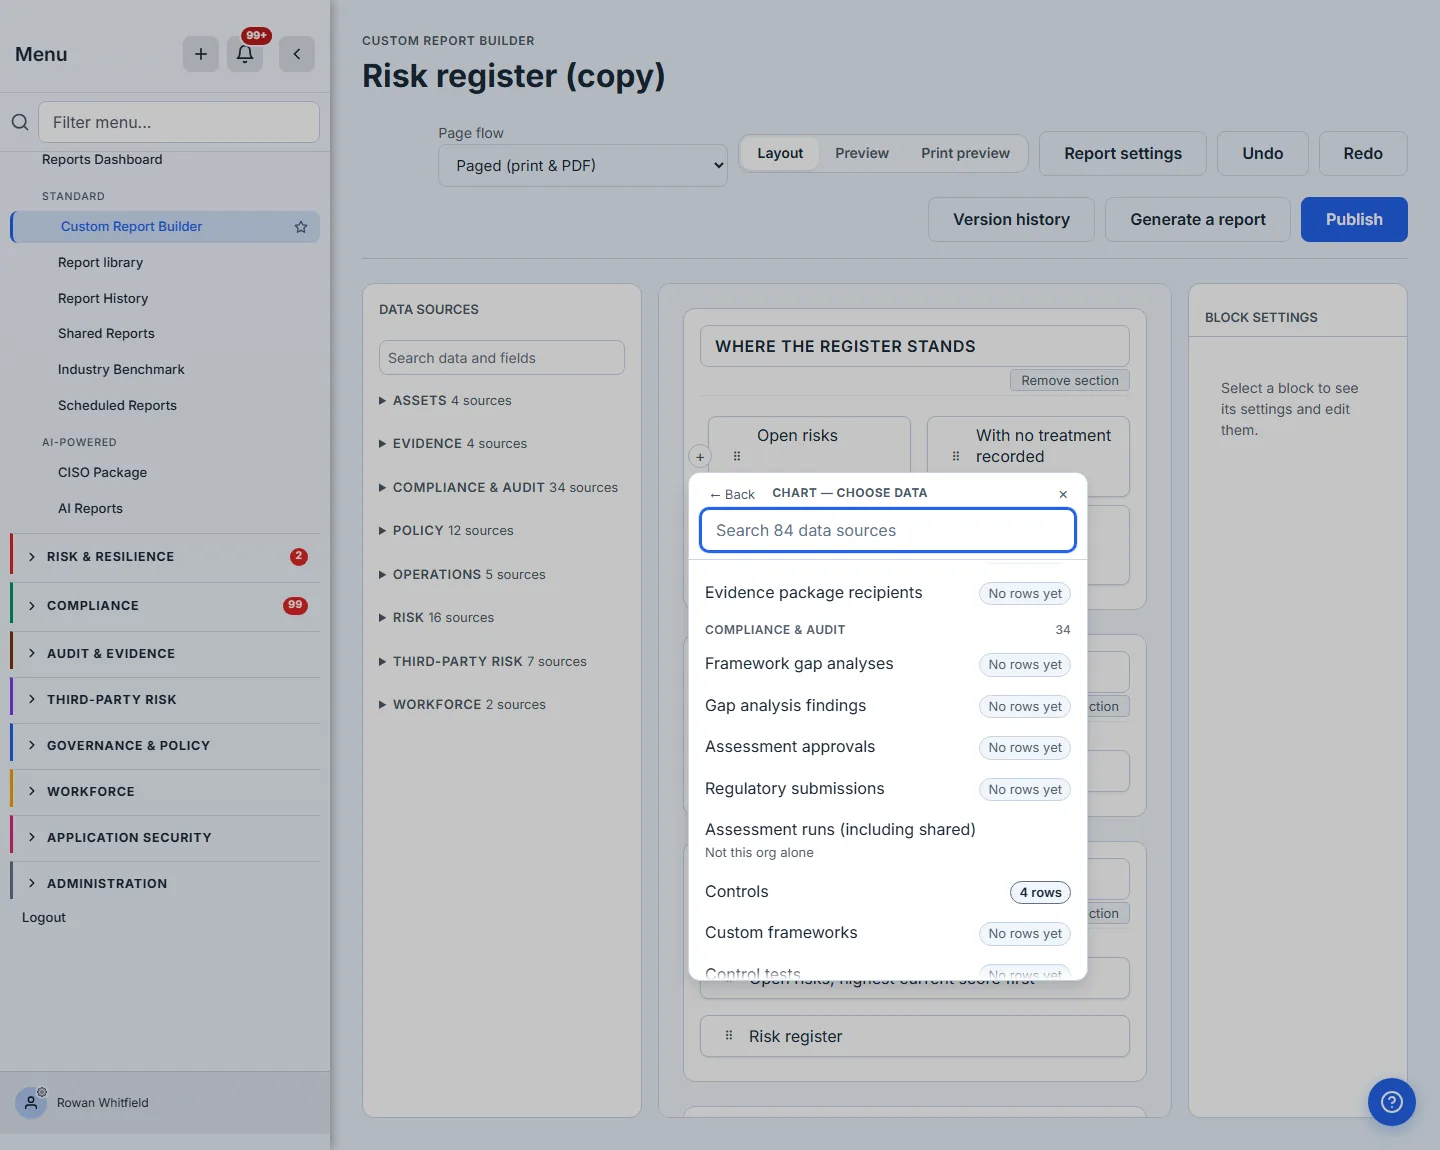
The grouping is the registry’s own, not a list kept beside it, and the list is filtered to what your organisation can actually read. A data source you cannot see is not offered, and the server checks again at generation time regardless.
Each source also says what it holds here — “4 rows”, or “No rows yet”. That matters at the moment of choice rather than after it: a source your organisation has never populated will produce a figure with nothing in it, and a picker that stays silent about that lets you find out from the finished report. The counts arrive in one query for the whole list, so the answer costs the same whether you can read eight sources or all of them.
A few answer differently: “Not this org alone”. Seven sources are not scoped to a single organisation, by two different mechanisms: five read records other organisations have shared with you — assessment runs and the four gap-analysis sources built on them — and two are benchmarks that pool anonymised data across customers. For all seven, “how many rows do we have” has no answer for them, and a number would have to be invented to give one. That is worth knowing before the source goes into a board pack: what it returns will not be only yours.
Step 3 — What a block reads
Select any block and the right-hand pane shows its settings.
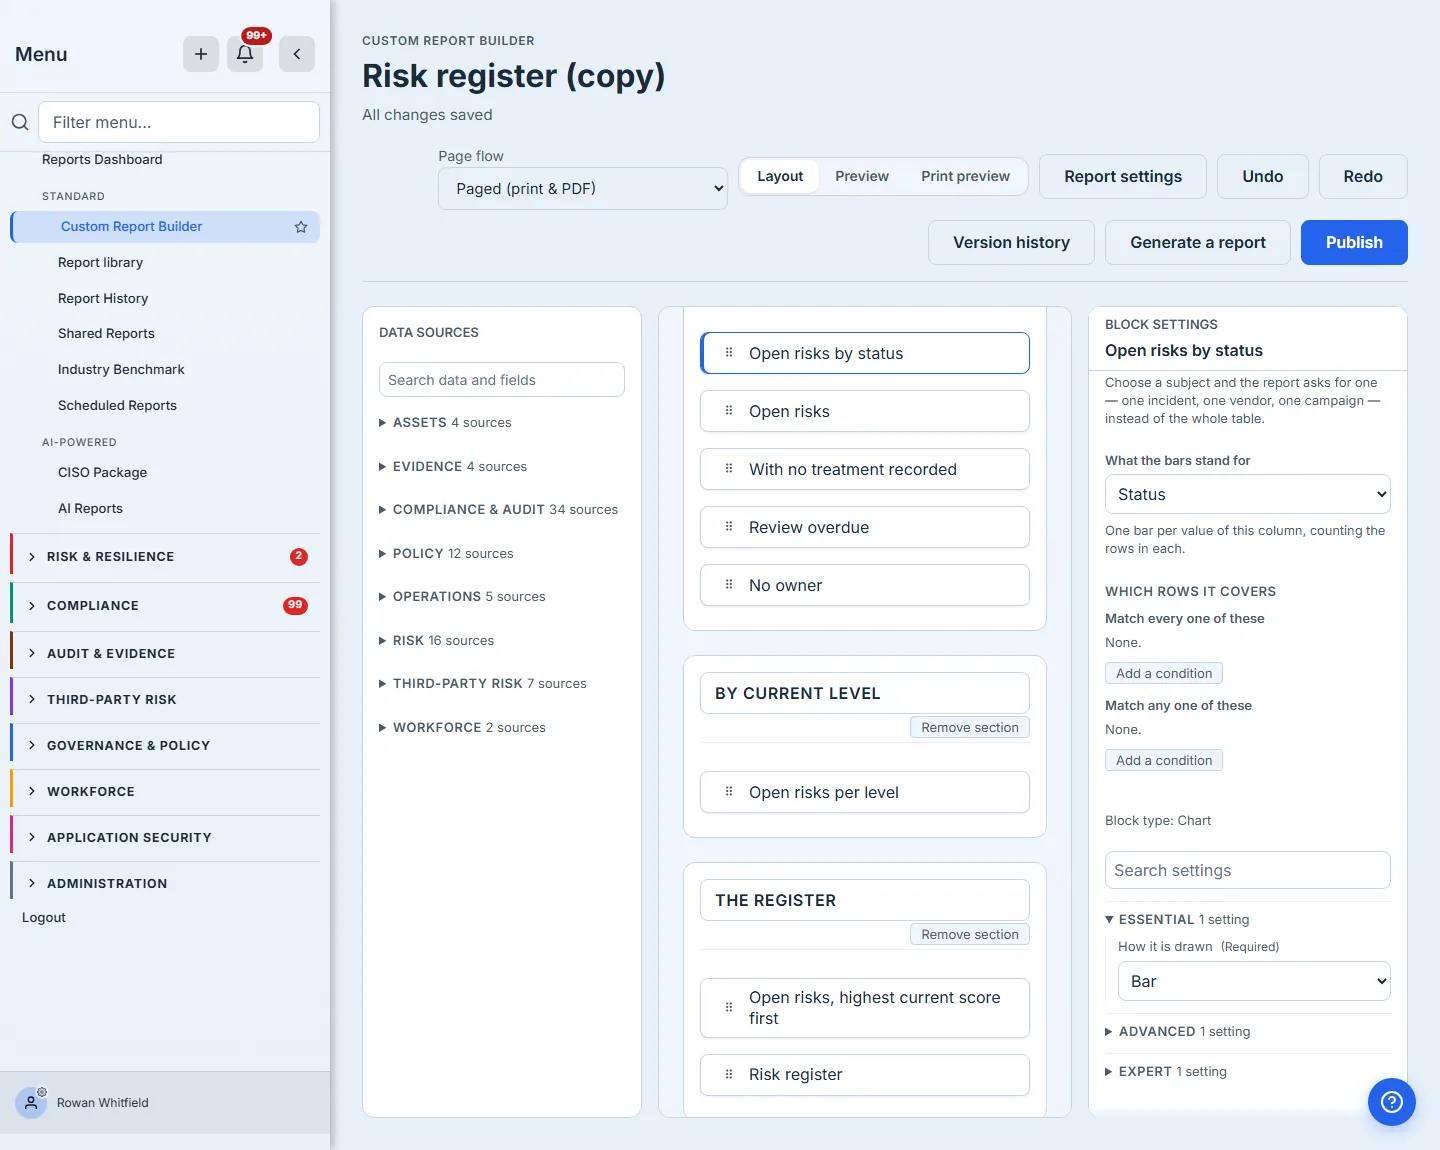
It opens by naming the dataset the block reads and linking to where you would change it. That link matters more than it looks: rebinding a block is a different operation from configuring it, and mixing the two is how you end up with a chart pointing at a column that no longer exists. Every block also takes a title, printed above it on the page — leave it empty and the block prints without a heading, which is right for a block whose section title already names it, and wrong for a chart, where an untitled plot leaves the reader to infer what is being counted.
A chart carries one more decision: what the bars stand for. A category chart counts rows into groups, so it needs a column to group them by — status, lifecycle stage, business unit. The list offers the columns that can actually be grouped on, so an identifier like the risk’s own reference number is never among them: grouping by something unique gives you one bar per row and tells you nothing.
Below that, the settings are banked in three tiers. Essential is what you must decide; Advanced and Expert are collapsed until you want them. The tiers come from the same schema the validator enforces, so a control that appears here is one the document accepts.
Step 4 — Report on one subject
Most reports cover everything. Some cover one thing: the evidence attached to this incident, the policies this campaign distributed, the contracts with this vendor.
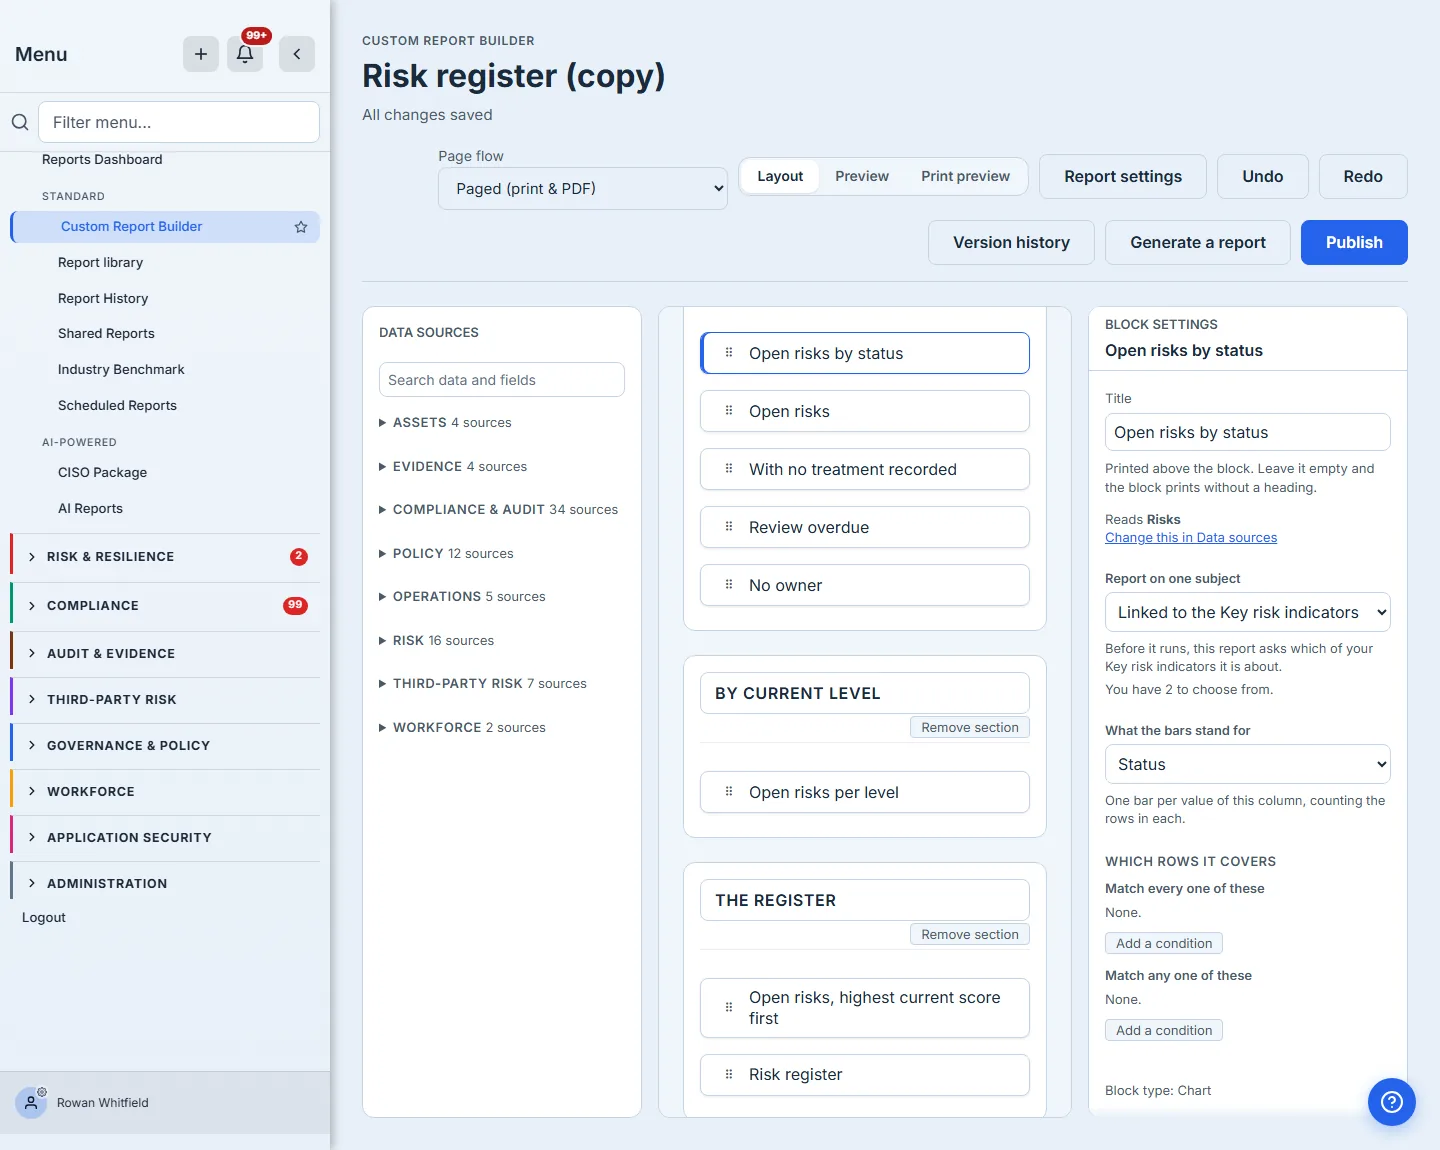
The choices are computed from relationships the data model actually declares, so an option offered here is one the query can be built from. Choosing a subject also adds the question the report will ask for it — the two are one decision, and a report scoped to a subject that never asks which one would fail the moment somebody ran it.
Step 5 — Which rows it covers
Under the subject control is the filter: which rows of that data source this block counts. Every block has its own, so this step moves to the register table — the chart above it has no conditions to look at. (It is not unfiltered, though: step 4 scoped it to one subject, which is a different mechanism and lives in the control above.)
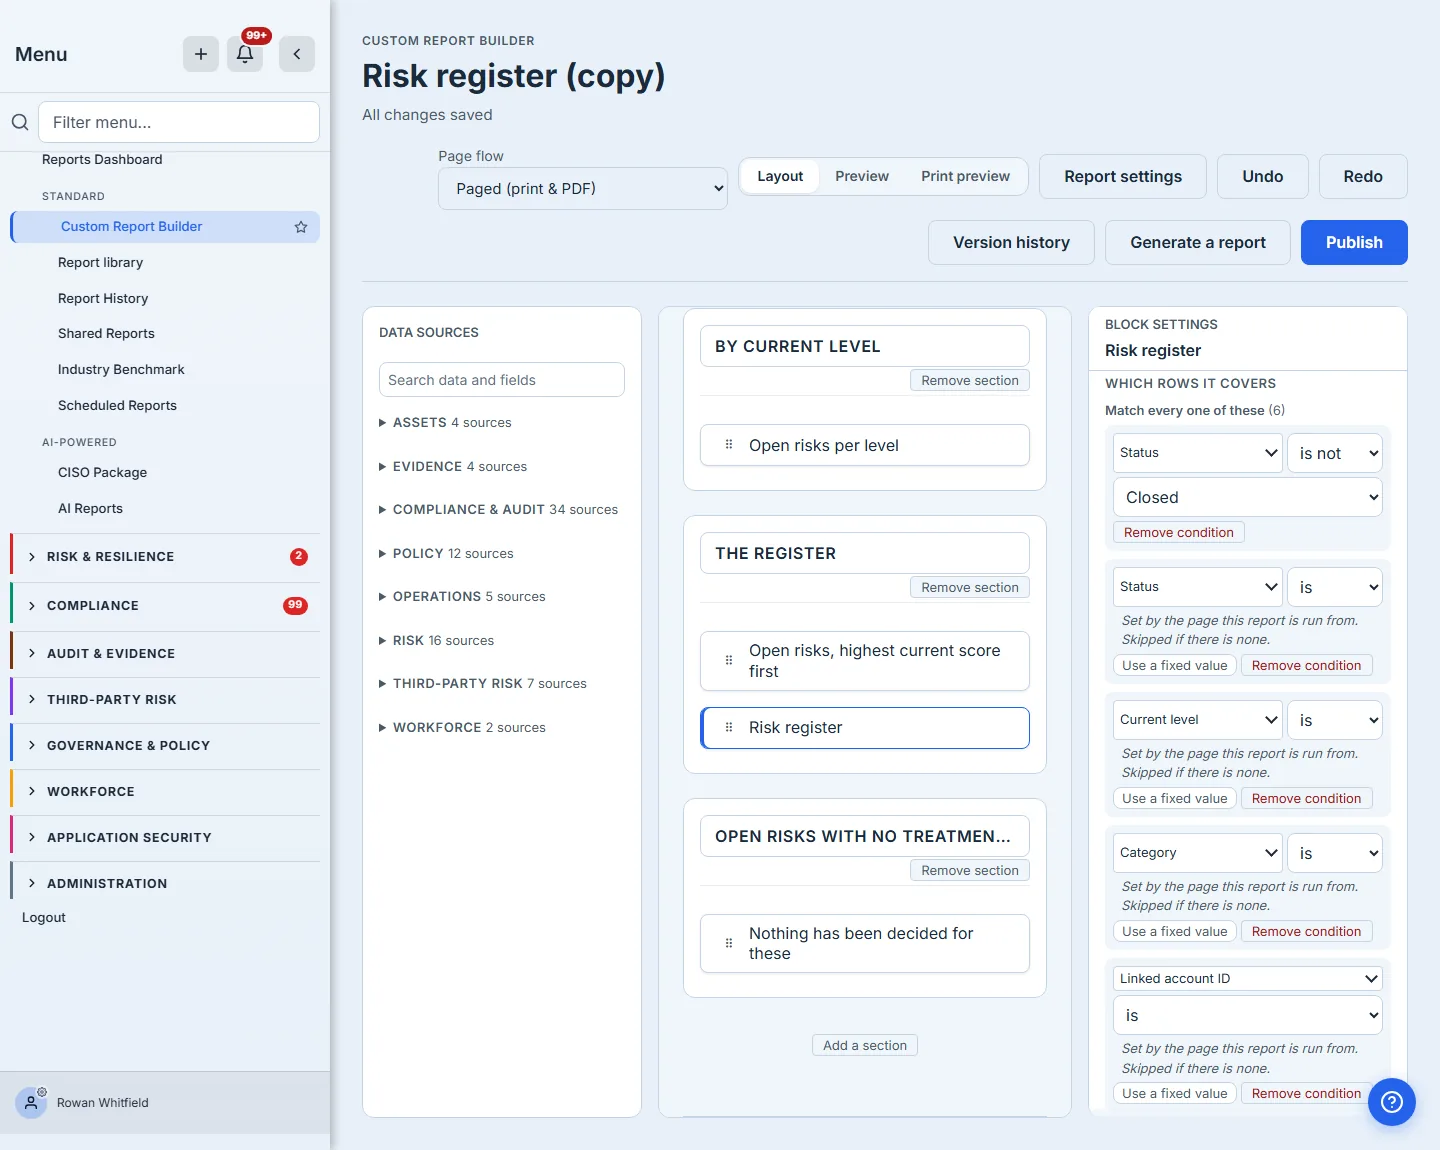
Two kinds of condition appear here, and the difference is worth understanding. Most take a value you supply — a picker where the column has a fixed set of states, a box where it does not. Some take their value from where the report was run from — open a vendor, choose “Report on this vendor”, and the vendor is already the answer. Those conditions say so in place, name what supplies them, and offer a single control to take one over if you want a fixed value instead. A condition whose value arrives from somewhere else should never look like an empty box you forgot to fill.
The operators are the ones the query engine implements, and each takes exactly what it needs: nothing for “is empty”, two boxes for “is between”, a comma-separated list for “is one of”.
Step 6 — Sections decide the shape of the document
Blocks live in sections, and sections carry the decisions about the page rather than the data: how many columns the section lays its blocks out in, whether it starts on a new page or is kept whole, whether it appears in the contents, and what the report does when every block in it comes back with no rows.
The one worth seeing is further down the pane. A section can be optional — marked as one the person generating the report may leave out — and that decision unlocks the next: whether it arrives already ticked in the list they choose from. A template that carries the seat-by-seat table for the IT copy and not the one that goes to a vendor is one section and two answers, rather than two templates that drift apart.
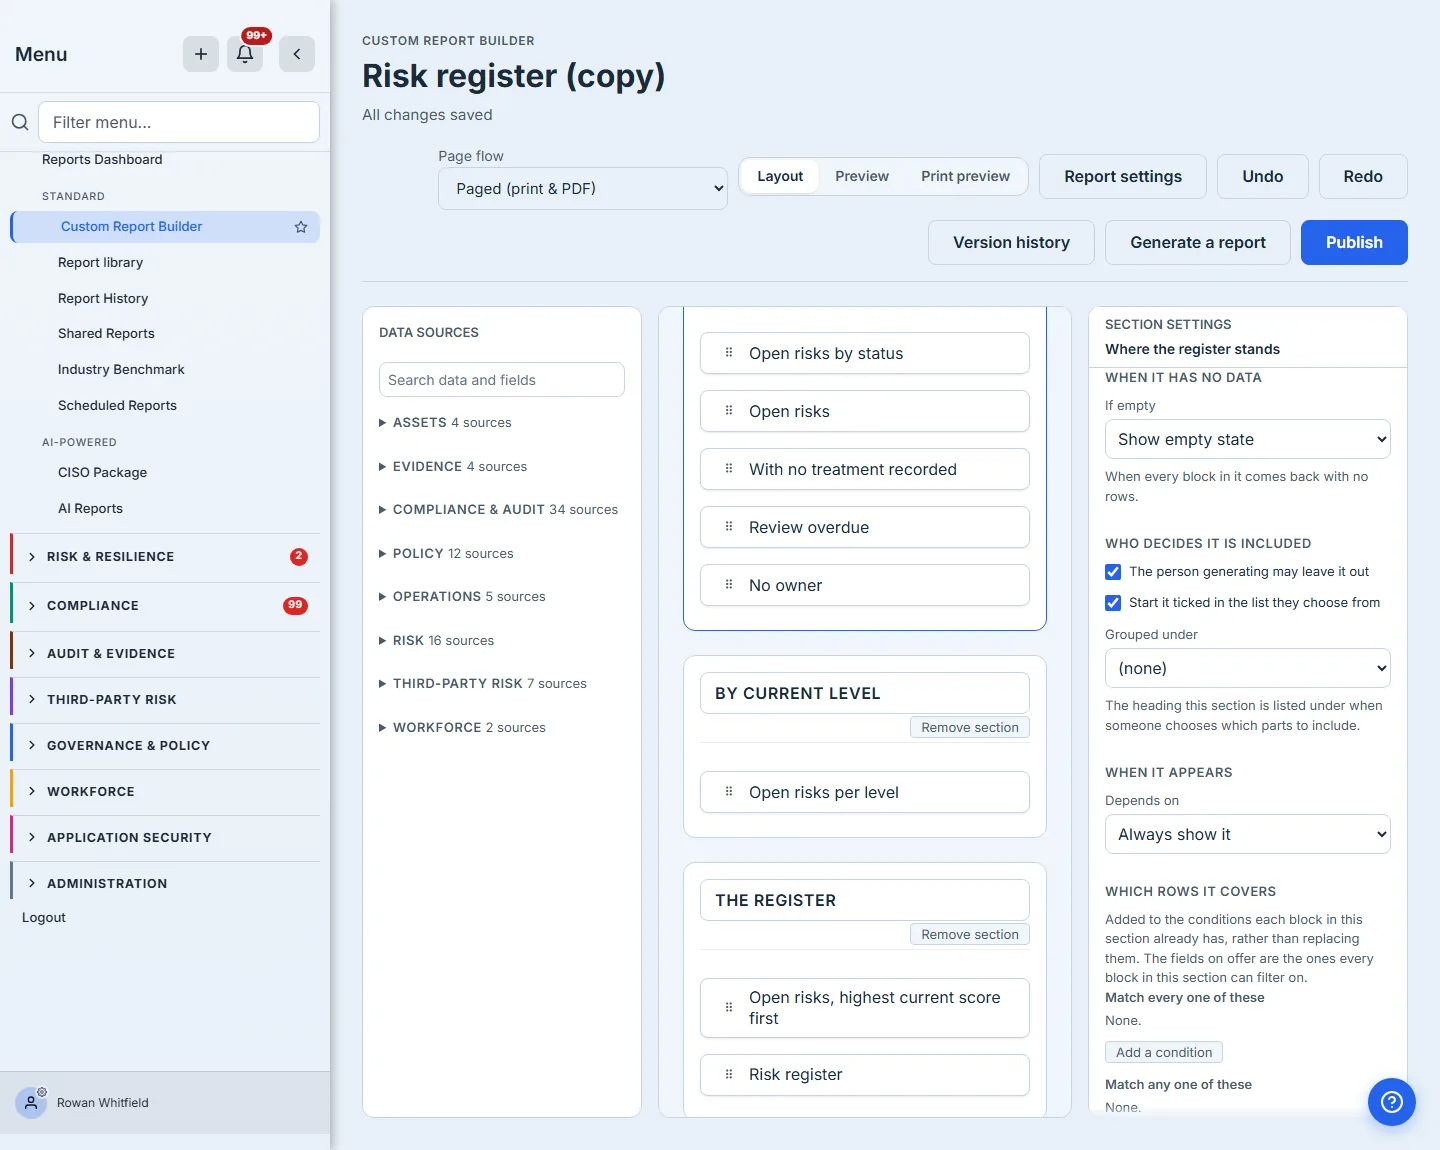
Two of these are worth calling out. When it has no data decides between showing an empty state and dropping the section — and dropping it is never the default, because a board pack that silently loses a section leaves the reader unaware anything was missing. Who decides it is included lets a section be optional, so the person generating can leave it out of the copy that goes to a vendor while keeping it in the one that goes to the IT team.
A section can also carry its own filter, which is combined with each block’s:
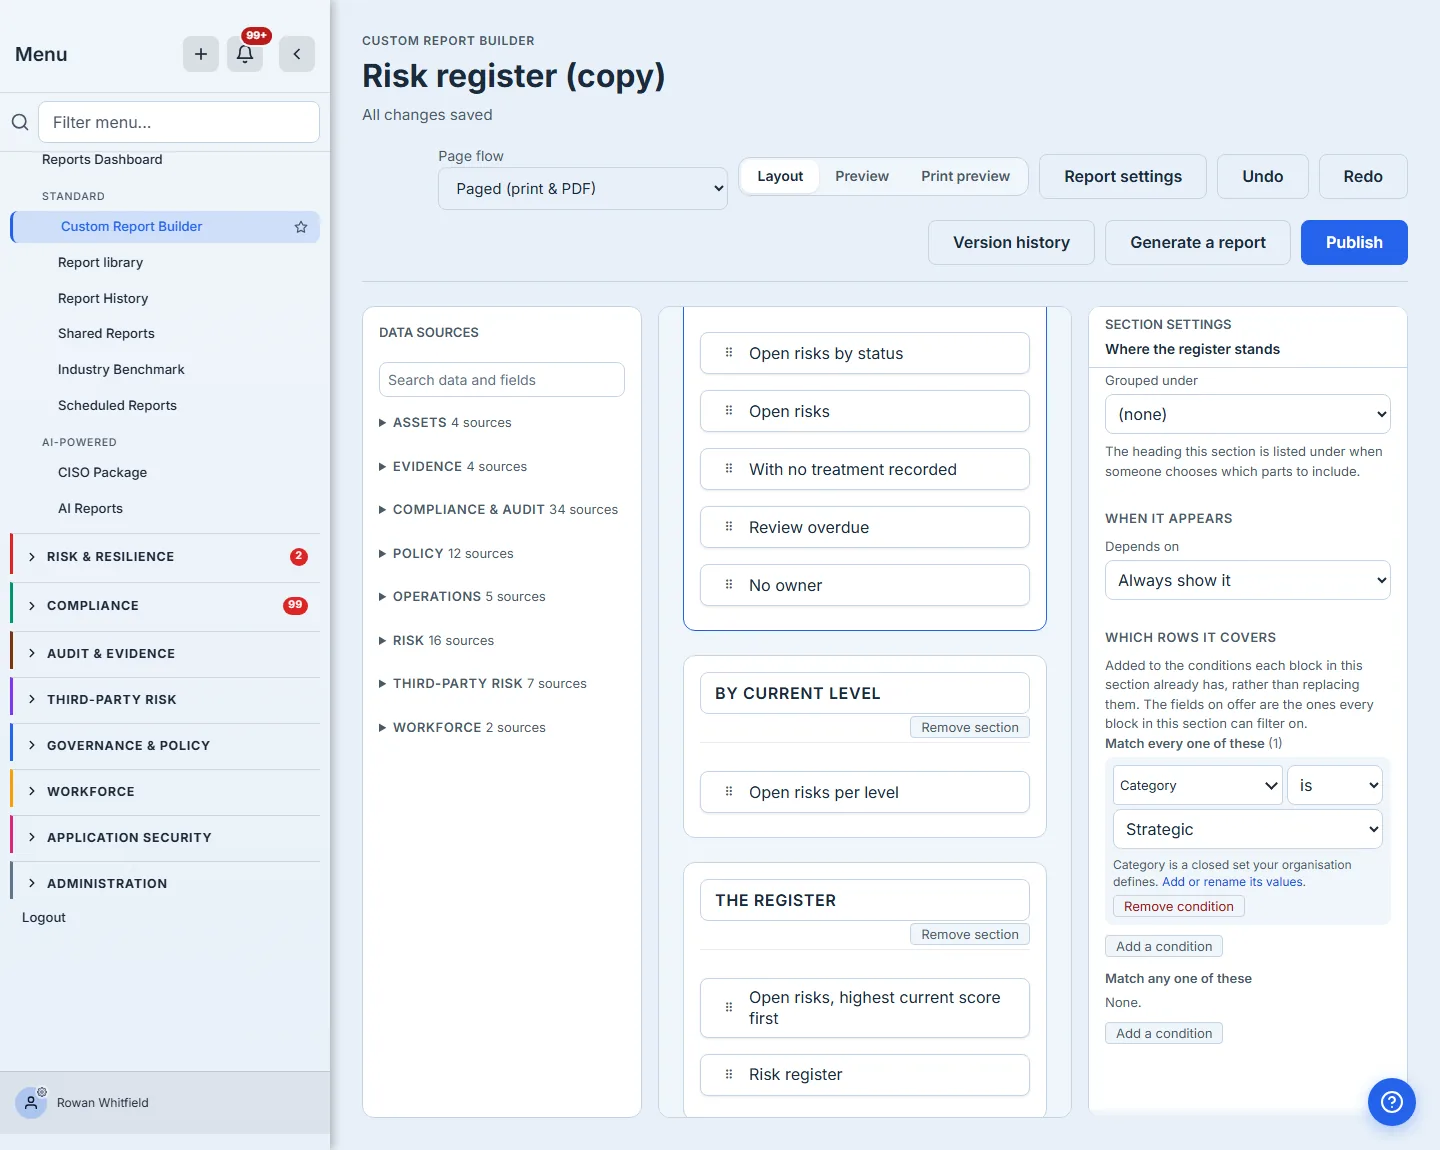
The fields offered are the intersection across the datasets the section’s blocks read — not the union, and the pane says so rather than leaving you to infer it. Offering a field that only one of them has would author a report that fails to generate for the others.
The value is a picker, not a box to type into. Category is a closed set — your organisation’s own taxonomy, editable in settings — and a filter you have to guess the spelling of is a filter that silently covers no rows.
Once a section holds more than a block or two, moving them one at a time stops being the way to work. Select several — click, then shift-click the last — and the block actions menu answers for the whole selection: every verb names how many blocks it will act on, and the sections it offers to move them into are the other sections of this report, by name.
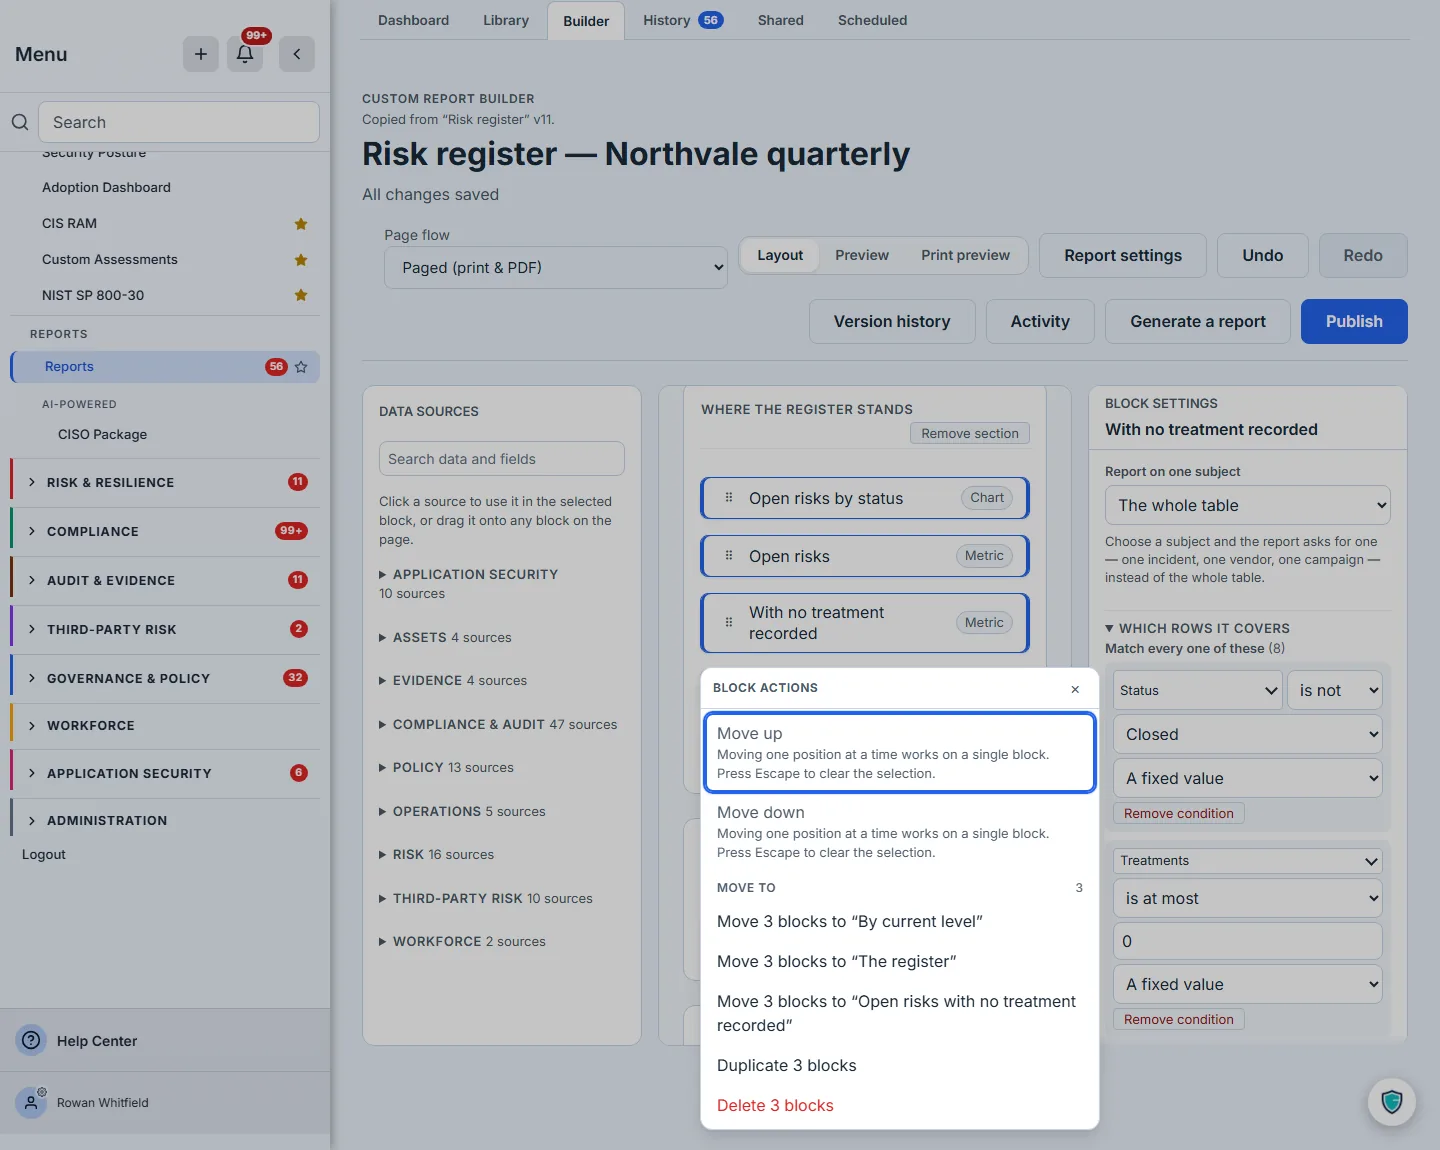
Two details are deliberate. A verb that cannot apply to a multiple selection says why instead of disappearing or failing silently, and the destructive one is the only red label in the menu — a count and a colour, so “Delete 3 blocks” cannot be read as “Delete this block”.
Step 7 — What the report asks before it runs
A report can ask for something before it runs: a date range, an entity, a choice from a list.
Report settings opens with what the report is called — its name, the description that appears on its card in the library, and the area it is filed under. The frame below picks up just beneath them, at the group that matters here.
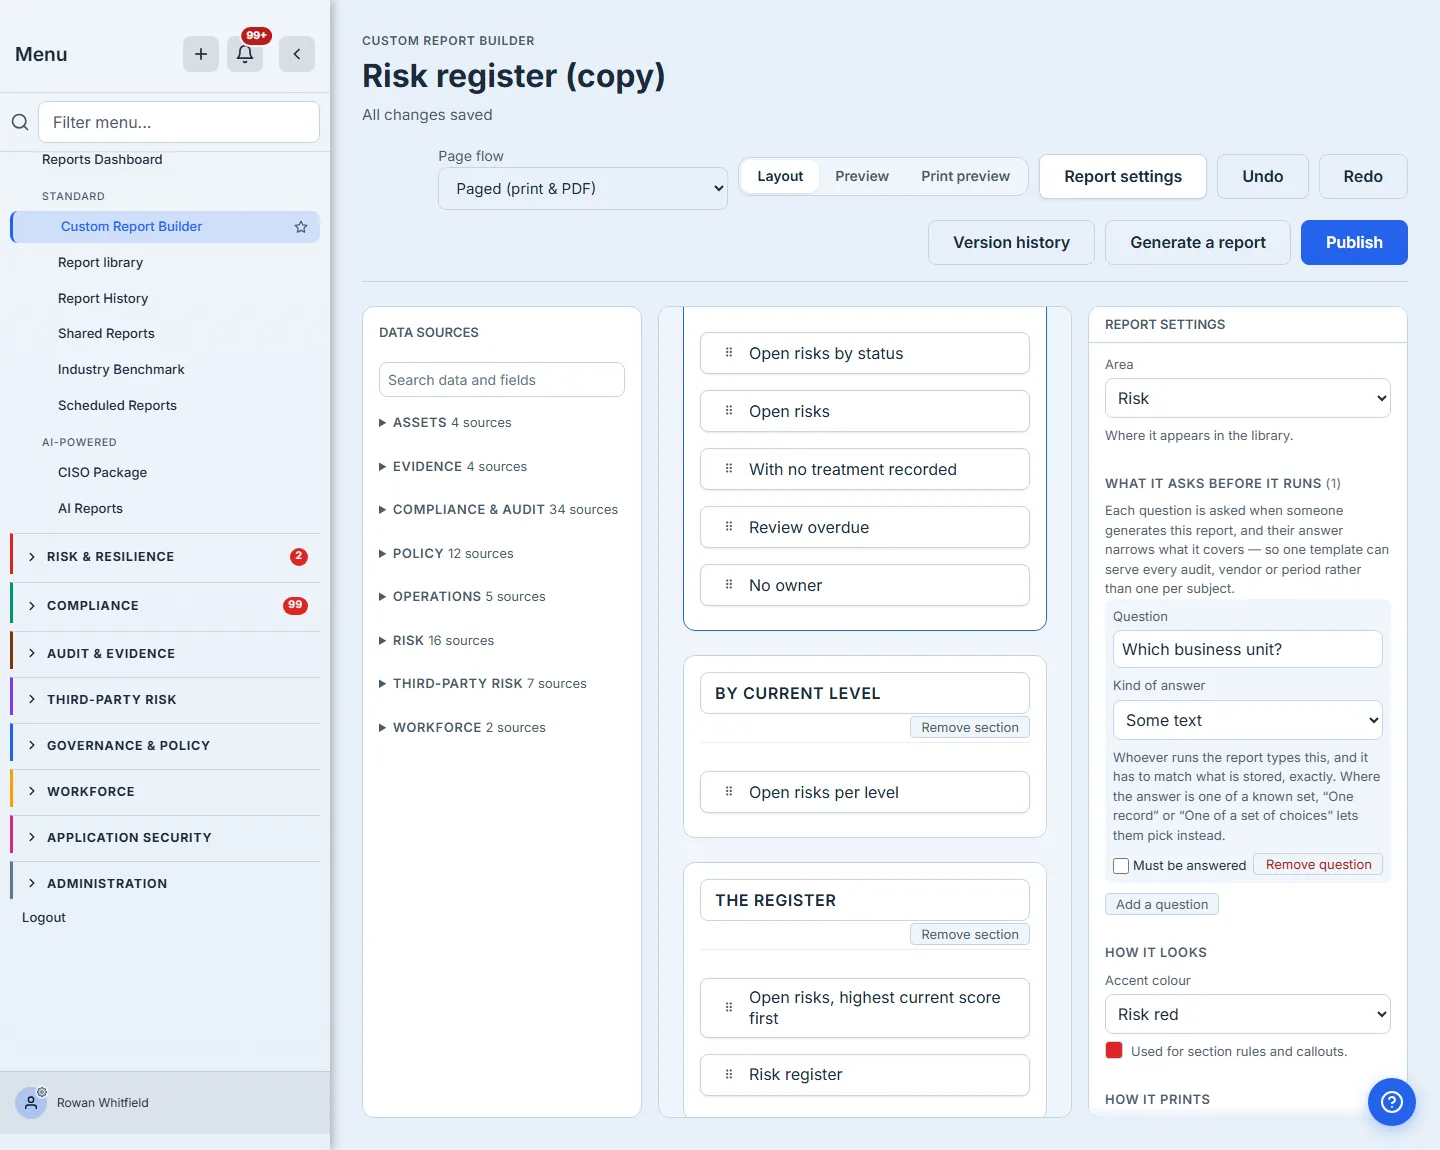
This is where a single-subject report gets its subject. It is also how one template serves a dozen uses: “which audit is this about” turns one audit report into an audit report for any audit. A report that asks nothing runs across everything the organisation has, and says so.
The kind of answer is the decision worth pausing on. “One record”, “One of a set of choices” and “A date range” all hand the person running the report the values that exist, so they cannot miss. “Some text” cannot: it has to match what is stored, exactly, and “Acme Financial” against a row reading “Acme Financial Services Ltd” produces an empty report and no error anywhere. The pane says so where you choose it, naming the two kinds that hand over a list to pick from. It is still right for a question whose answer is a title or a note — you are the one who knows which this is.
Declaring a question and using one are two steps, deliberately. The question above is declared here; it starts doing something when a block’s filter or a subject scope reads it — which is exactly what step 4 did when choosing a subject added the question the report asks for it. Declared and unread, it is a prompt the reader answers and the report ignores, which is worth knowing before you add one.
Reading one is the other half, and it is done in the block’s own filter. A condition’s value can be a fixed value or the answer to one of the report’s questions, chosen from the questions this report declares — so the filter narrows differently every time the report is run, without a second template. The row then states which question it reads, and what happens when that question is left unanswered.
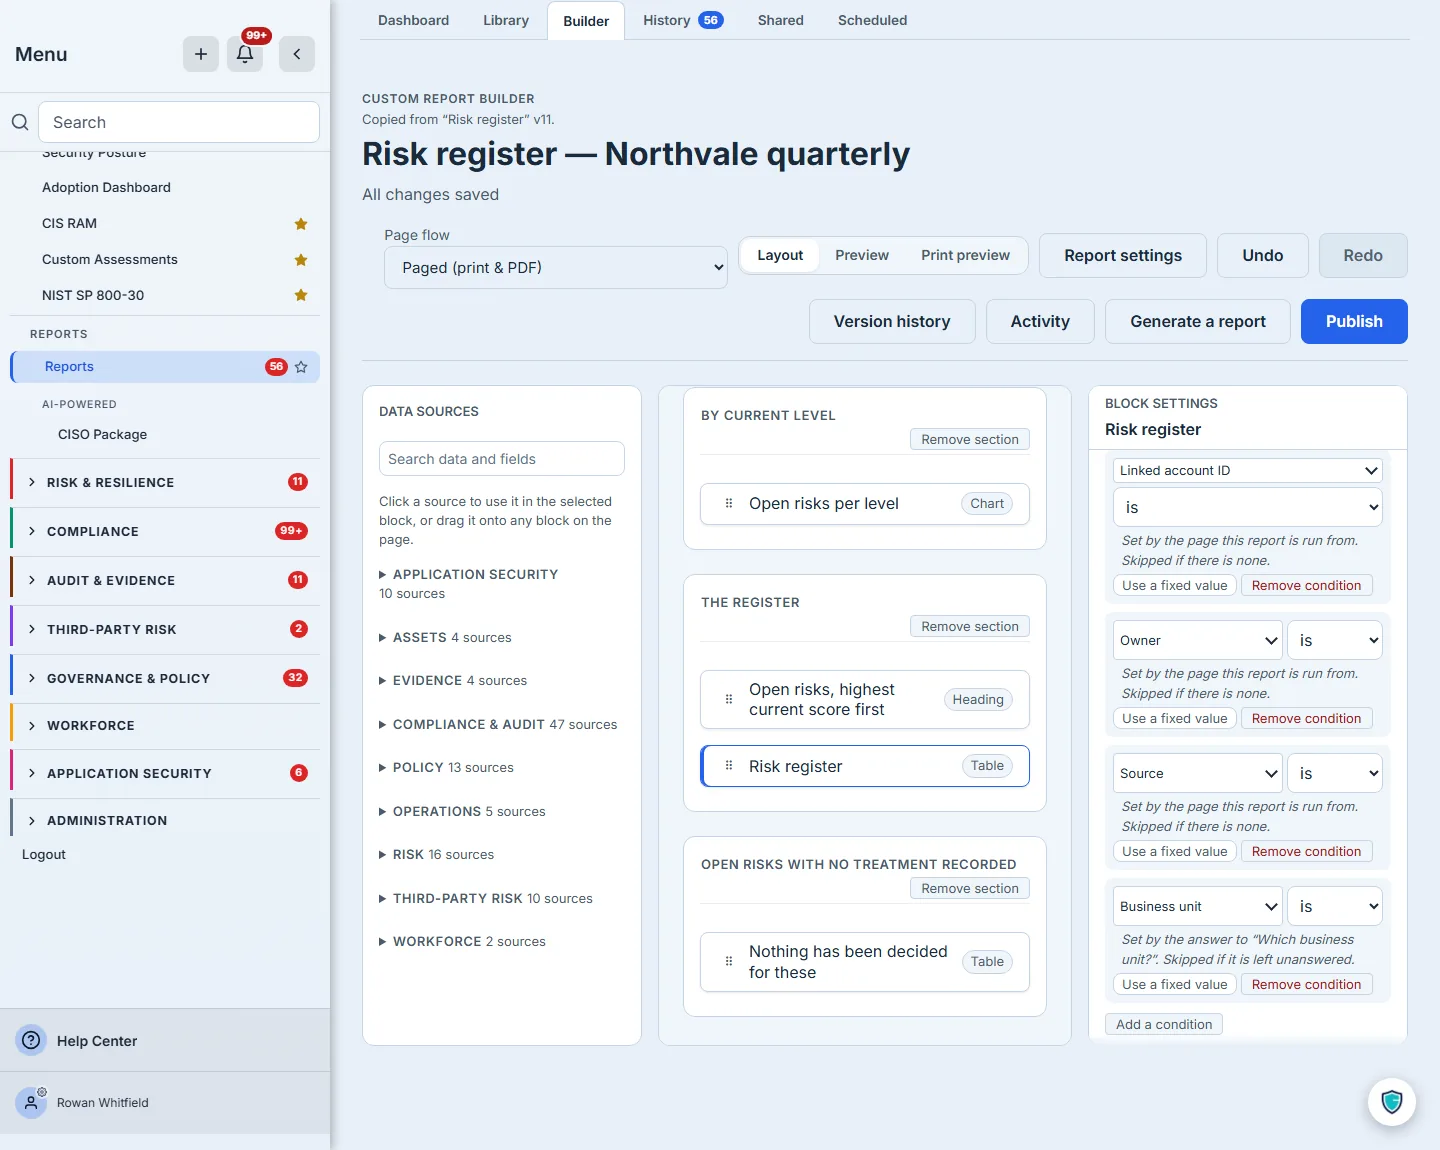
That last sentence is the one to read twice. A question the person generating may leave blank skips its condition rather than refusing the report — the rows simply are not narrowed by it — and a question marked as one that must be answered says so instead. Which of the two you want is a real decision: a quarterly pack that should cover everything when nobody picks a business unit, or a single-subject report that must not run at all without one.
Step 8 — What it is called, where it lives, what it discloses
The same pane carries the report’s identity. The area is where it appears in the library — filing a report wrong is filing it away. The accent colour comes from the product’s own palette rather than a colour picker, so a report looks like the module it belongs to: it draws the rule under each section title and carries the callouts. Charts are deliberately left out of it, because their colours are already carrying meaning. In a chart of several series the colour says which series a bar belongs to. In a chart of one series grouped by a rating — open risks by level, findings by severity — the colour says which rung, on the same red-amber-green ramp the risk register uses, so Critical is the same red in the board pack as it is on screen. And where the groups are not a rating at all — by status, by owner, by month, which is what the chart in this walkthrough plots — every bar takes the same colour, deliberately: colouring “Assessed” and “Triaged” differently would assert an ordering between them that does not exist. A colour that moved with the accent would break all three.
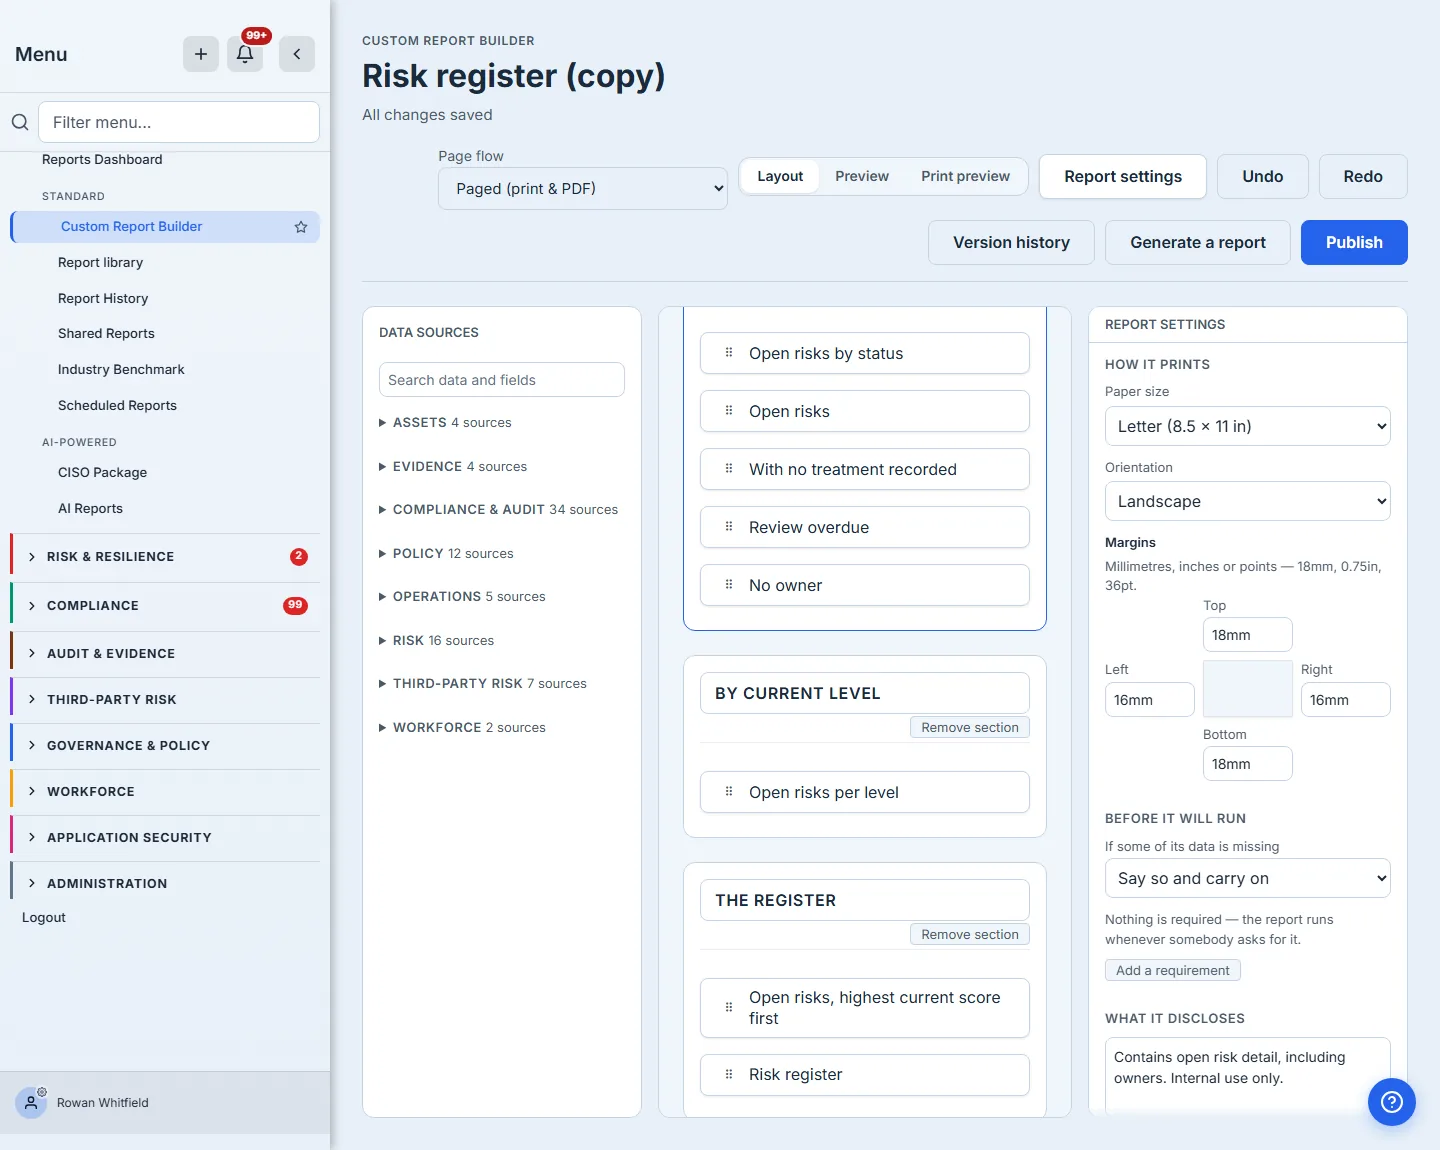
What it discloses is the sentence printed in the confidentiality band on every sheet after the title page — the same rule the running header and the page numbers follow, and for the same reason. Write it for the reader who receives the PDF without context: “Contains open risk detail, including owners. Internal use only.” When the report is generated, the person running it chooses the marking, and a template that carries this sentence opens on “Internal use only” with these words shown.
How it prints is the page itself: paper size, orientation, and the four margins. A4 or Letter, portrait or landscape — a report that a European board reads on A4 and one that a US committee reads on Letter are the same report on different paper, and neither should have to be rebuilt to get there. A report set to the continuous dashboard layout is not offered any of this, because it never breaks into pages.
Step 9 — What it refuses to run without
Some reports should not be produced at all until something is true. An attestation pack signed before the policy it attests to was approved is worse than no pack: it is a document that looks like evidence and is not.
Before it will run is where you say so. A requirement names a data source, how many rows it needs, and — the part that matters most — the sentence shown to whoever presses Generate and cannot. Write it as an instruction, not a diagnosis: “The policy must be approved or published before a governance package can be produced” tells someone what to do; “precondition failed” tells them only that they have hit a wall. The field says so itself, directly above the box — advice that lives only in an article is advice most authors never receive.
Where a report carries more than one requirement, the band states how they combine: all of them have to hold, and one missing is enough to stop it.
The same band answers a narrower question: what the report does when some of its data simply did not come back. The default is to say so on the page and carry on, which is right for most reports. For a regulatory filing it is not — a document that prints “no data” where the evidence should be still looks like evidence to whoever files it — so that report can be told to refuse instead, and the refusal happens in the generator rather than in a disabled button. Three of the one hundred and nine templates we deliver are set that way, and they are the three you would expect: the Article 30 record of processing, and the two SEC cyber-disclosure packs.
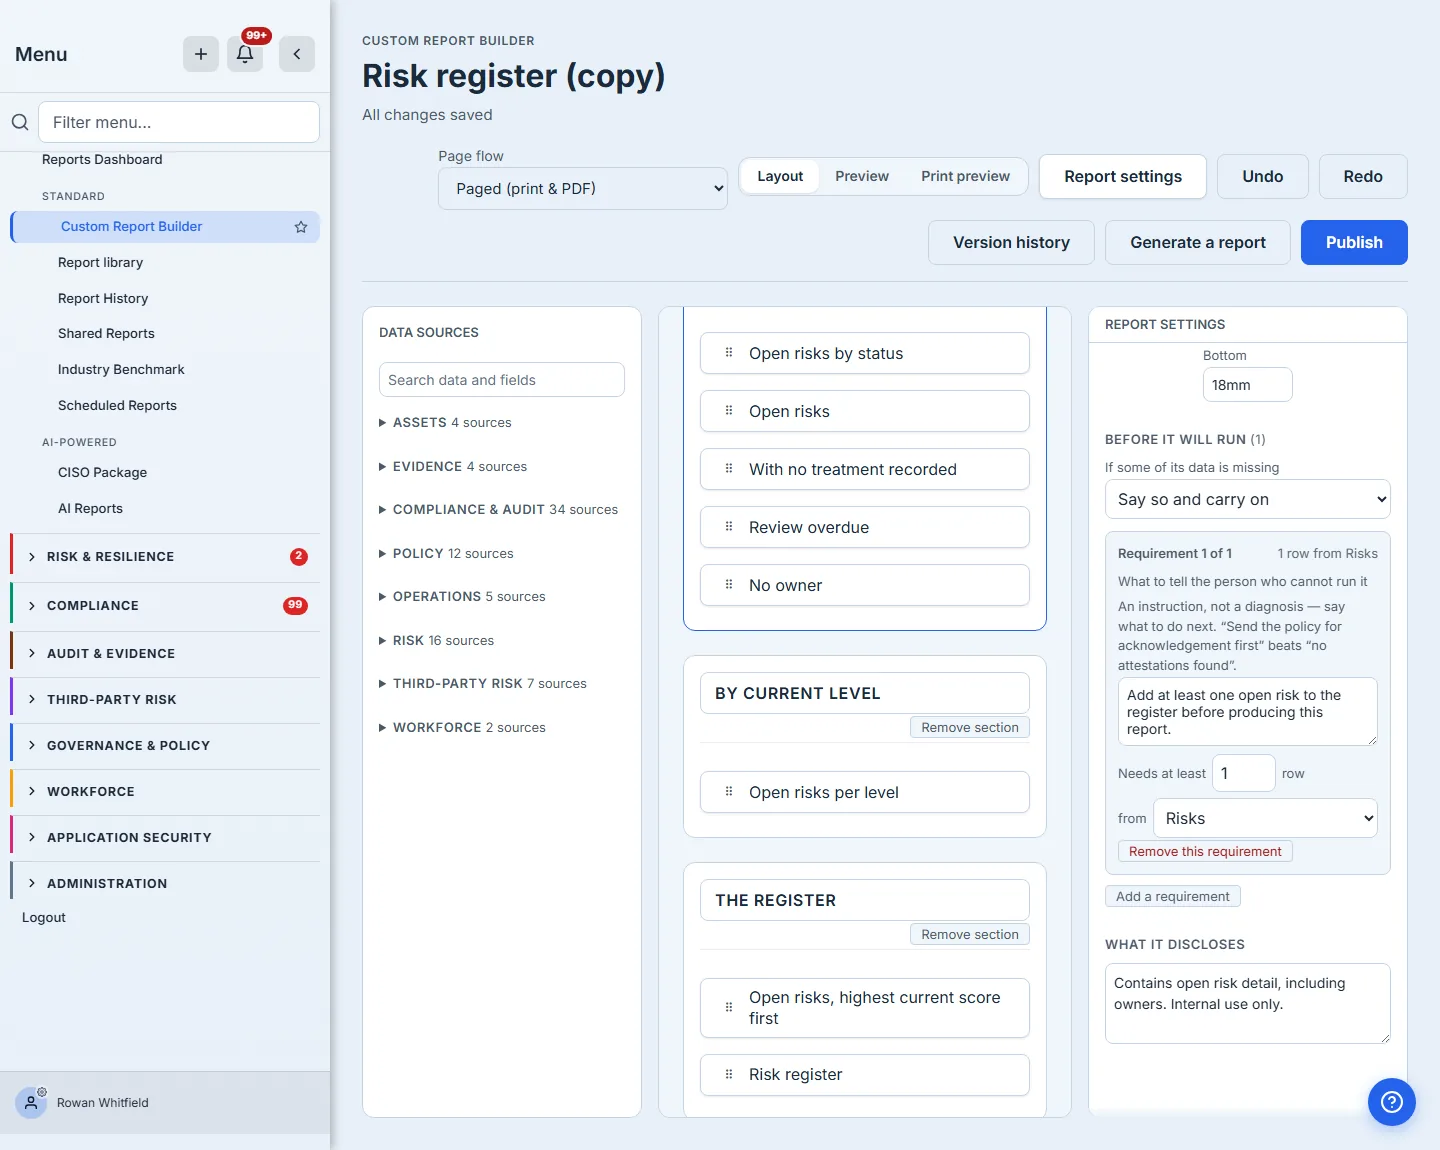
The report refuses on the server, not merely in the button, so a requirement holds however the report is asked for. Twenty-nine of the templates we deliver carry one. A requirement can also hold on alternatives — the policy attestation statement needs either a recorded attestation or an acknowledgement campaign under way, because a campaign nobody has answered yet is still a legitimate report — and a requirement like that is shown as it stands rather than flattened into something narrower.
Step 10 — Values that are lists, not fields
Some settings are not a single value. A metric row’s metrics, a manual table’s columns, a glossary’s terms — each is a list, and each gets a proper editor rather than a text box holding something that looks like code.
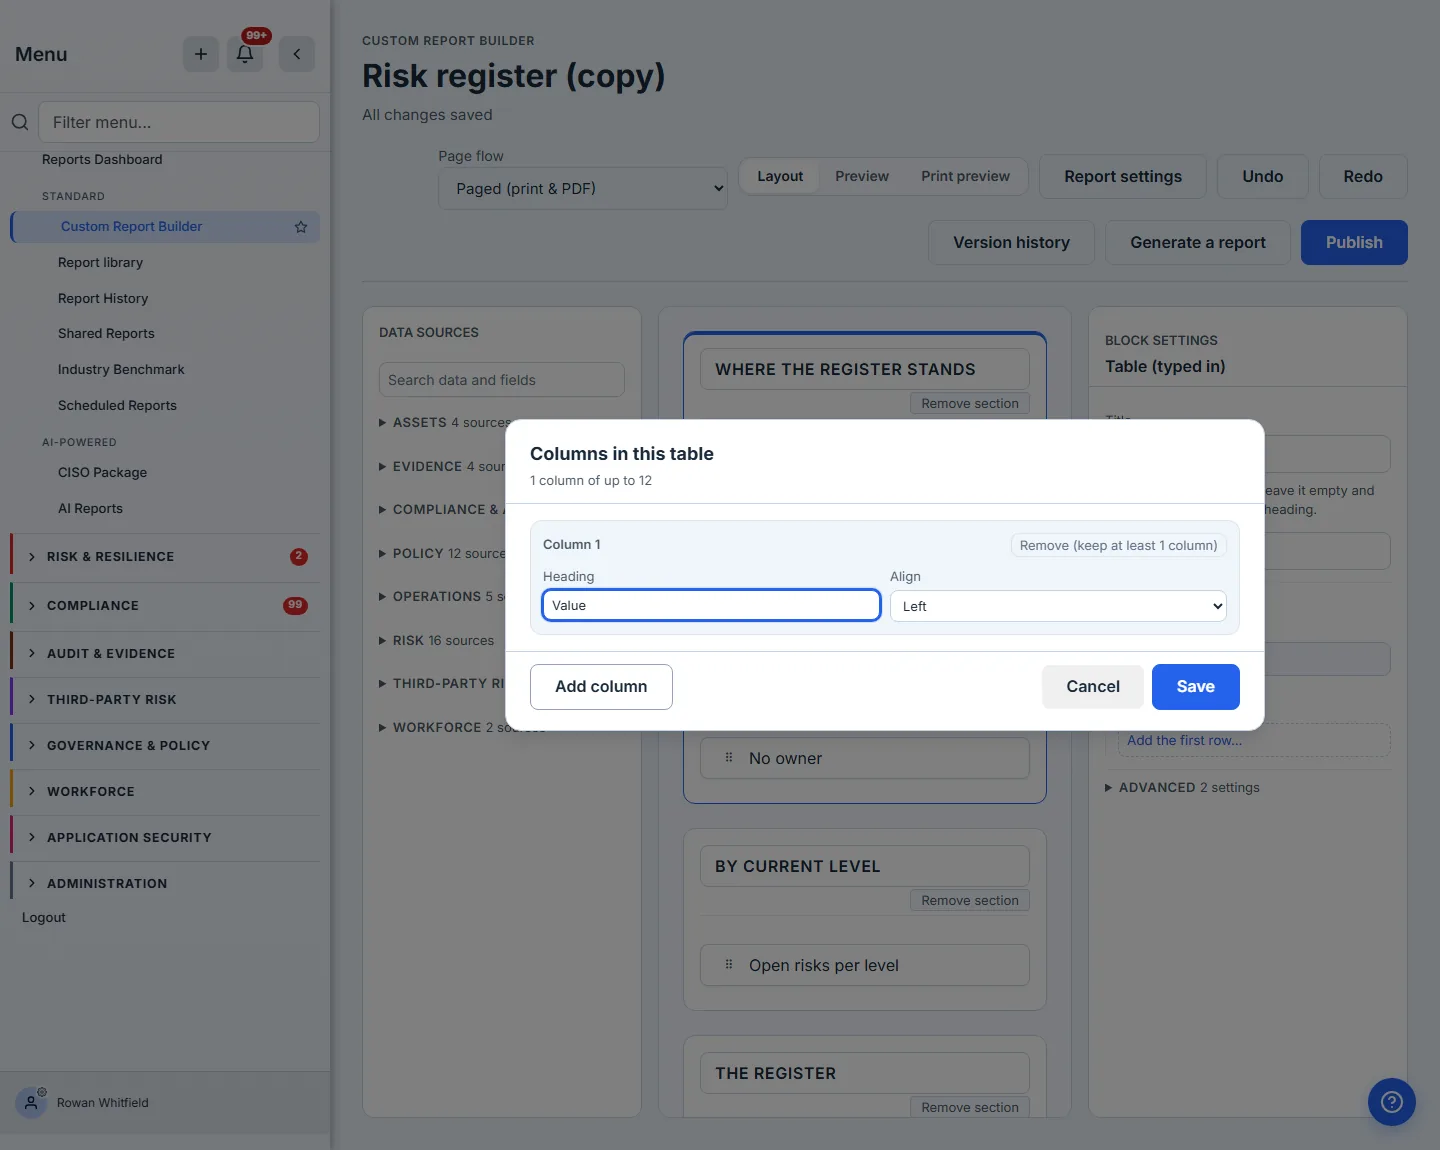
The editor states its limits rather than enforcing them silently: how many you have and how many are allowed, with the remove control disabled and explained when you are at the minimum. Cancel discards, Save applies — and the change goes through the same history as everything else, so one undo takes it back.
Step 11 — See it on the page it will print on
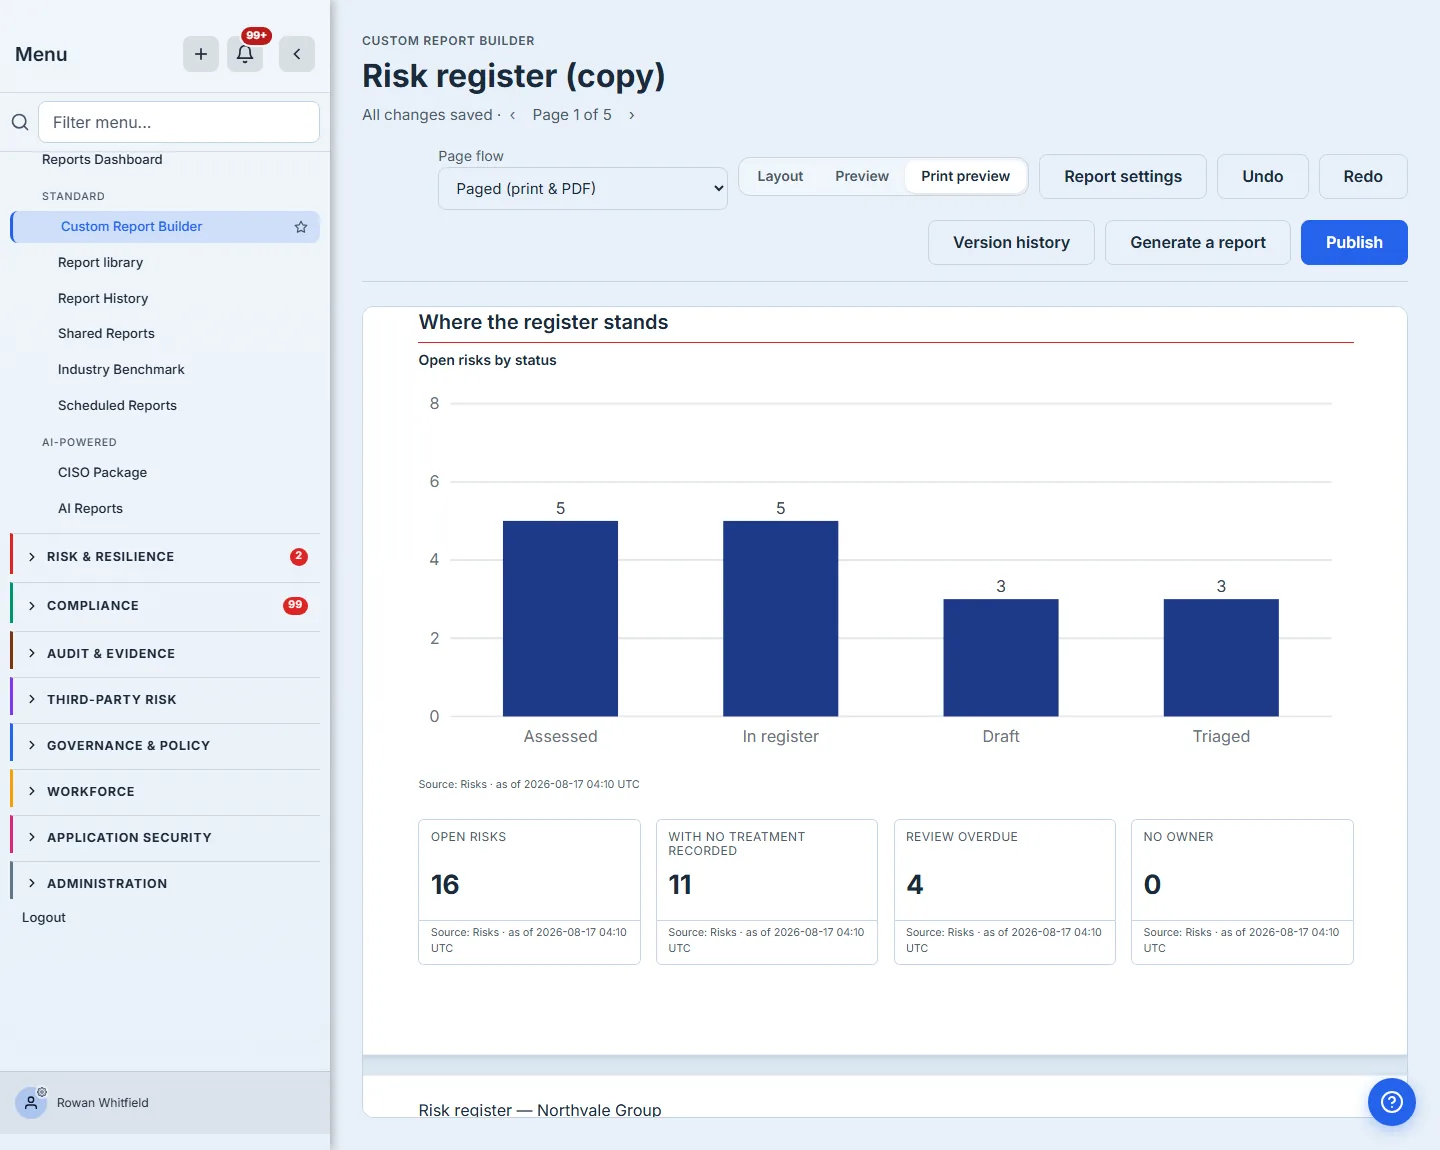
Preview renders the report through the same generator the server uses: same renderer, same data, same figures. What it does not draw is the page furniture — the running header, the page numbers and the confidentiality band belong to paper, and print preview adds them. With one deliberate exception: the FIRST page carries none of them. A title page stamped “Page 1 of 12” is the tell of a generated document, so the running header, the footer and the confidentiality marking all start on the second sheet.
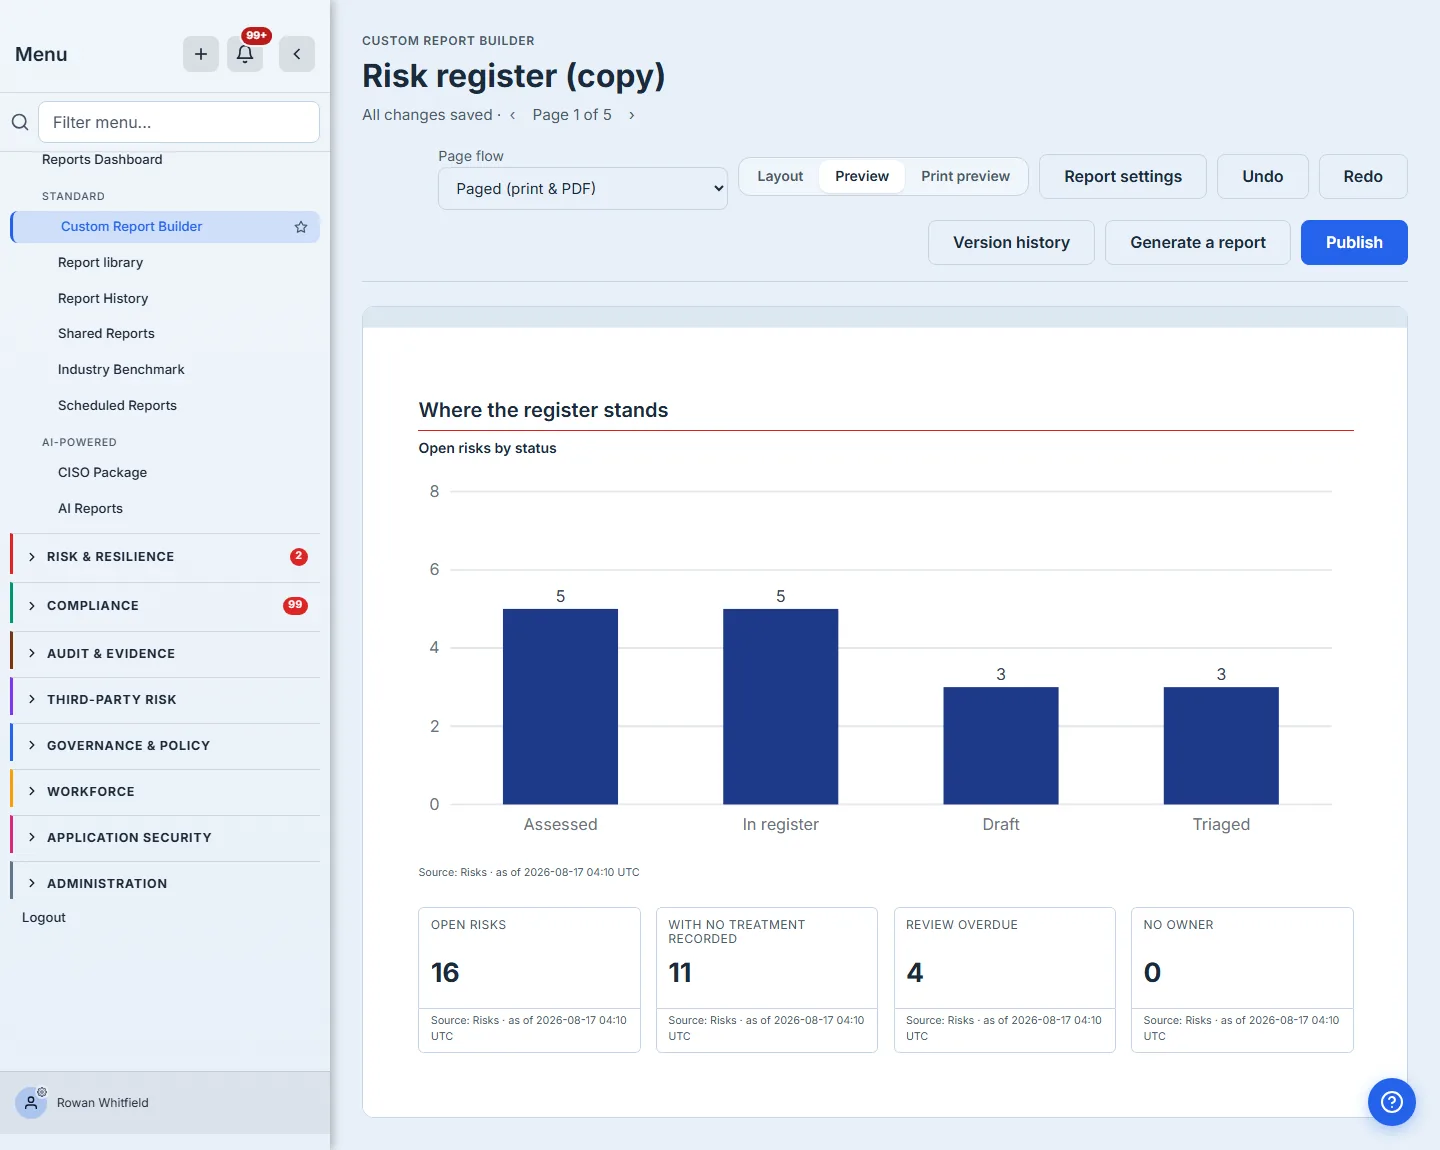
Every figure carries its provenance underneath — which data source it came from and the moment it was read. That line is part of the document, not a debugging aid: a number in a board pack without a source is an assertion.
Both previews paginate — the breaks are the same in each, and they are the same breaks the PDF uses, so a block that sits mid-page here will not break across two in the file you send. What print preview adds is the page furniture, and this is where you see it do its job: the running header repeats on every sheet after the first, and a section heading is never left stranded at the foot of one page with its figure on the next.
What you are looking at is a template rendered against today’s data, not a report — which is why the toolbar offers Generate a report rather than a download. That is the act that writes a document, freezes the data into it, and hashes the pair; the document is what you then export, sign, share or schedule. Previewing a template is how you decide it is right; generating is how you get something to send.
Step 12 — Publish it
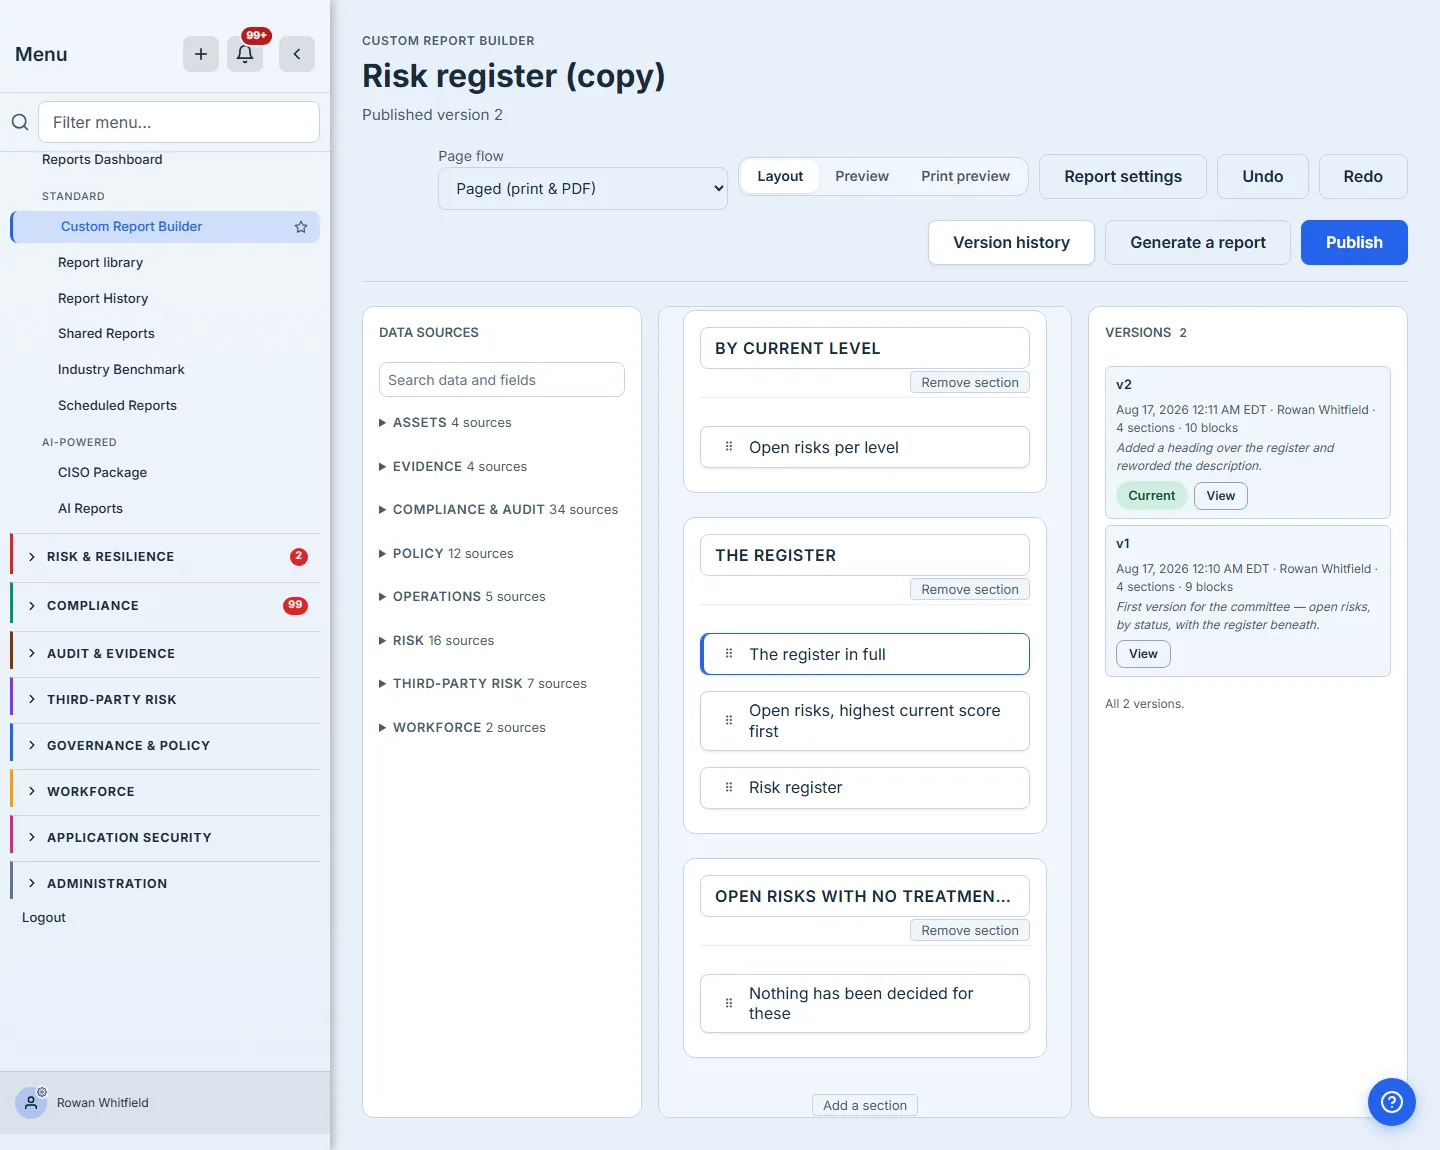
Everything is saved as you work — the status line says so — and Publish mints a version colleagues can generate from, leaving the template you go on editing untouched. It asks what changed before it does, and the answer is kept with the version rather than in someone’s memory. The note is optional; a version history where every entry says the same thing is one nobody reads twice.
What makes a finished report stable is the report itself, not the template behind it. Generating one writes a document that carries its own copy of the layout, its own snapshot of the data, and a content hash over both. So the pack your committee read in March is byte-for-byte the pack they re-open in June, even after you have changed the template twice — and if anyone asks, the hash is what proves it.
The template keeps its own record too. Version history lists every publish — when, by whom, the note that went with it, and how the document was shaped at the time — so “show me this report as it stood before the last change” is a question with an answer rather than an argument.
One thing publishing does not do is hand the template to anyone else. Everything above happened in the private copy Step 1 made, and a private copy stays private however many versions it has: colleagues cannot see it in the library, and it is not there to be scheduled or generated from. The verb for that is separate and deliberate — Share with my organisation, on the template’s card in the library — and it is one-way. A shared template can be scheduled by someone else and forked by someone else, so pulling it back would remove it from people who are already using it with no trace of where it went; if it should stop being shared, archiving it says so to everyone who can see it. Keep it private while it is still an experiment, and share it when it is the answer.
What you walk away with
- A report that answers your question rather than one nearly like it, built from a delivered template instead of an empty page.
- Blocks that state where they read from, which rows they count, and what supplies any value that arrives from elsewhere.
- Sections that decide the shape of the document — what happens when there is no data, and who may leave a section out.
- A report that asks for what it needs, so one template serves every audit rather than one.
- A document whose every figure carries its source and the moment it was read, paginated exactly as it will print.