Every framework you are measured against eventually asks the same thing: show me. SOC 2 expects management to review the state of the control environment and evidence that review (CC4.1, CC5.2). ISO 27001:2022 asks for documented results of monitoring and measurement in 9.1 and management review outputs in 9.3. The FFIEC IT Handbook expects the board to receive reporting sufficient to understand the institution’s risk position. None of them accept “we knew” — they want an artifact, dated, attributable, and consistent with the data it was drawn from.
Most teams answer that by exporting spreadsheets and rebuilding a deck the week before the meeting. The numbers were true on the day someone copied them, and nothing on the page says which day that was. Talarity treats a report as a governed object instead: it is generated from live data, stamped with the moment it was taken, hashed so a reader can tell whether the copy in front of them is the one that was published, and protected from deletion until its retention date has passed.
Who’s involved
- Analyst — picks a delivered template, sets the scope, and generates. Most reports never need more than this.
- Report author — takes a copy of a delivered template and reshapes it on the canvas: different blocks, different datasets, a different order.
- Approver — moves a report through draft, in review, approved, and published, and requests signatures where the process needs them. A report cannot be approved by the person who generated it; that separation is enforced on the transition, not by a role.
- Auditor — opens the finished document and checks two things: that every figure names its source and as-of timestamp, and that the copy verifies against the hash it was published with.
What’s on the page
Reports Dashboard is one sidebar row, and the reporting pipeline sits along the tab strip at the top of it. Six tabs, each doing a distinct job:
- Reports (
/app/reports) — the front door: audience starting points, a compliance lens, data exports, and saved pivots. - Library (
/app/reports/templates) — the library of delivered templates and the ones your organisation has saved. - Builder (
/app/reports/builder) — the drag-and-drop canvas, with a live data panel and a per-block inspector. - History (
/app/reports/history) — every generated report, filterable by status, template and date. - Scheduled (
/app/reporting/scheduled) — recurring reports delivered by email, with delivery and bounce rates. - Shared (
/app/reports/shares) — links issued to people outside the platform, with expiry and view counts.
Three related surfaces sit on a strip of their own, under the CISO Package row, and belong to different features — so they are out of scope here rather than skipped. Industry Benchmark compares your position against a cohort rather than reporting your own data, and CISO Package and AI Board Report are the AI-assisted surfaces, which answer to a different set of rules about what a model may assert. Each has its own walkthrough.
Step 1 — Start at the front door
/app/reports opens on Build a report, and it opens by asking who the report is for rather than what data to put in it. That ordering is deliberate: the audience determines the shape. A board pack leads with material risk and the direction of travel; a technical pack leads with which controls are implemented, which were tested, and what failed.
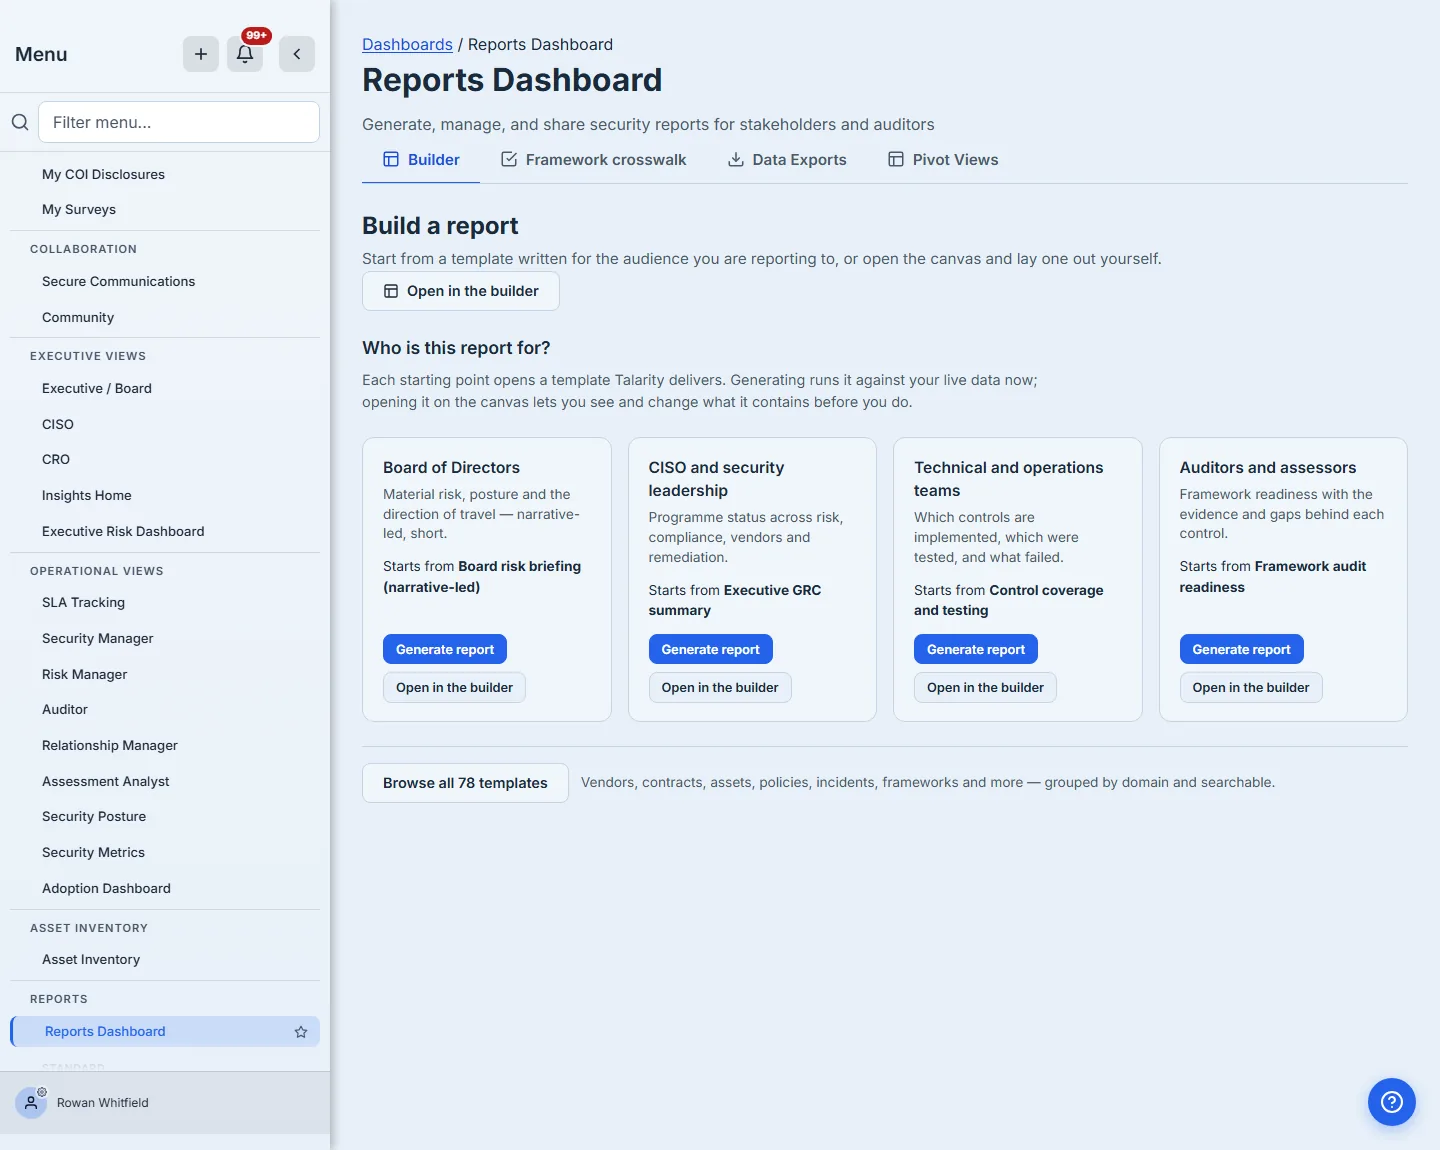
Each card names the delivered template it starts from, which is the difference between a shortcut and a mystery: choosing Auditors and assessors opens Framework audit readiness, and the card says so before you click. Two actions, and they do different jobs — Generate report runs the template against your live data now, Customize opens its layout in the builder so you can see and change what it contains first.
These are pointers into the library, not a second catalogue. They open the same delivered templates as
/app/reports/templates, generate through the same action, and produce the same governed document. There is one report generator in this product, and everything is a way in to it.
Step 2 — Say what the report is about
Generate report asks for whatever that template declares it needs. Most delivered templates need nothing and run immediately. The single-subject ones — Vendor risk profile, Audit report, DSAR response packet — ask which vendor, which audit, which request, and refuse to run until you say.
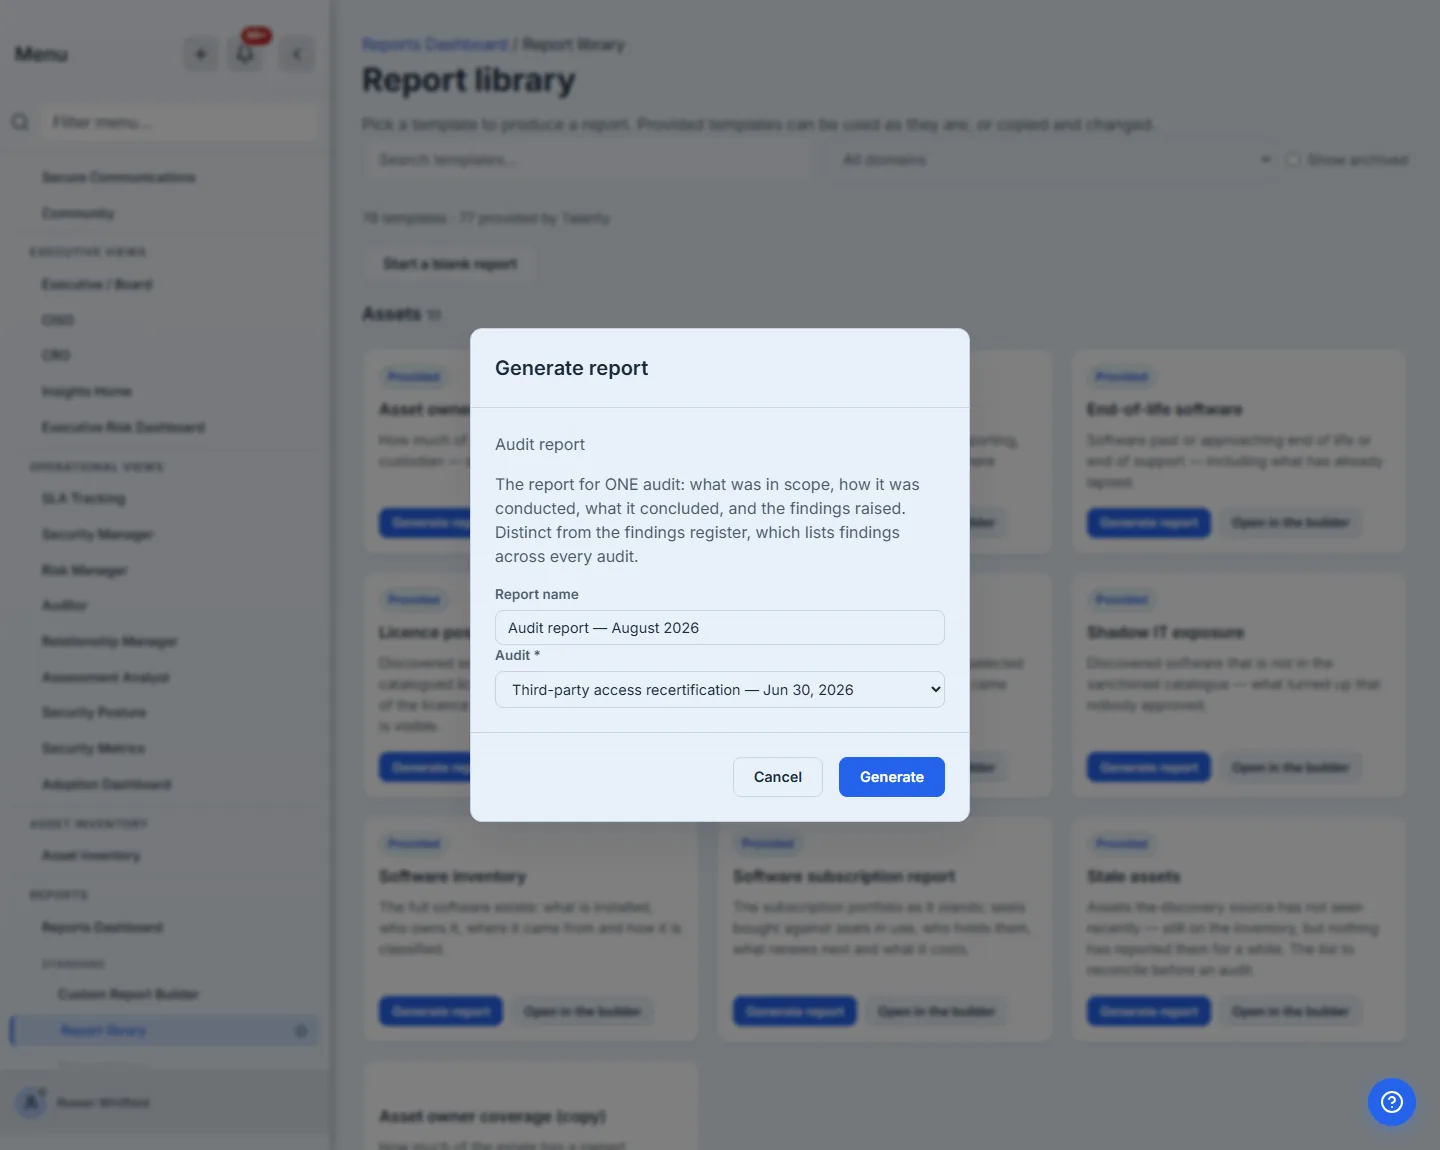
The asterisk beside Audit is doing more work than it looks. A single-subject report generated without its subject does not fail; it succeeds, renders, and is quietly about the whole organisation instead of the thing you meant. So the template declares that parameter required, and the dialog will not run without it. The subject is chosen from a list of your own records — here Third-party access recertification — Jun 30, 2026, named and dated — never typed as an identifier.
Step 3 — Or start from the library
/app/reports/templates is the full delivered library, grouped by domain and searchable. Every template carries a Provided badge and a plain-English line describing what it answers — “How much of the estate has a named custodian — and which assets nobody owns.”
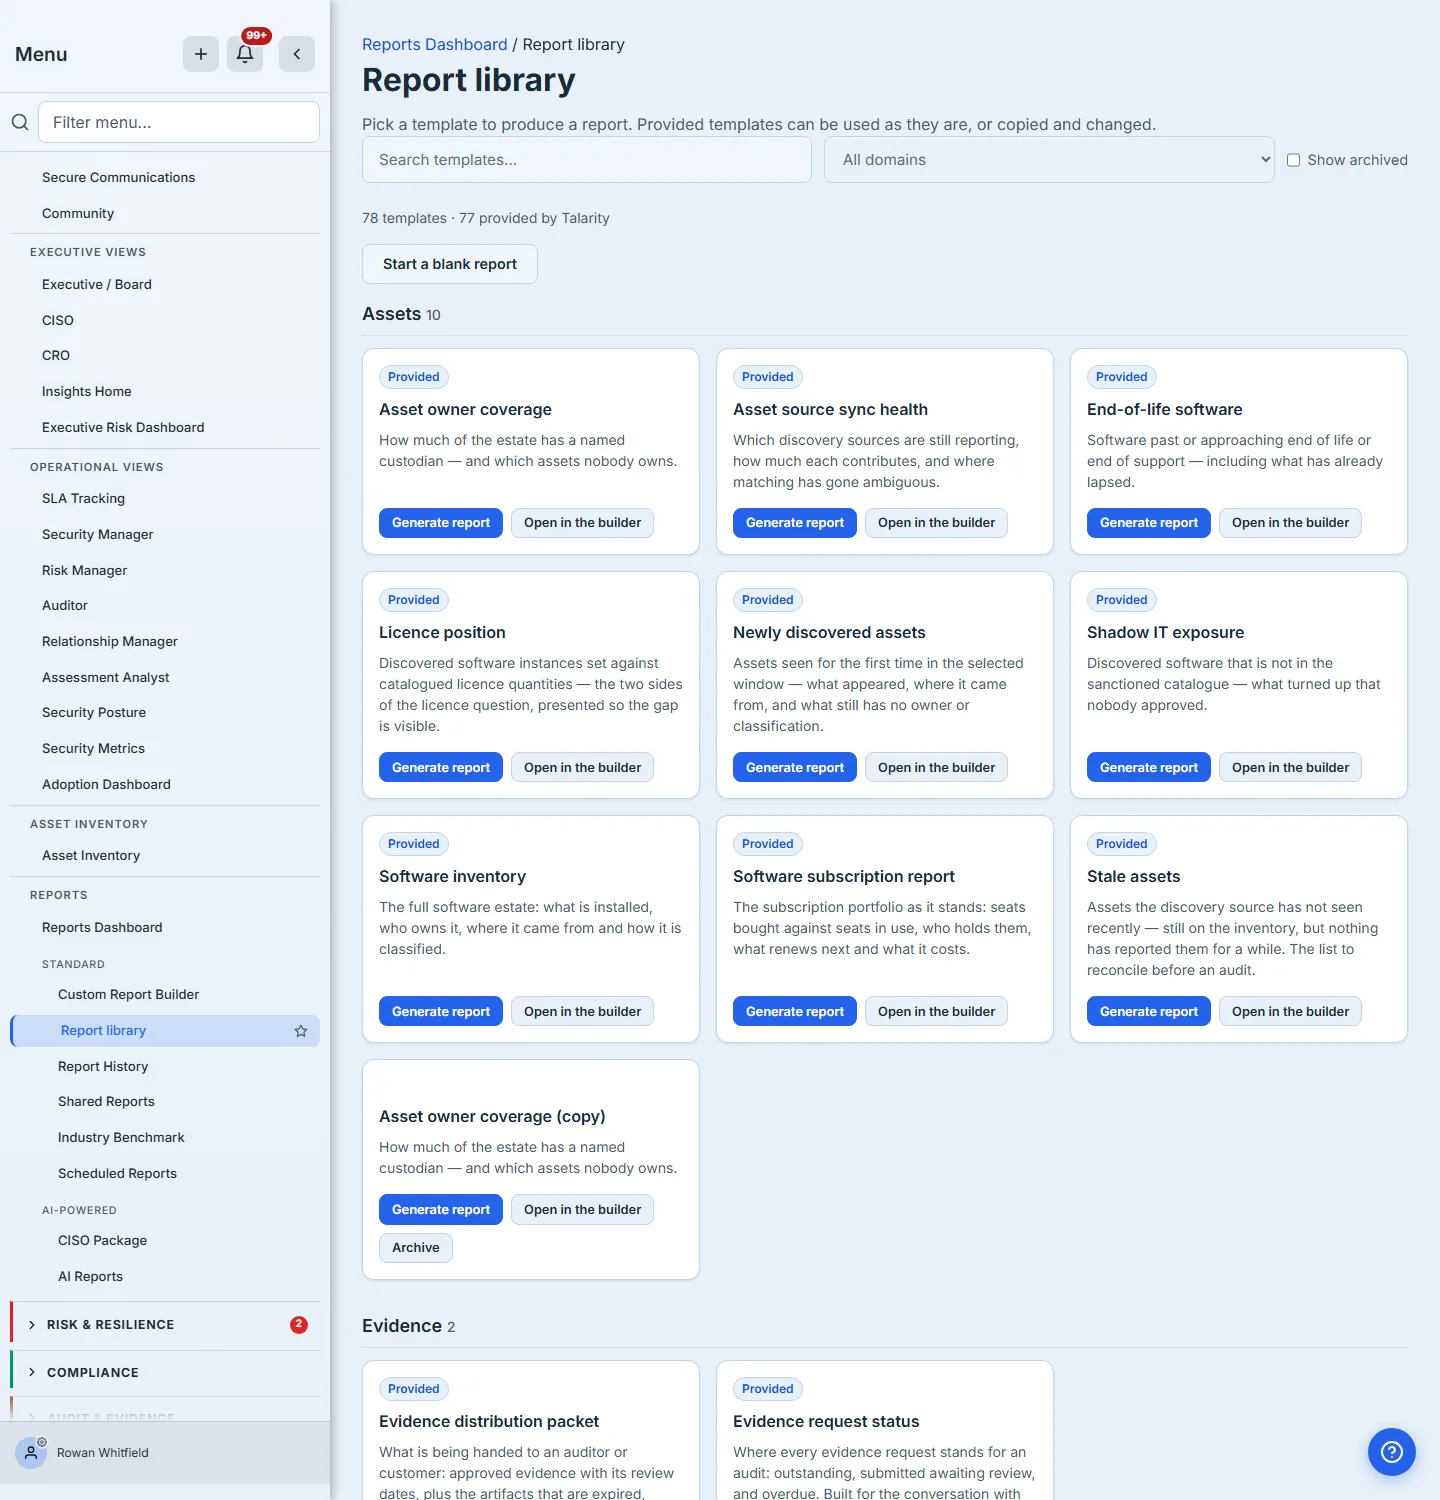
The same two actions as the audience cards, wearing the same two words. Generate report runs it now against your data. Customize opens the layout in the builder, where you can read it, preview it and print-preview it — and then take a copy if you want to change it — with the way back to this library waiting at the top when you do.
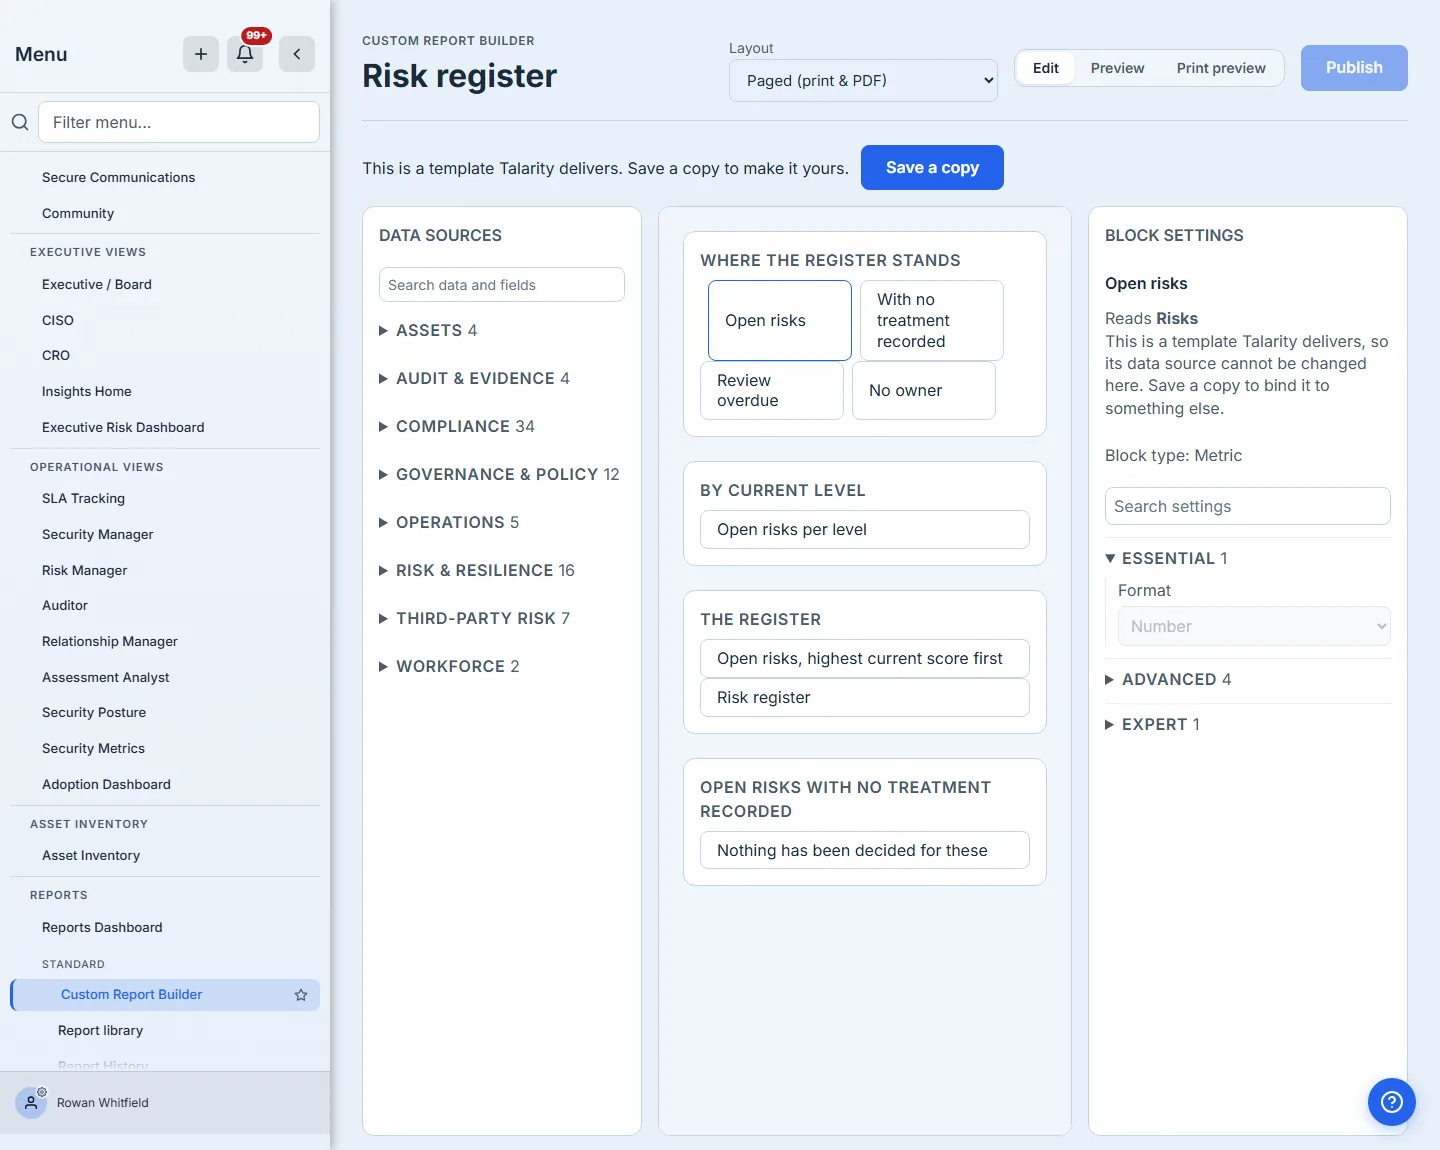
A delivered template cannot be edited in place, by anyone. The canvas will not let you save over one: the server refuses the write and tells you why — “This is a template Talarity delivers and it cannot be changed. Save a copy to make it yours.” Taking that copy is a deliberate click, not something that happens behind you, and the copy is stamped with the template and version it came from. That stamp is what lets us tell you later that the original has improved, and diff it against the exact version you started from rather than guessing.
Step 4 — The builder, for the reports nobody delivered
The builder is three panes: data sources on the left, the report on the canvas, and a per-block inspector on the right. Blocks drag; the data panel is searchable and grouped by domain with live counts.
Open a template Talarity delivers and the builder says so before you try to change it, in every control rather than only in words: the banner offers Save a copy, Publish is greyed, the blocks are listed without drag handles, and every setting in the inspector renders inert — because a handle on a canvas that will refuse the save is an invitation to waste your time. What you can still do is read it. The structure stays open in front of you, Preview renders it against your own data and Print preview breaks it into the pages the PDF will have, and none of the three touches the original.
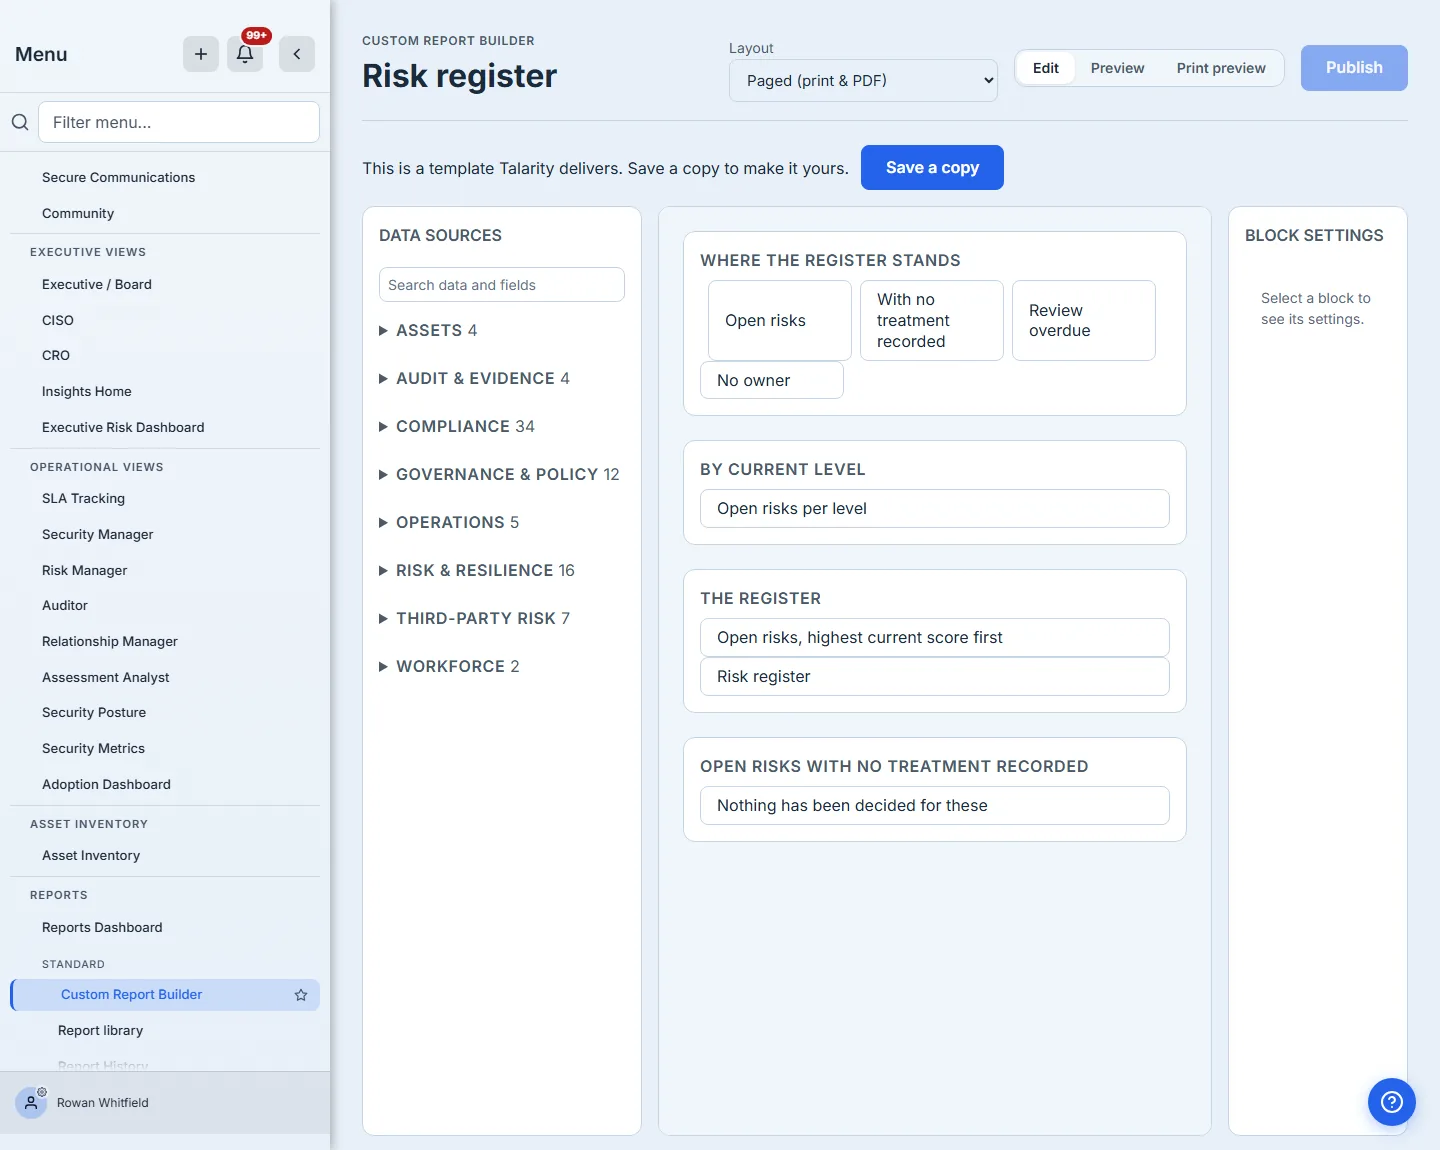
Select a block and the inspector fills with that block’s settings, grouped so the one setting most people change sits above the ones most people never do; with nothing selected it holds its place and says what to do, so the panel never becomes a mystery you have to click to explain. On a template you own it offers to edit; on one Talarity delivers it offers to see — and the settings render disabled rather than absent, because “this metric is formatted as a number” is worth reading even where it is not yours to change.
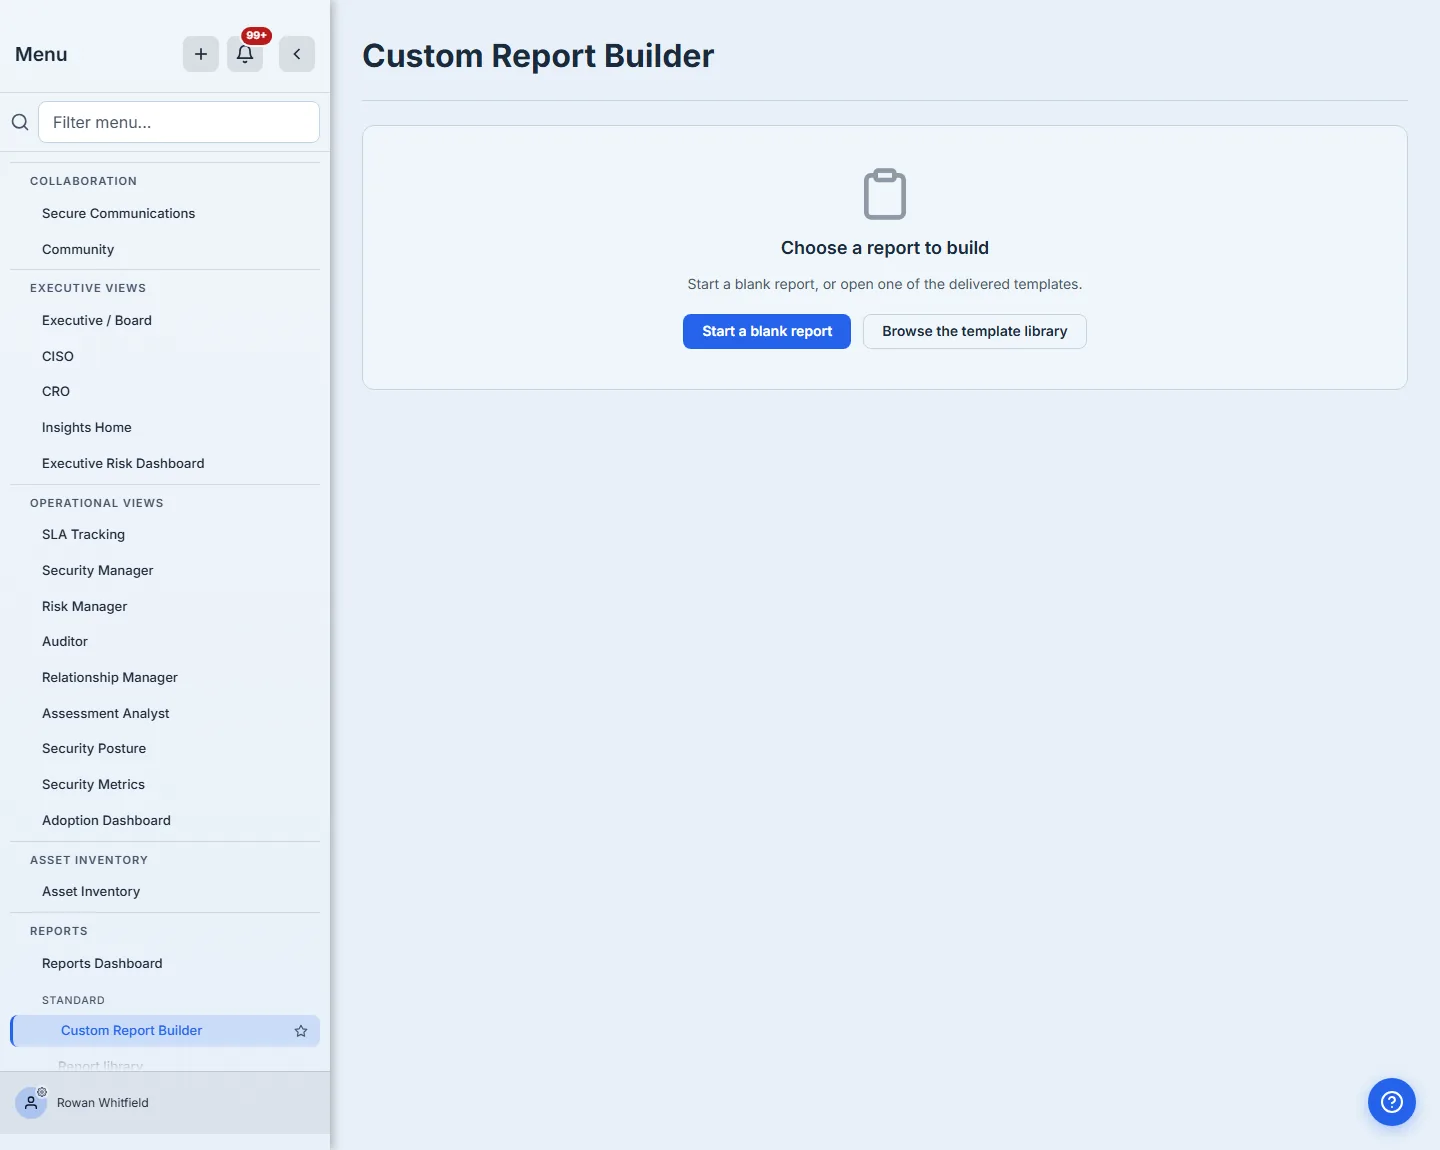
Arrive at the builder with no report chosen and it tells you so, and offers the way out rather than leaving you on an empty canvas.
Start a blank report is the other way in, offered here and in the library header. Most reports should begin from something we deliver — one hundred and nine of them exist so that the common questions are already answered — but a programme eventually needs one nobody anticipated, and that report should not have to begin its life as somebody else’s, mutated until the resemblance is gone. A blank report is named when you create it and opens on an empty canvas, and from there it is an ordinary template: yours, editable, and generating the same governed document as any other.
Step 5 — The document is the point
Generating produces a governed document, not a file. The header carries its state and its evidence: the lifecycle badge — here In review, the state this report was moved to after it was generated — an Integrity verified badge, the as-of date the data was taken, and the retention floor, the date before which this report cannot be deleted. Below them the page prints the content hash recorded at generation, in full.
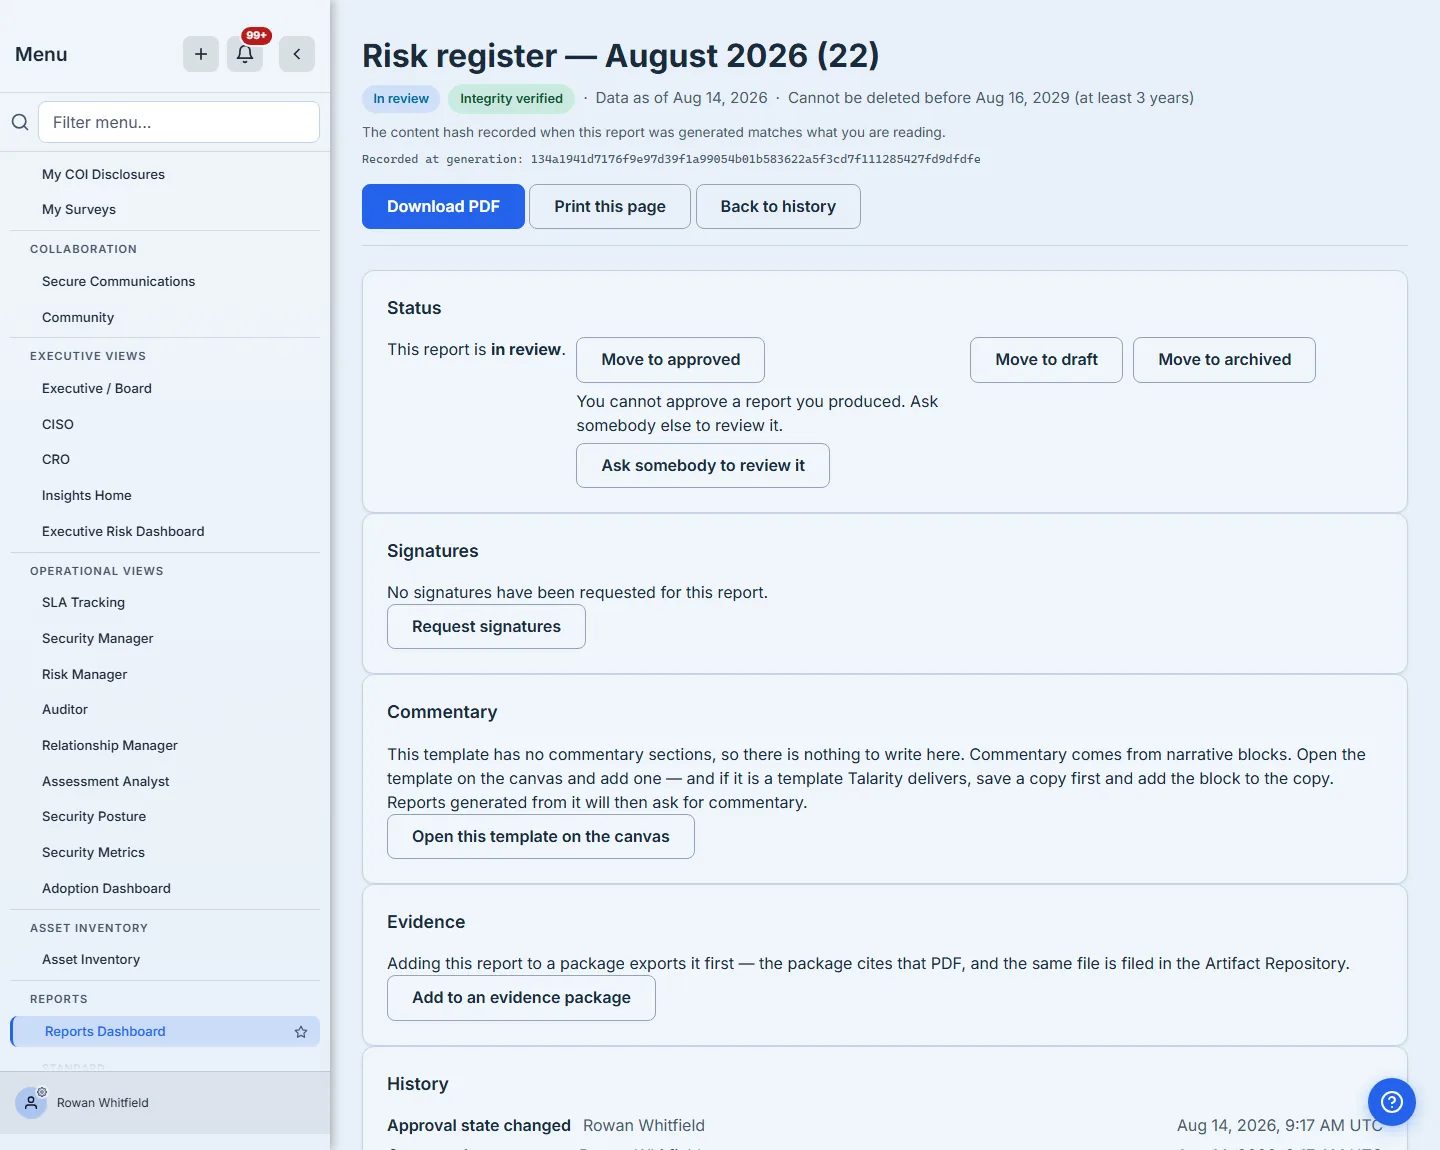
Underneath the header the page is the governance record: Status, Signatures (request them, see who has signed), Commentary, Evidence (add this report to an evidence package), History (who did what, and when) and What changed against the previous version — and then the report itself.
Status is where separation of duties shows up as something you can see rather than a rule you are told. This report is in review, so it offers Move to draft and Move to archived — and Move to approved is greyed out beside the reason: you cannot approve a report you produced. The person who generated it cannot be the person who signs it off, and the product declines at the control rather than after the click.
That reason is an instruction — ask somebody else to review it — so the way to carry it out sits directly beneath it. Ask somebody to review it routes this report to a named colleague, tells them, and records who was asked and when, because an auditor wondering why a report sat unapproved for three weeks needs the request rather than its absence. The people you can choose from are the ones who could actually finish the job: the product will not offer you its own author, since that is the one person approval is guaranteed to refuse. From then on the report is theirs — it counts on their waiting-on-me total rather than lighting the same number for everyone who happens to be eligible, and if you asked the wrong person, asking somebody else tells the first one they are off the hook.
Two things on this page are worth understanding, because they are what an auditor actually tests.
Every figure names its source. Each value carries a provenance line — the dataset it came from and the as-of timestamp, plus a row count where rows are what the figure counts. A number with no lineage is an assertion; a number that says Source: Risks, with the moment it was measured printed beside it, is evidence. A single-value metric shows no row count, deliberately: its query returns one row whatever the answer is, so printing “1 row” beneath a figure of 0 would say something untrue about the estate.
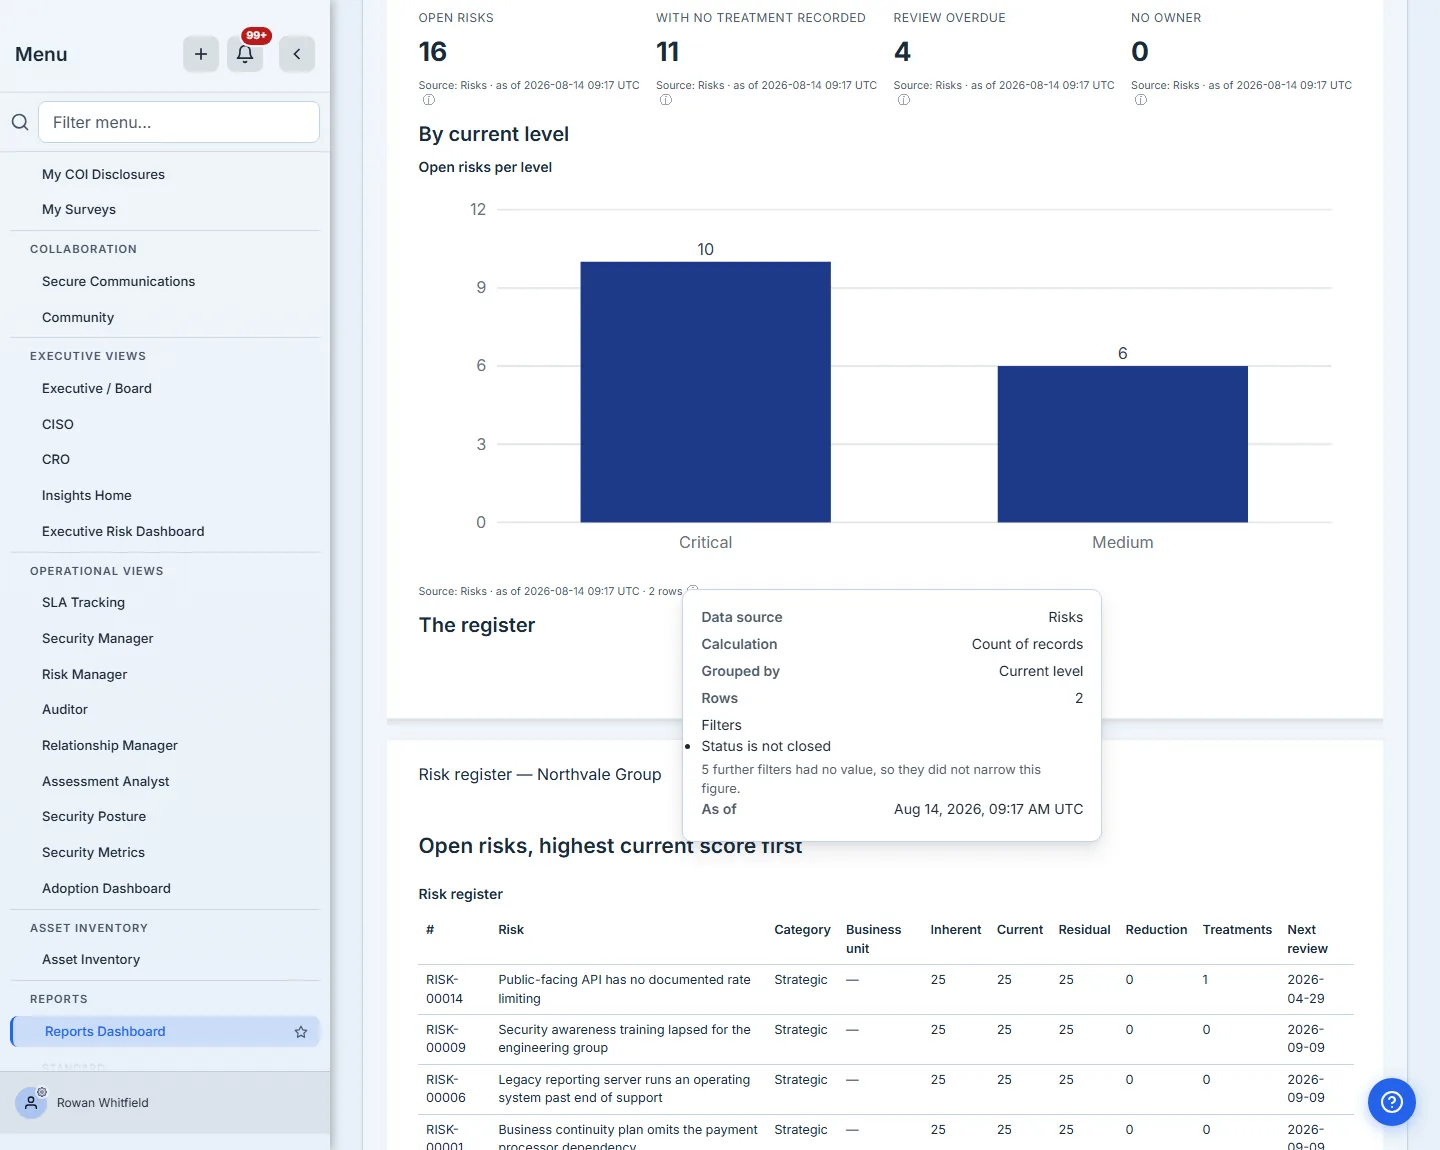
The integrity badge is a re-computation, not a label. When a report is generated, Talarity captures the resolved data as a snapshot and hashes the rendered document. Opening it re-renders from that snapshot and re-checks the hash. “Integrity verified” means the copy you are reading is byte-for-byte what was captured when the report was generated — which is why the badge is meaningful on a draft, long before anyone publishes it. If it were not, the page would say so and refuse to reassure you — a mismatch is reported, never quietly repaired.
The hash itself is printed under the badge, not hidden behind it. That matters because “verified” is the product vouching for itself, and an auditor’s job is not to take that on trust — so the page shows the digest recorded at generation, and when a copy does not match, it shows both values side by side under an Integrity MISMATCH badge that says “The stored hash does not describe this content. Do not distribute this report until it has been looked at.” That is precisely the verdict a reader will want to check rather than accept, and it is the one where a bare assurance would be worth least.
Step 6 — Then it has a life
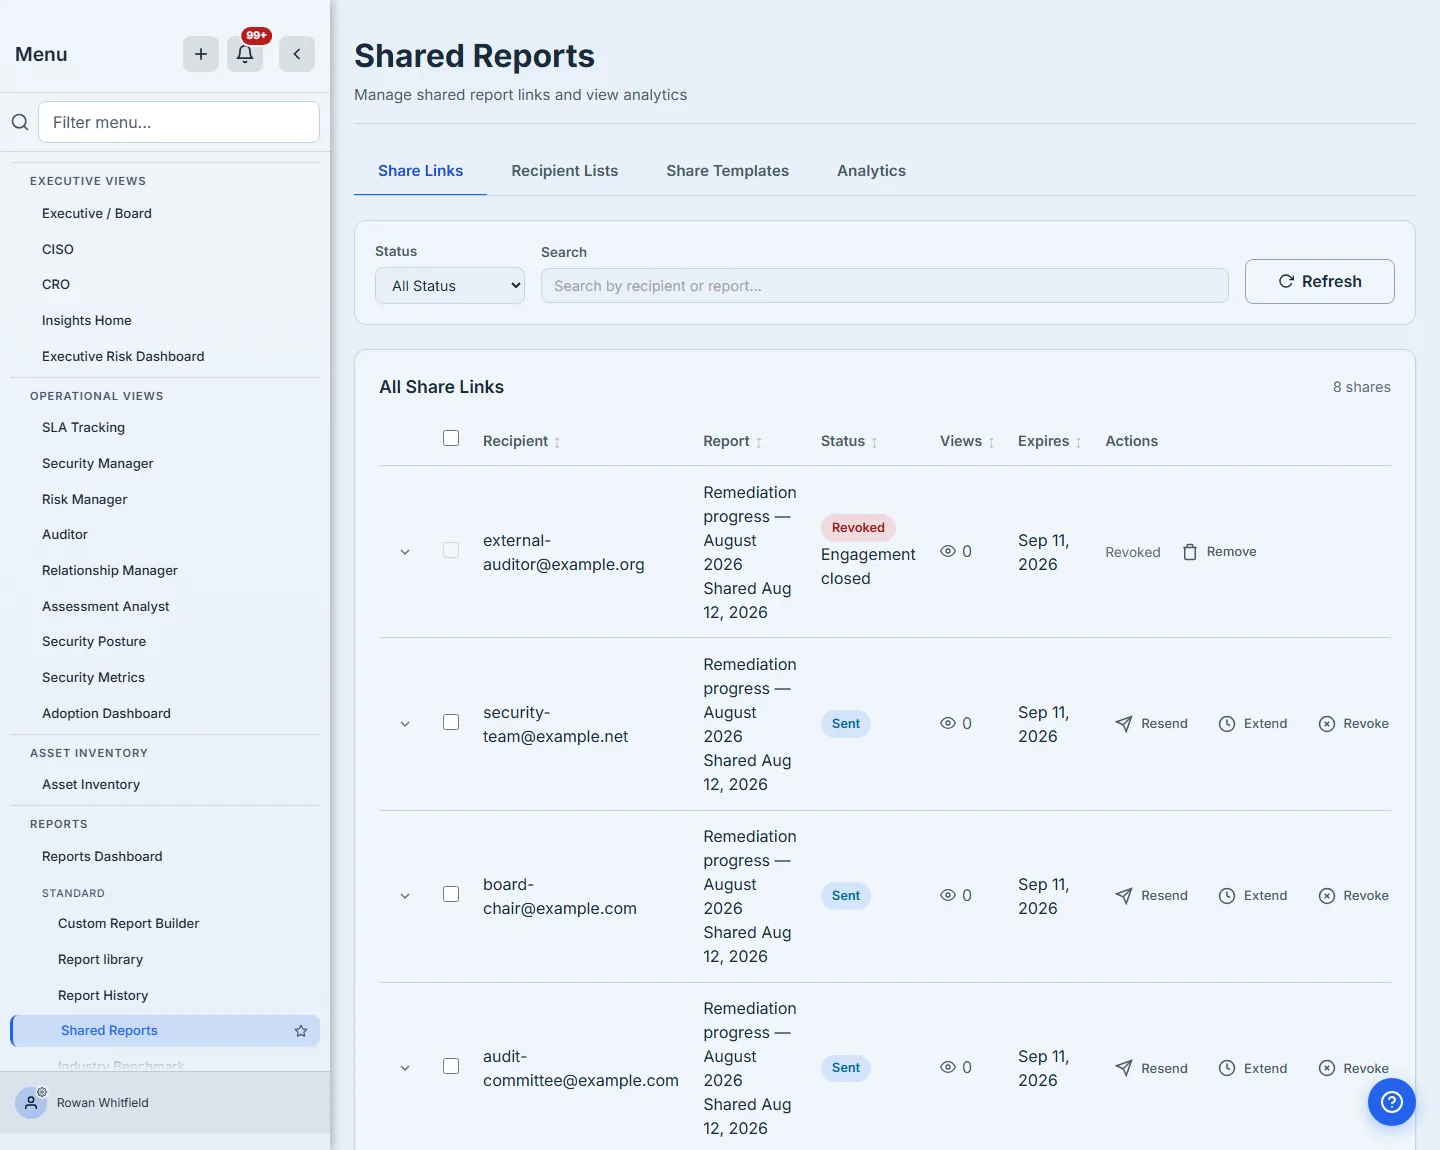
A generated report does not stop at the download. Report History keeps every one, filterable by status, template and date range, with its shares and actions. Two of those filters matter more than they look: Waiting on me narrows the list to the reports actually routed to you — it is where the sidebar’s waiting-on-me count leads, and it asks the same question that count answers, so the number and the list cannot disagree. And because a year of monthly packs is a long list to retire one row at a time, reports can be selected and archived together. Archiving a published report still asks why, once for the batch, and the answer is recorded against each one — withdrawing something you have already circulated without saying why costs somebody a conversation later.
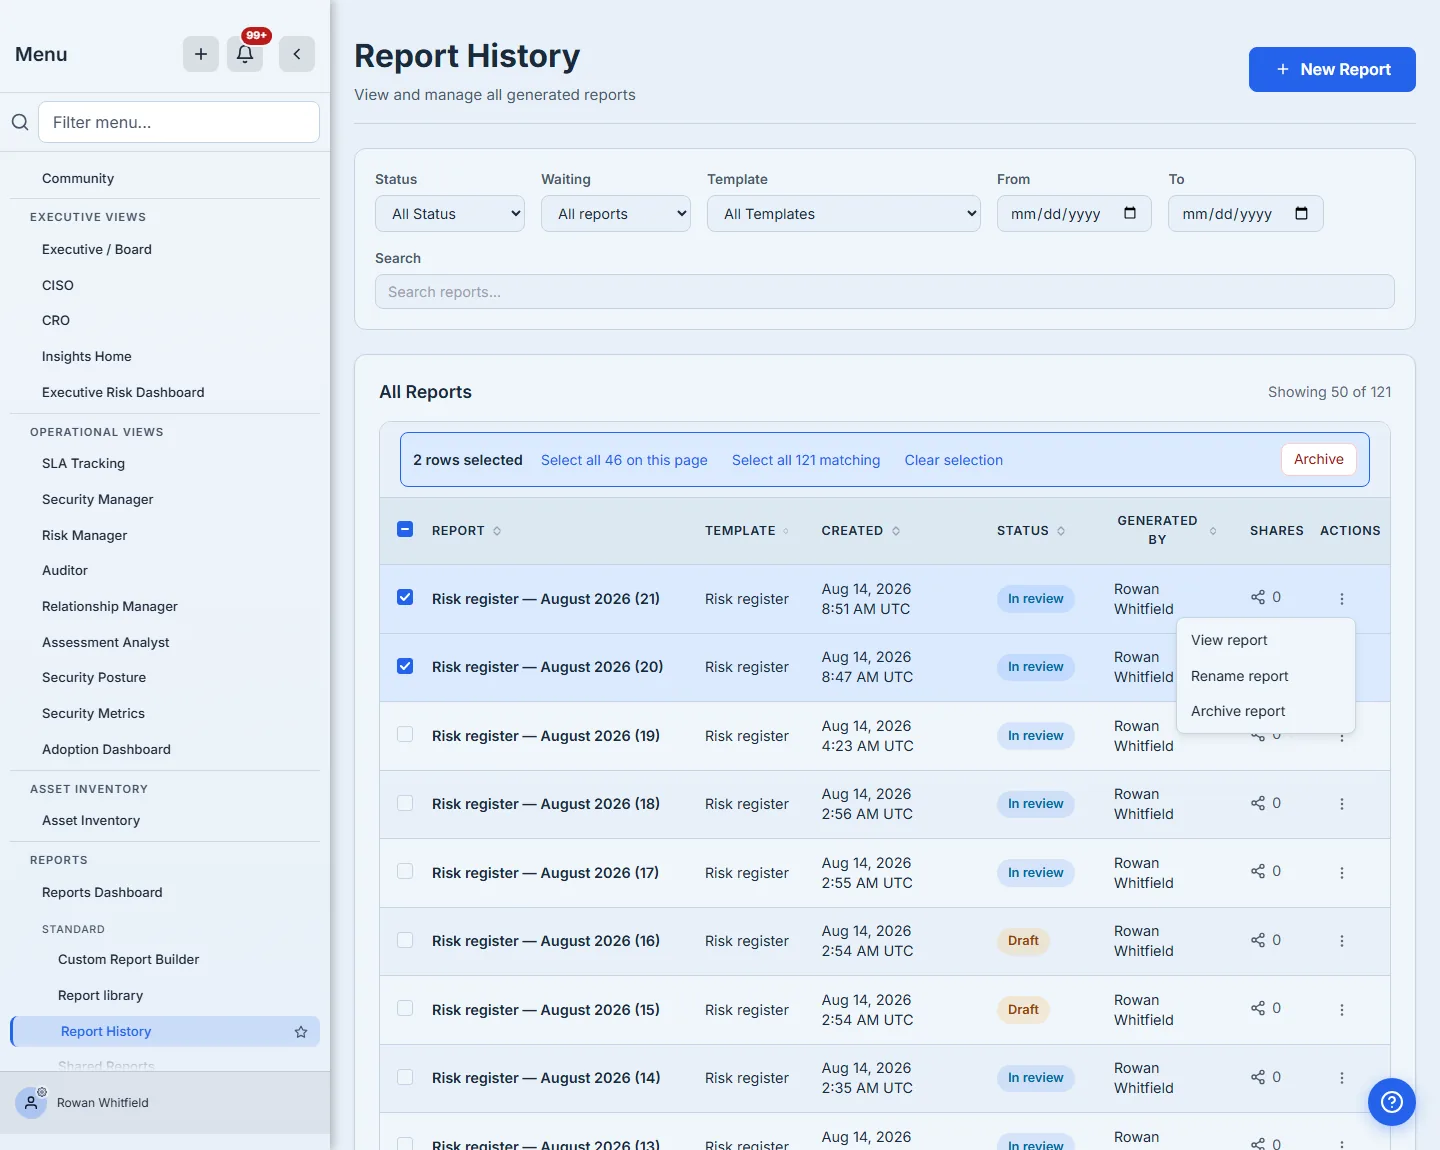
Scheduled Reports turns a one-off into a cadence: subscriptions delivered by email, with active/paused/error counts, run history, and per-run outcomes — because a report that silently stopped arriving is worse than one that was never scheduled.
The tiles say which question they answer. Sent without error is what the platform itself observed: the mail system accepted every message. Whether each one then landed is a separate fact only the mail provider can report, so the bounce rate stays blank, with the reason on the tile, until those receipts are being delivered. A rate of 0% would have read as “nobody bounced” when what is true is “nobody has told us.”
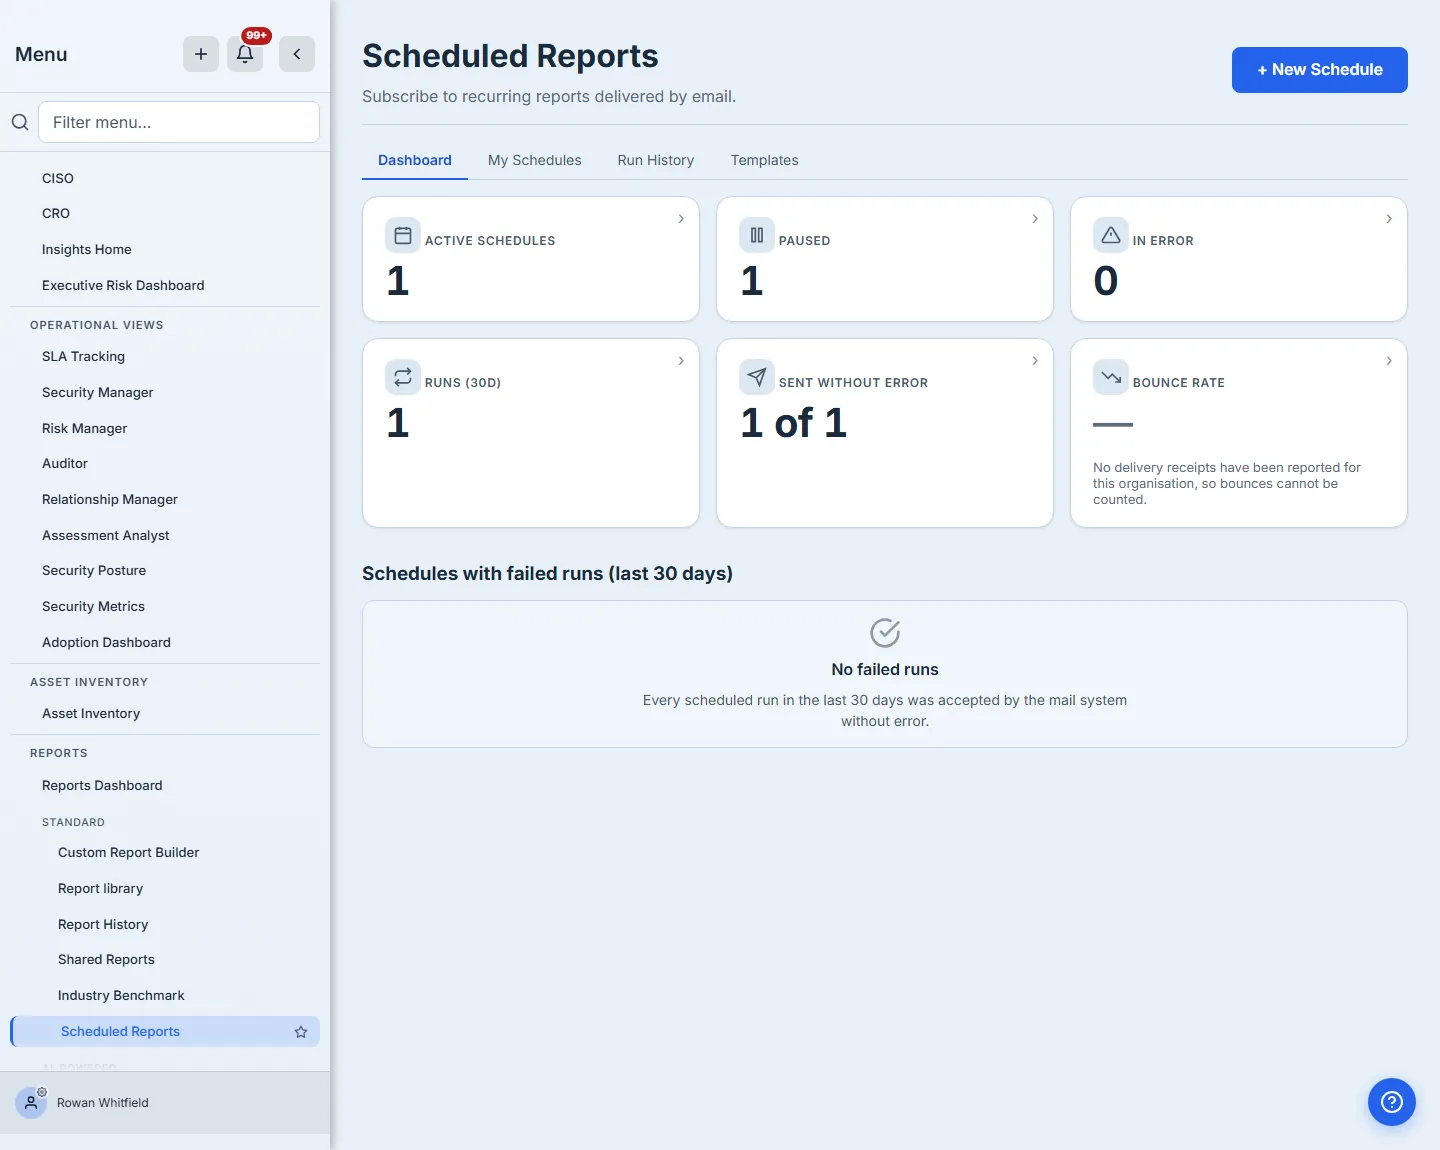
Shared Reports issues links to people who have no login — an auditor, a board member, a customer’s security team — with expiry, per-recipient status, and a count of how many times each link has been opened. Every link below is newly issued and unopened, so each reads zero; the count rises the first time a recipient opens theirs. A revoked row stays on the page rather than disappearing: who was given access, and when it was taken away, is part of the record. Only a spent link — revoked, cancelled or expired — offers Remove, and removing it clears the row without clearing the audit trail; the server refuses to remove a link that still works.
Step 7 — The other three tabs on the hub
Building a report is one tab of four, and the rest answer questions that do not need a document.
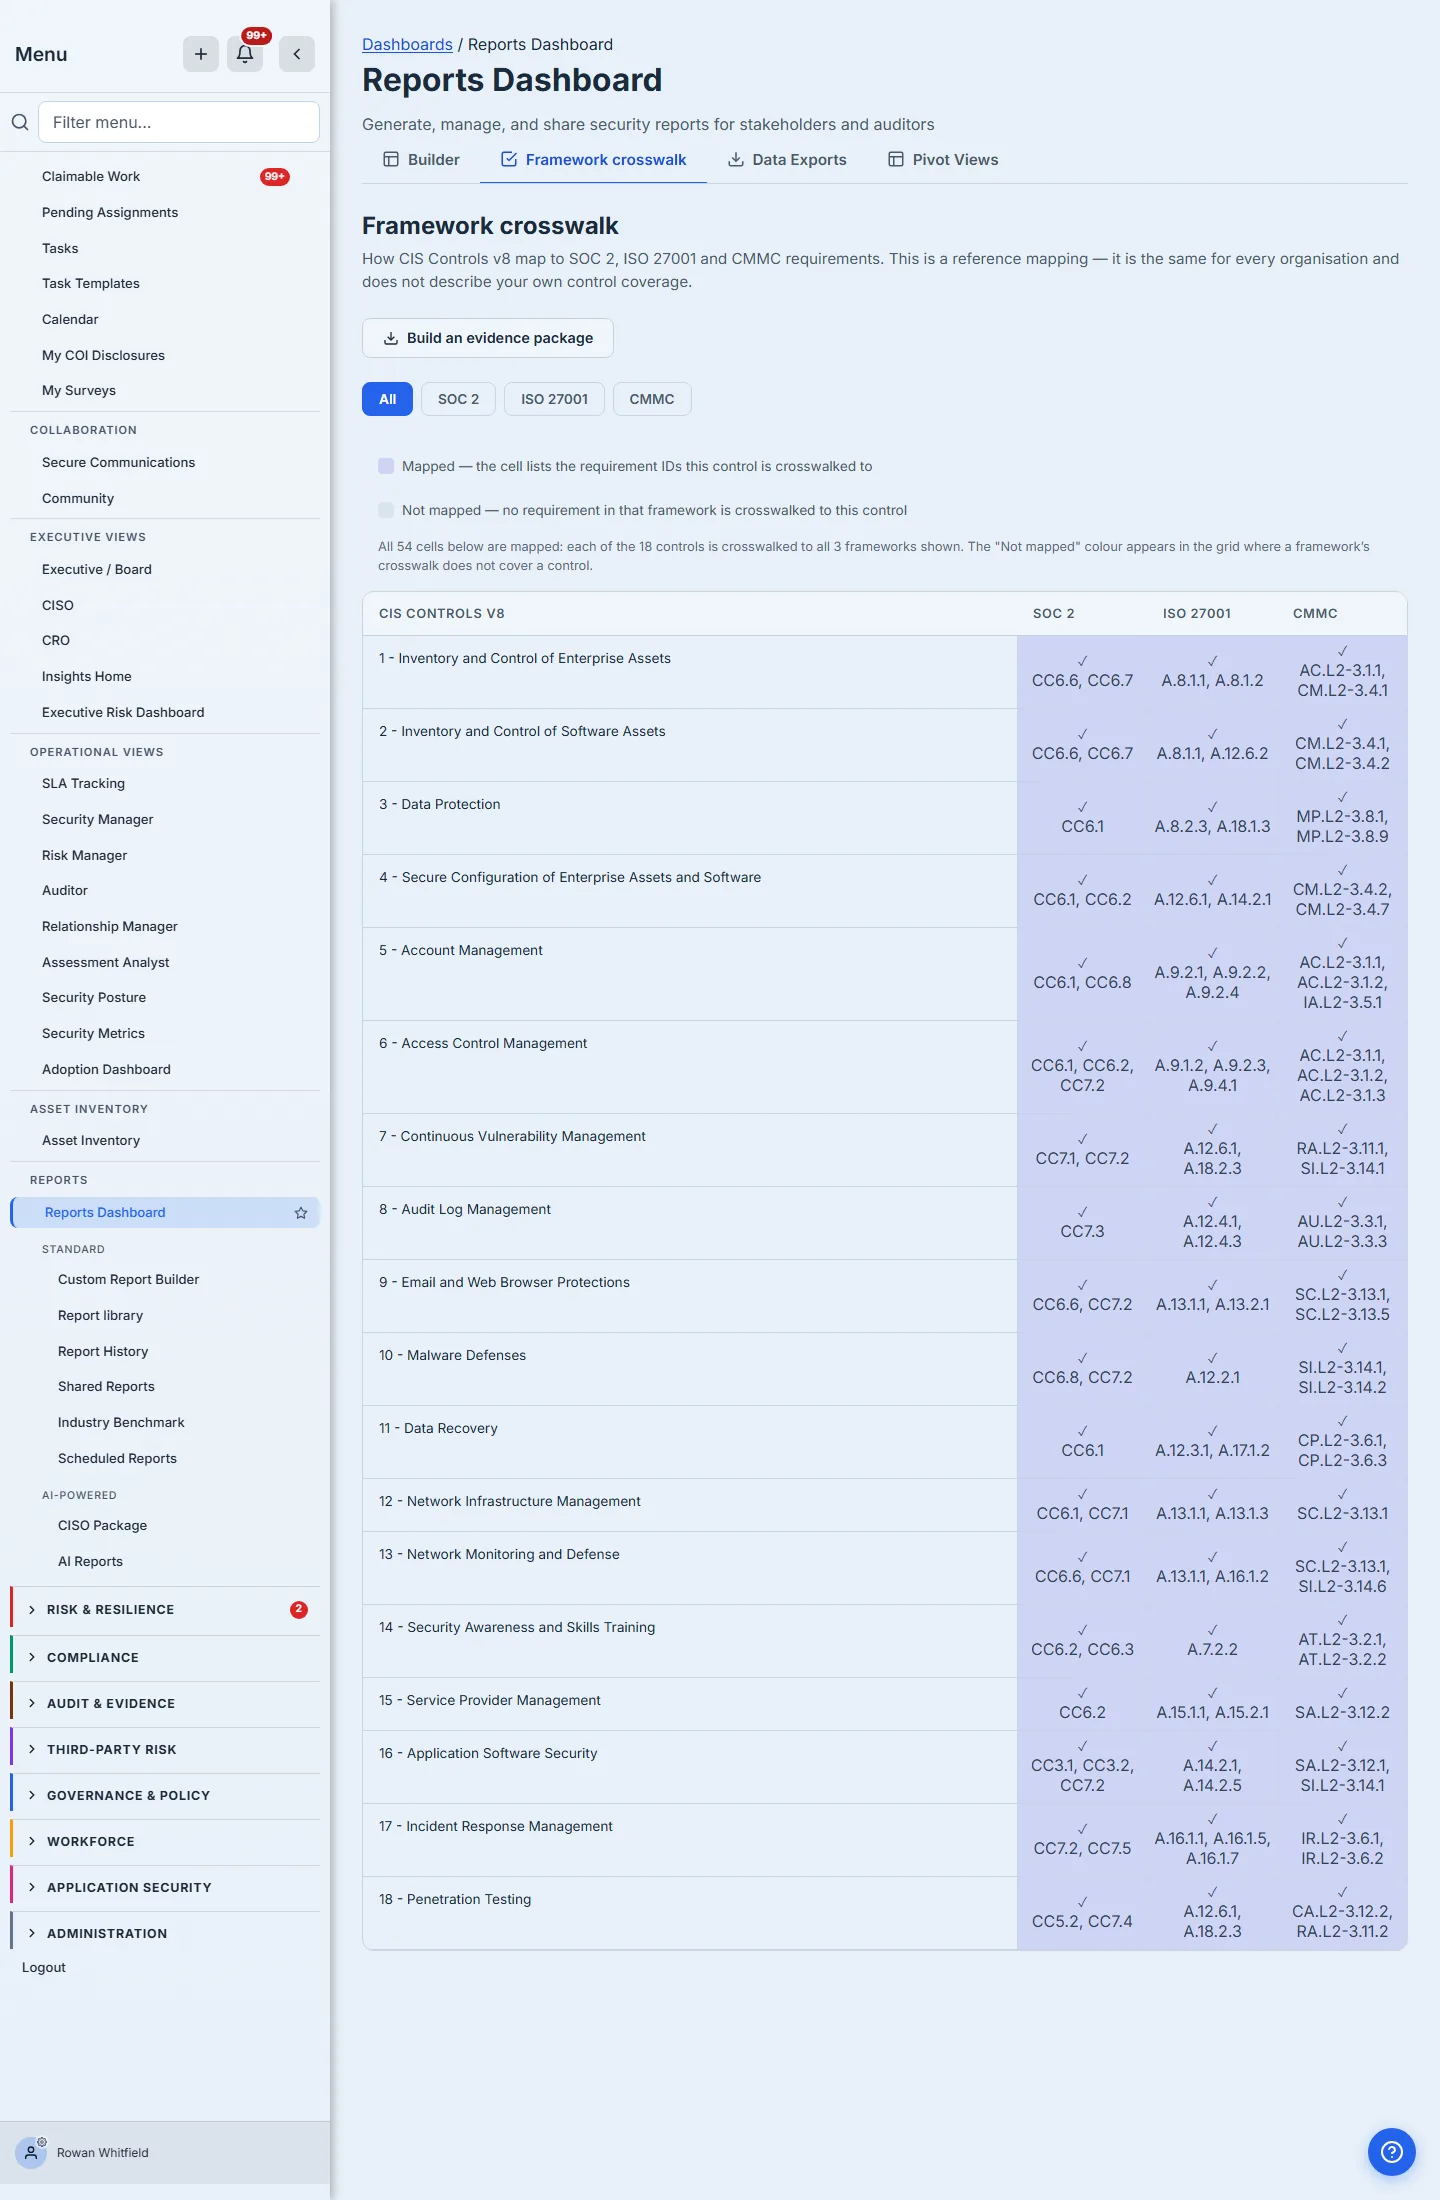
Framework crosswalk shows how CIS Controls v8 map to the frameworks Talarity carries a crosswalk for — SOC 2, ISO 27001 and CMMC — as a grid, with the key above it and the requirement IDs printed in every cell — CC6.6, A.8.1.1, AC.L2-3.1.1 — so the grid tells you WHICH clause a control satisfies rather than only that it satisfies one.
Read it as a map, not a scorecard. This crosswalk is the same for every organisation — it says how the frameworks relate to each other, not how far along you are — so the cells are coloured by kind of mapping rather than by pass and fail. A green-and-amber grid here would read as a compliance result at a glance, and an executive skimming a page rarely reads the sentence underneath that takes it back. What your own coverage looks like is a different question, and the delivered Control coverage and Framework audit readiness reports are the ones that answer it.
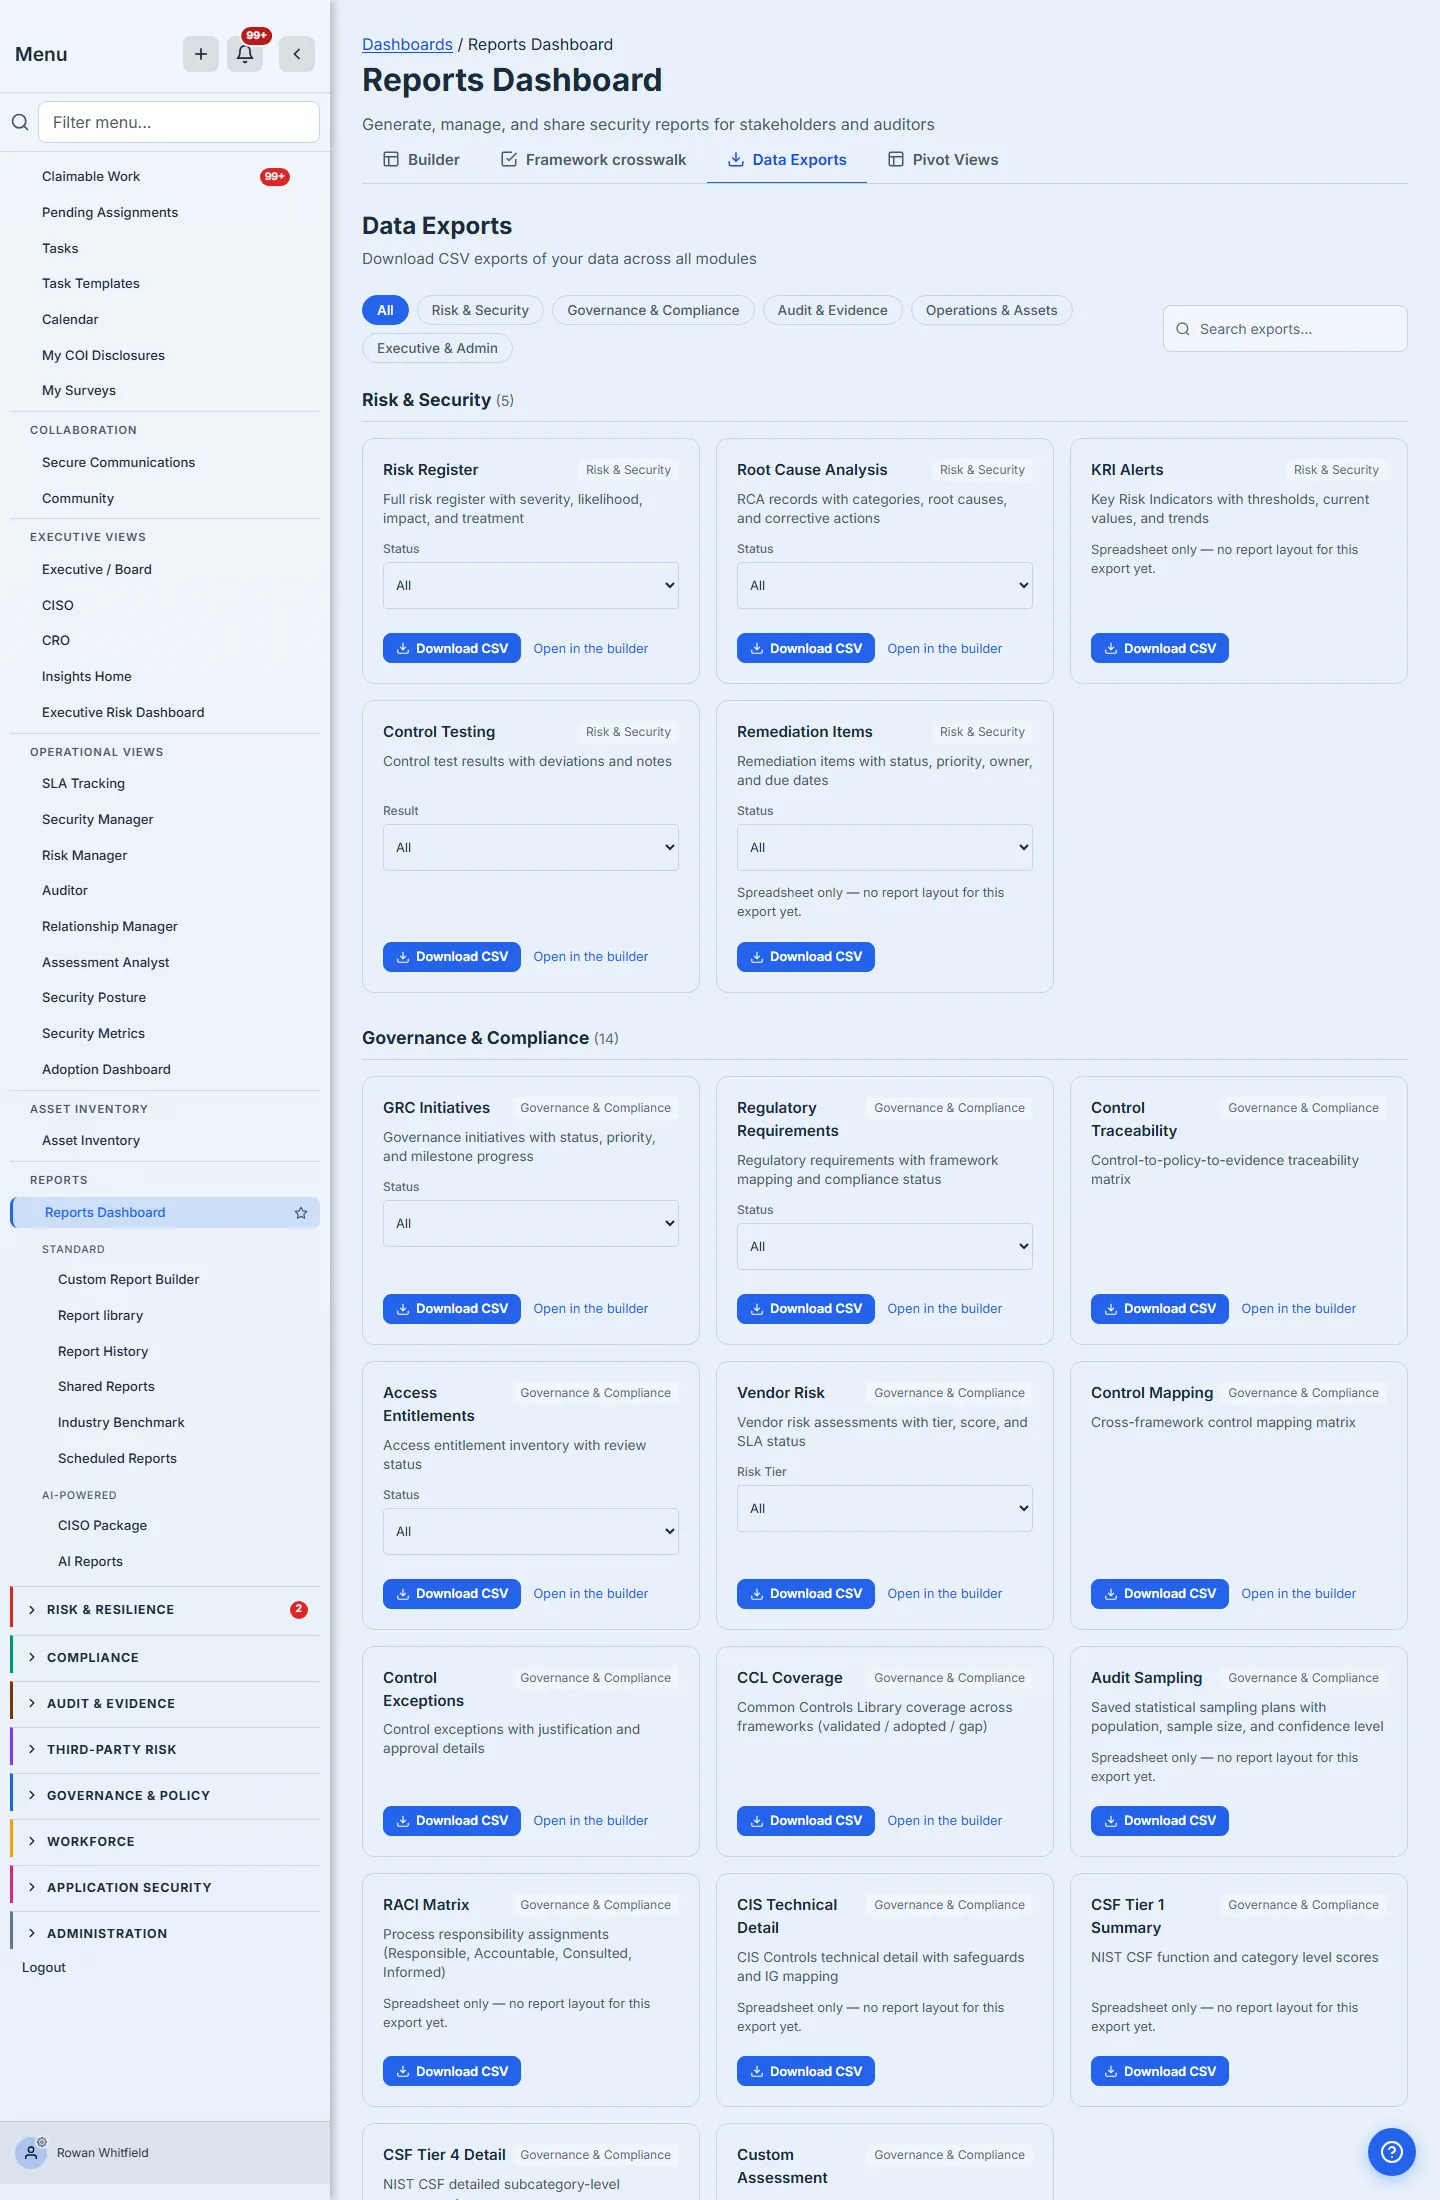
Data Exports is the CSV path: every export grouped by category with a Download CSV, and a filter on each export that has a dimension worth narrowing, for when the answer belongs in a spreadsheet rather than a PDF. Most also offer Open in the builder, which turns that same data into a laid-out report. Some do not, and say so on the card — “Spreadsheet only — no report layout for this export yet.” Those exports give you the rows and nothing more for now; the card tells you which, rather than offering a link that goes nowhere.
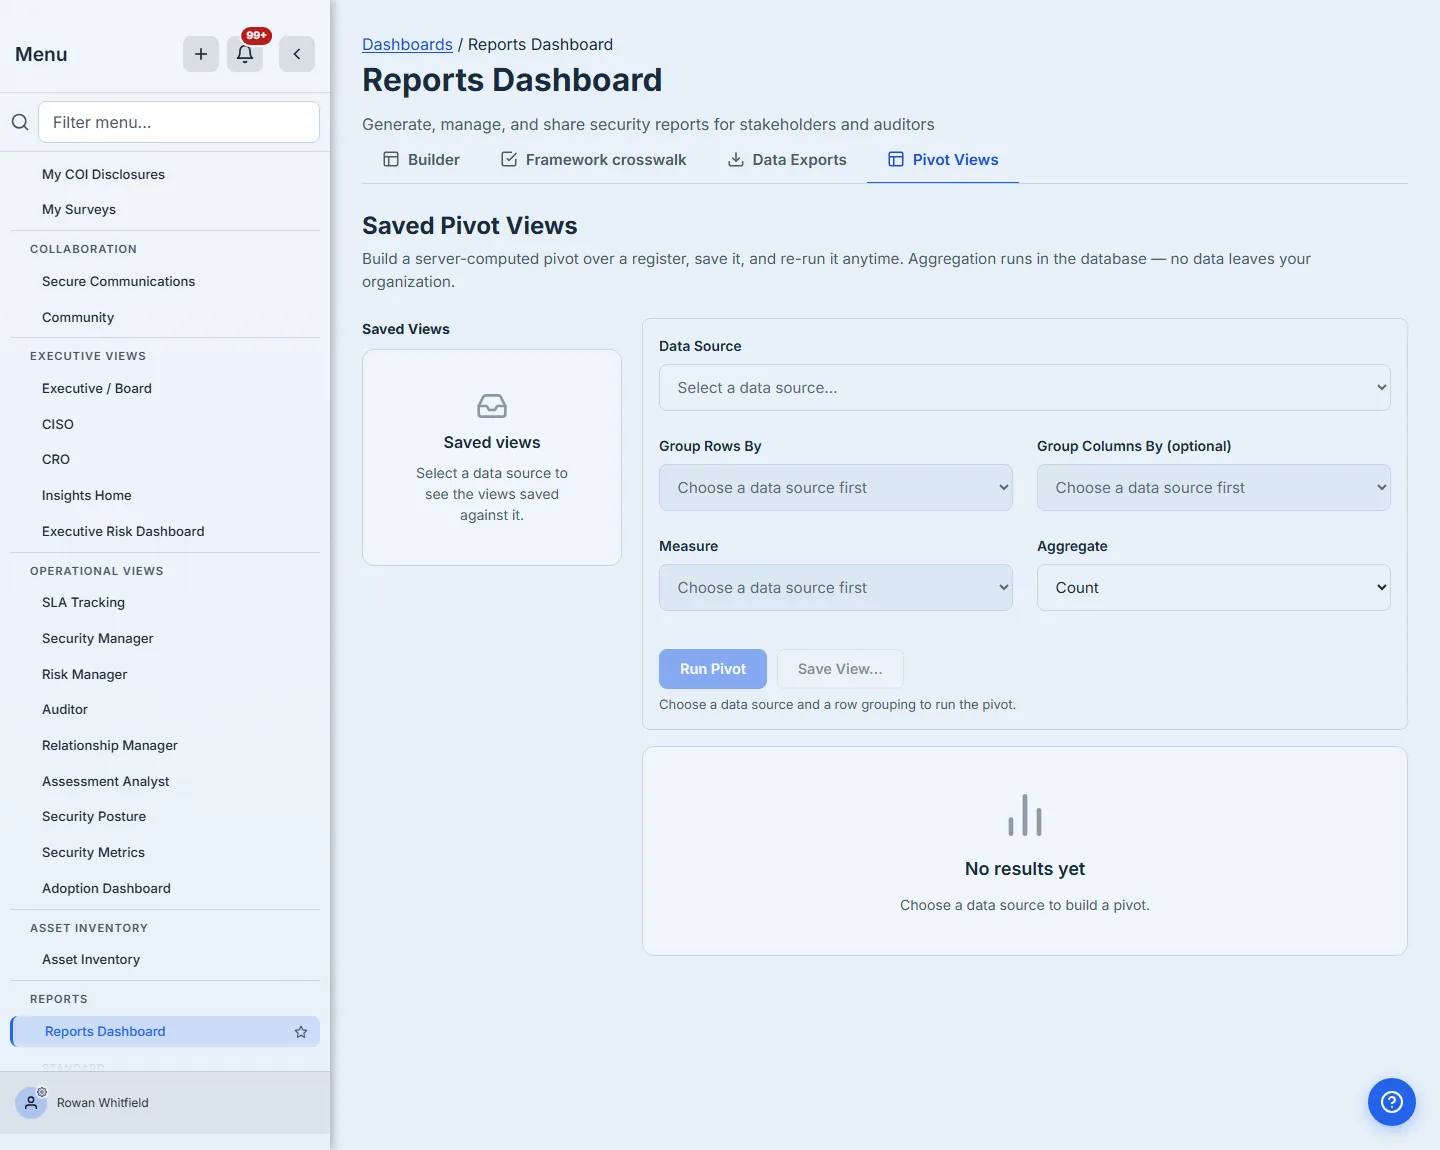
Pivot Views answers “how many, grouped by what” without building a report at all. Choose a register, a row grouping, a measure and an aggregate, and run it.
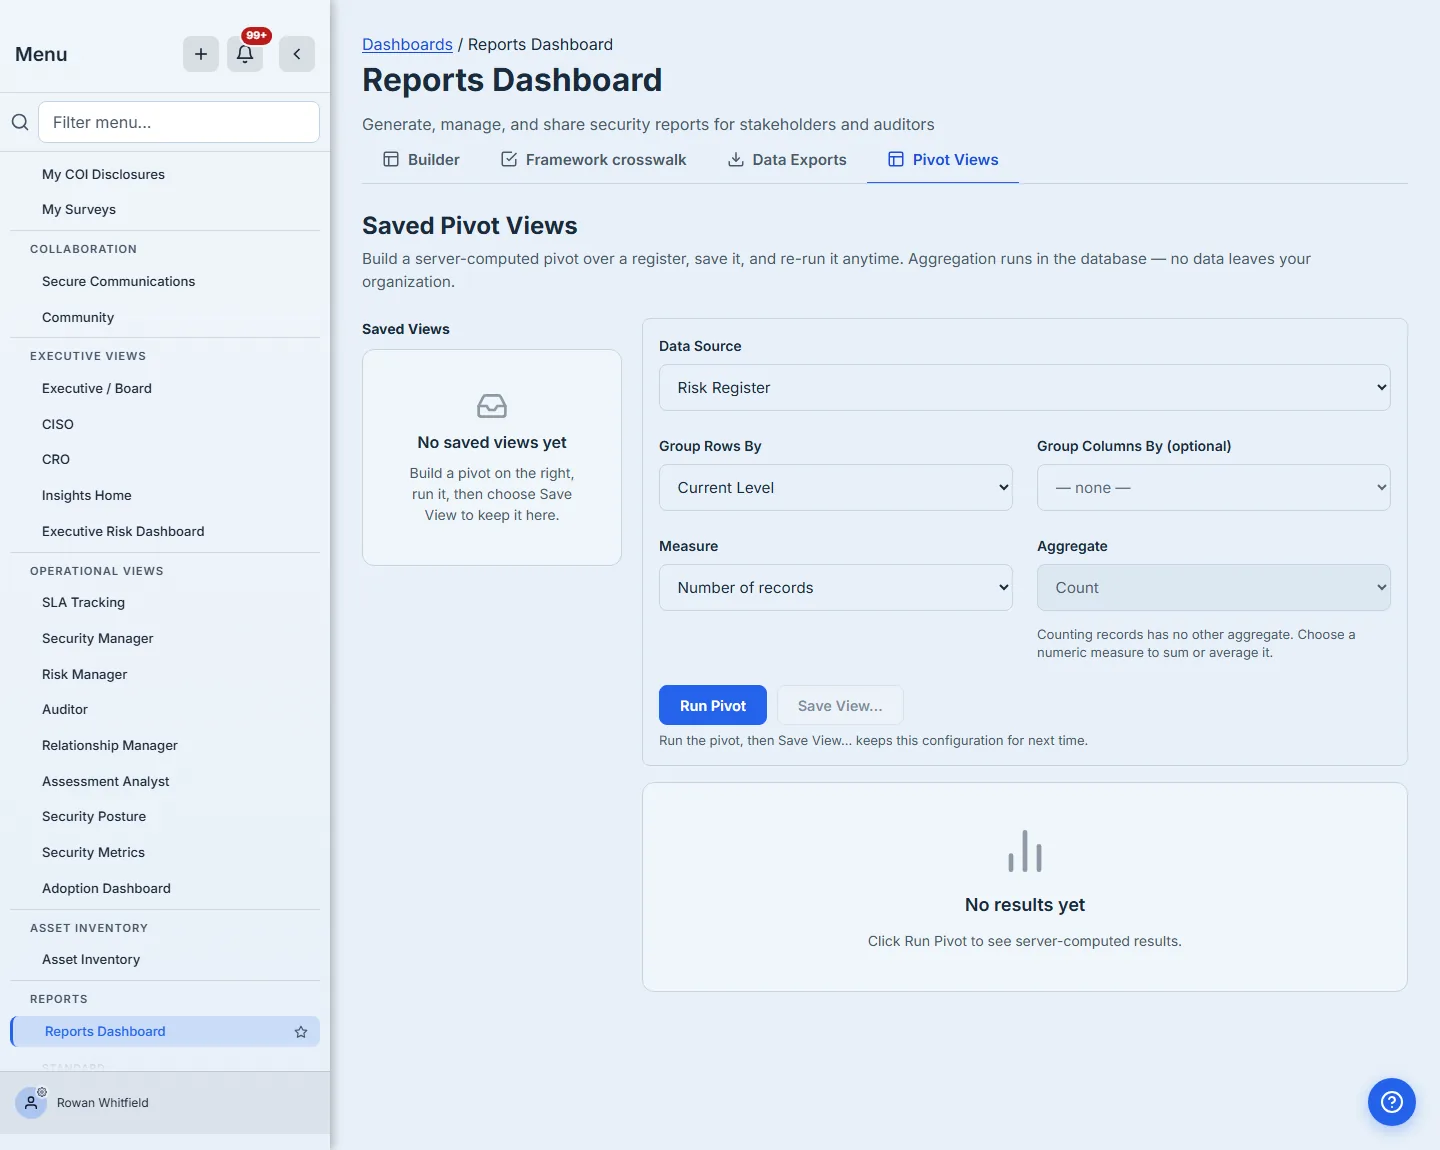
The aggregation runs in the database and returns the computed cells — the rows never leave your organisation to be counted somewhere else. Save the result as a view and re-run it whenever you need it: what is stored is the pivot’s definition, not a snapshot of its numbers, so every run recomputes against current data.
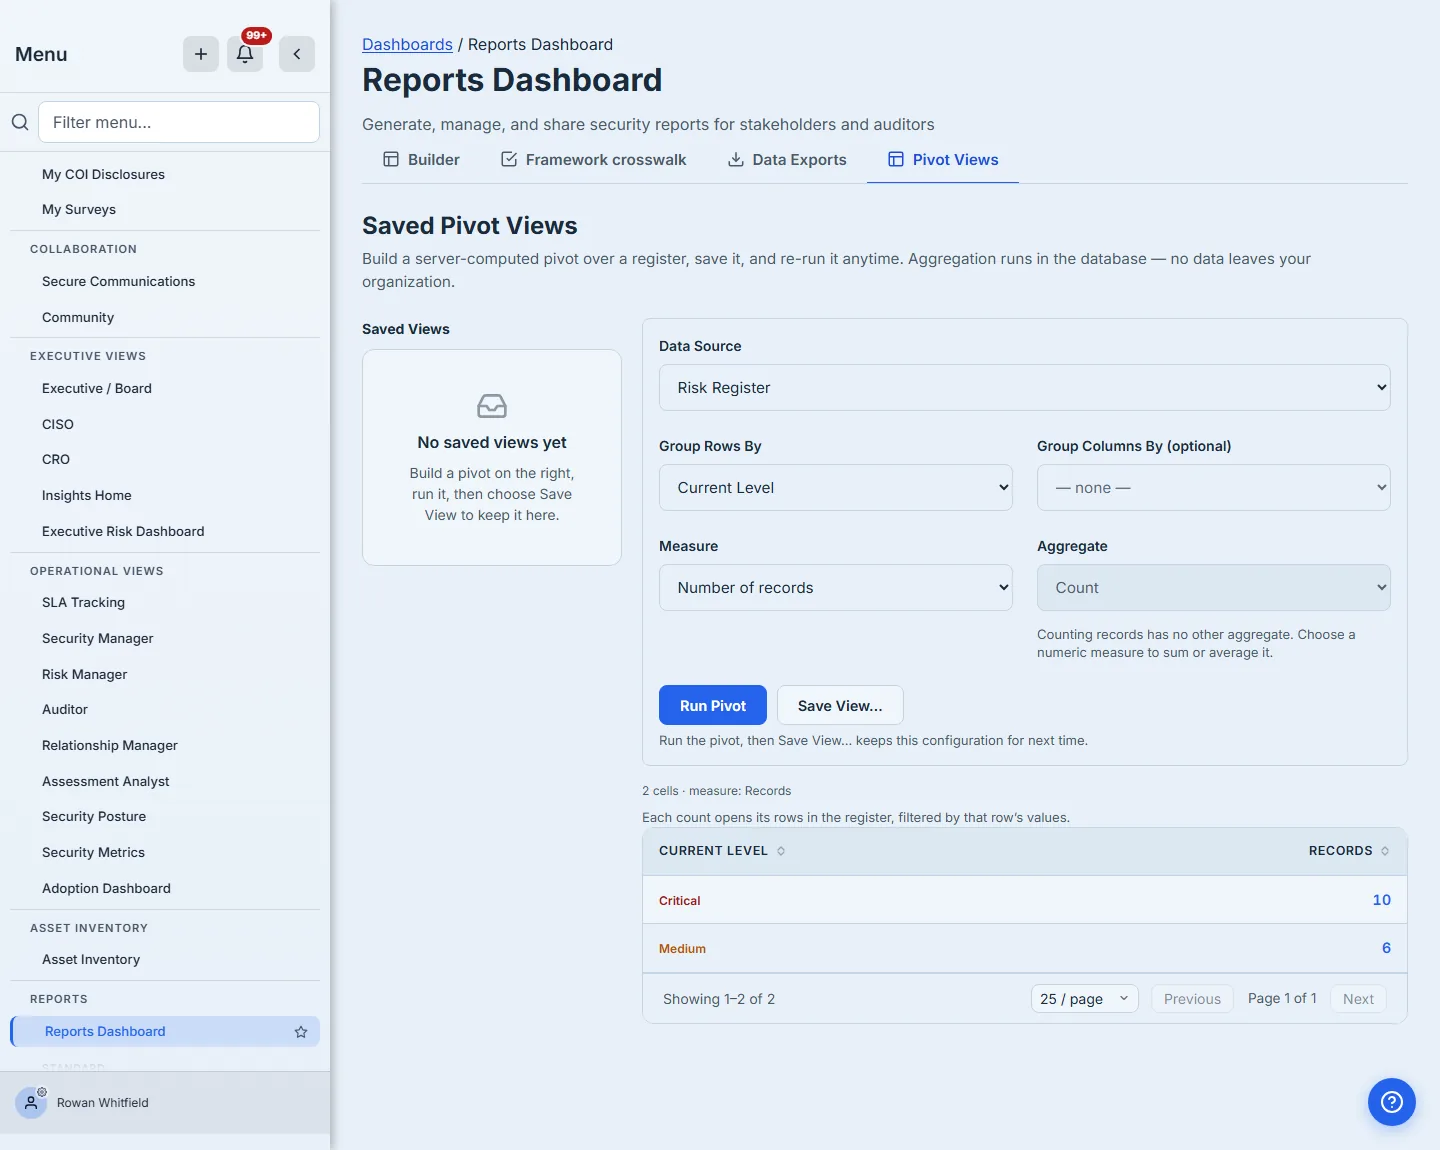
Each count is a link. Clicking 10 beside Critical opens the risk register filtered to those ten risks — not a search you have to reconstruct, but the same grouping the cell was computed from. That is the difference between a number you are told and a number you can check: an auditor who asks “which ten?” gets an answer in one click, and so does anyone who suspects the figure is wrong.
Counts link only where the destination can act on the filter. The risk register and the asset inventory read those values from the URL; the vendor and evidence lists do not, so their counts stay as plain text rather than becoming links that would open the whole list under a label promising a subset. A group with no value — the blank row for risks that have never been given a status — stays text for the same reason: a filter can ask for “critical”, but it cannot ask for “nothing”, and a link that quietly dropped the blank half would land you on more rows than you counted.
You do not have to start here
The hub is one door. From a record page that implies a report — vendors, contracts, risks, incidents, evidence, assets, access reviews, policy attestations, RoPA — the relevant reports are offered where you already are, so a question that occurs to you on the vendor page does not require a trip to the reporting section and back.
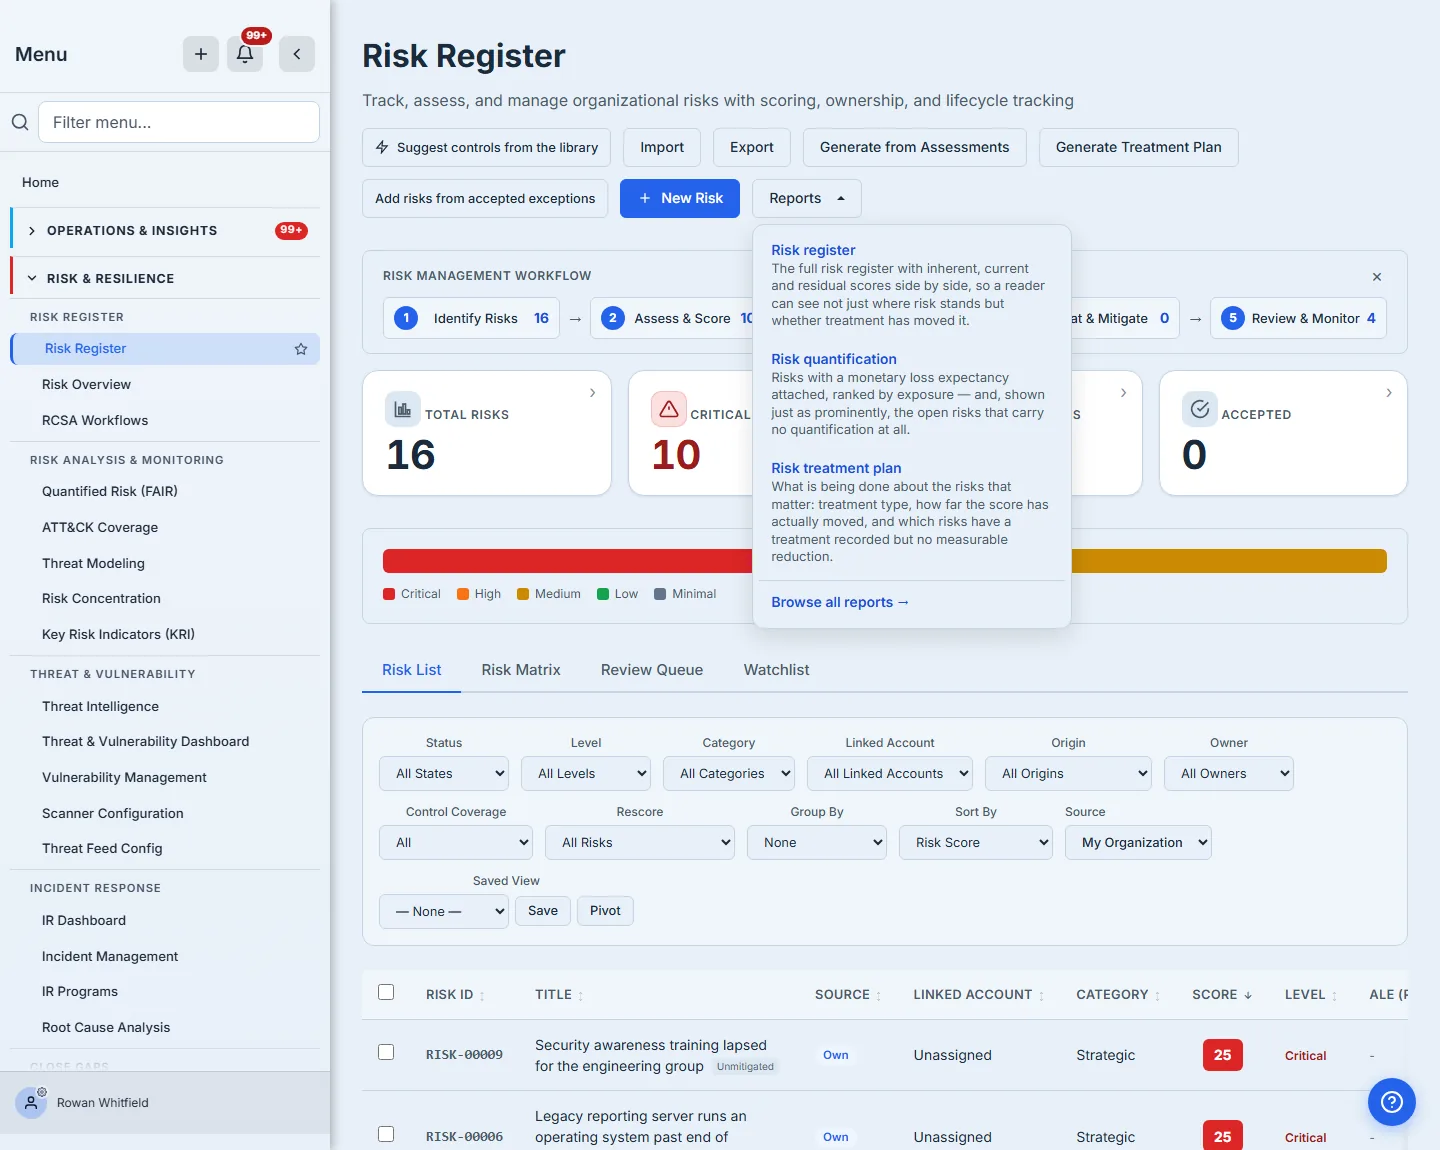
What is offered is scoped, not a copy of the library: on the risk register the menu holds the risk register itself, risk quantification and the treatment plan, each with the question it answers rather than its name alone. “Browse all reports” is underneath for everything else, so the shortcut never becomes a smaller, worse version of the library.
What you walk away with
- One hundred and three delivered templates, each with a plain-English description of the question it answers. Once your team has saved a copy of its own, the library header splits the count — the walkthrough capture below was taken when the library held eighty-one provided templates, and reads “83 templates · 81 provided by Talarity” — so what Talarity ships stays legible from what your organisation has authored. Before that first copy exists there is nothing to separate, and the header stays a single number.
- A copy you own whenever you change one of ours — stamped with the template and version it forked from, so improvements can be offered rather than imposed.
- A governed document per generation: status, signatures, commentary, retention, and an as-of date.
- A provenance line under every figure — dataset, timestamp, row count — so an auditor can trace a number instead of trusting it.
- An integrity check that re-computes, so “verified” means the copy in front of you is the one that was published.
- A cadence and a distribution list — scheduled delivery that records what the mail system accepted, and expiring share links for people outside your organisation. A recipient who has no Talarity account is walked through creating one on first click and then sees only what was shared with them — the report is never served anonymously, which is what makes each open attributable to a named person. Bounces are counted once your mail provider reports one; until it does, the bounce rate reads as unmeasured rather than as zero, because “nobody bounced” and “nobody has told us” are different statements.
Open /app/reports, pick Auditors and assessors, and generate one against last quarter. The first one takes about two minutes. After that the same report is a scheduled email and a share link, and the only thing you do each quarter is read it.