Every framework that touches your security programme eventually asks you to show a control is operating, not merely that it exists. SOC 2 puts it in CC4.1 — the entity evaluates whether its controls are functioning. ISO 27001:2022 says it in 9.1 and A.5.36: monitor, measure, and keep the evidence of the results. HIPAA’s Security Rule asks for it at §164.308(a)(1)(ii)(D) as information system activity review.
Here is the failure mode nobody writes a control for. A monitoring dashboard renders a 0, and a zero is two completely different statements wearing the same digit:
- We measured this, and there is nothing wrong.
- We measured nothing at all.
The first is assurance. The second is the absence of assurance — and on almost every dashboard ever built they are pixel-identical, right up until an auditor asks how you know, or a quarter closes on a control that silently stopped collecting in week two.
Security Signals is built so those two can never be confused. This article is a tour of every state the page can be in when it has nothing to show you, and what each one is actually telling you.
Who’s involved
- Security or IT lead — connects the sources, and needs to know within a day when one stops reporting.
- Compliance manager — has to describe, in words an auditor accepts, what was monitored and over what period.
- Auditor — asks the only question that matters here: was this control operating for the whole period, and how do you know?
Step 1 — The first thing the page tells you is not a number
Before any ranking, any score, any count, Security Signals answers a prior question: is there anything behind these numbers at all? The coverage banner sits at the top of the page body, directly beneath the tab strip and above the KPI band and every table, and it renders in every state the page can successfully load — including, and especially, the states where there is nothing to rank. (There is one state it does not appear in, and that is deliberate; it is Step 4.)
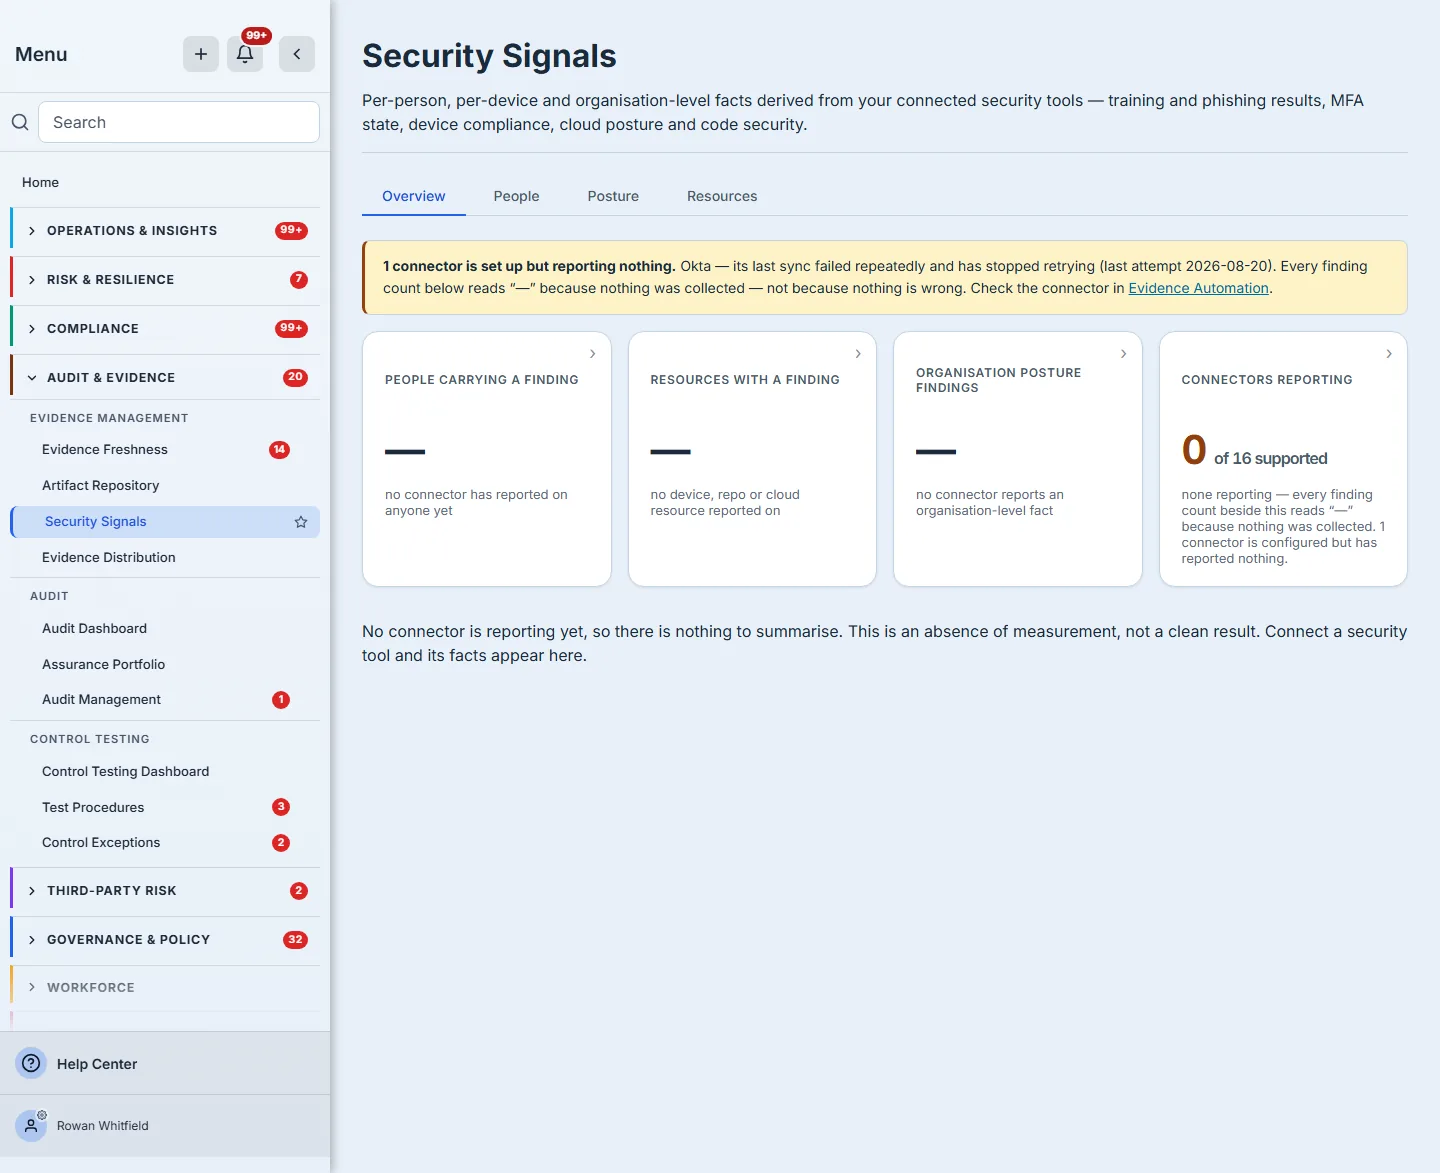
A connector that is set up and reporting nothing is a failure, not an absence — and it is the most actionable state this page can show. Somebody configured that integration and it is not working.
That distinction is load-bearing, and it is worth saying what it replaced. The page used to answer “is anything connected?” by checking whether any signals existed. So an organisation whose identity connector had been dead-lettered for six days was told “No connector has reported yet — none connected.” Both halves were false. The connector was connected. It was broken. Those two states need different people doing different things on different days.
Behind the scenes the page now asks the questions separately: configured comes from your connector instances, reporting comes from whether signals actually arrived, and the banner is assembled from both. When a connector is configured and silent, the banner names it, states what its last sync did, and dates the attempt — because a count with no date invites you to assume it is current, and “0 phishing clicks” from a sync three weeks ago reads as good news and is not.
Step 2 — Day one is a door, not a dead end
A brand-new organisation has no connectors at all. That is a completely legitimate state and not a failure of anything, so it gets its own message rather than the broken-connector one.
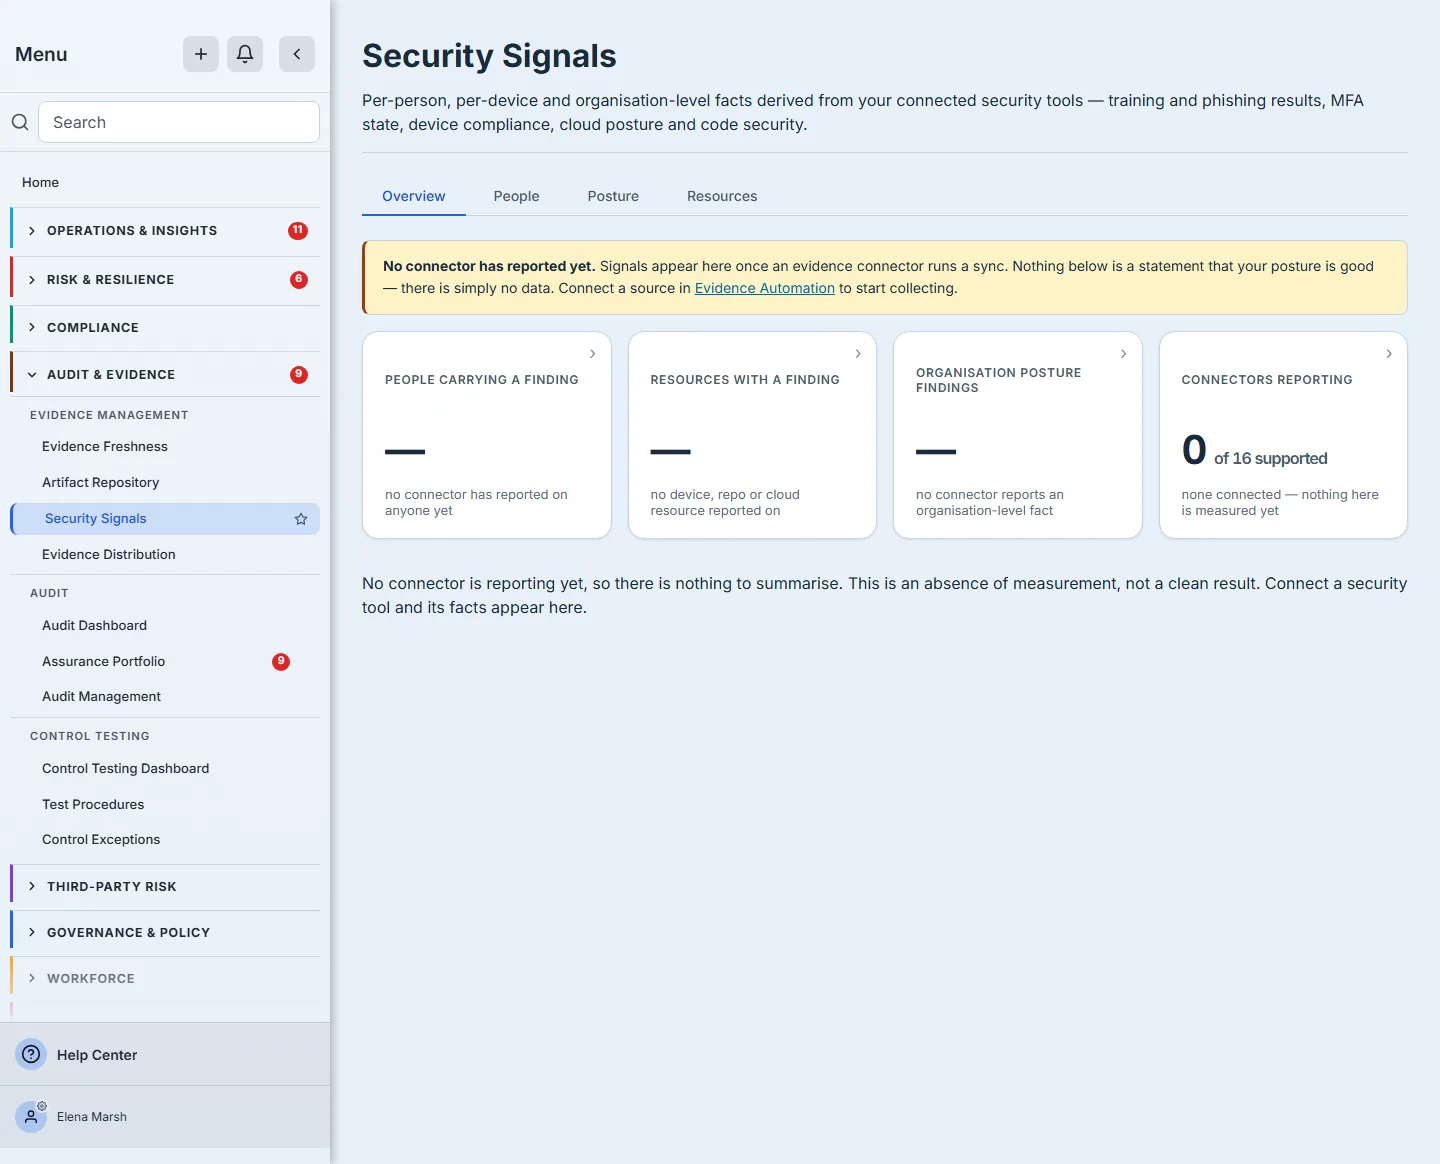
The wording is deliberate: nothing below is a statement that your posture is good — there is simply no data. Then it hands you the one action that changes that.
An empty state that only says “no results” teaches people to scroll past it. An empty state that says what its emptiness means, and offers the next step, is the difference between a page someone finishes setting up and a page someone abandons.
Step 3 — Filter to one connector, and every claim narrows with it
Scope a page to a single source and something subtle goes wrong on most dashboards: the numbers narrow, and the sentences around them do not.
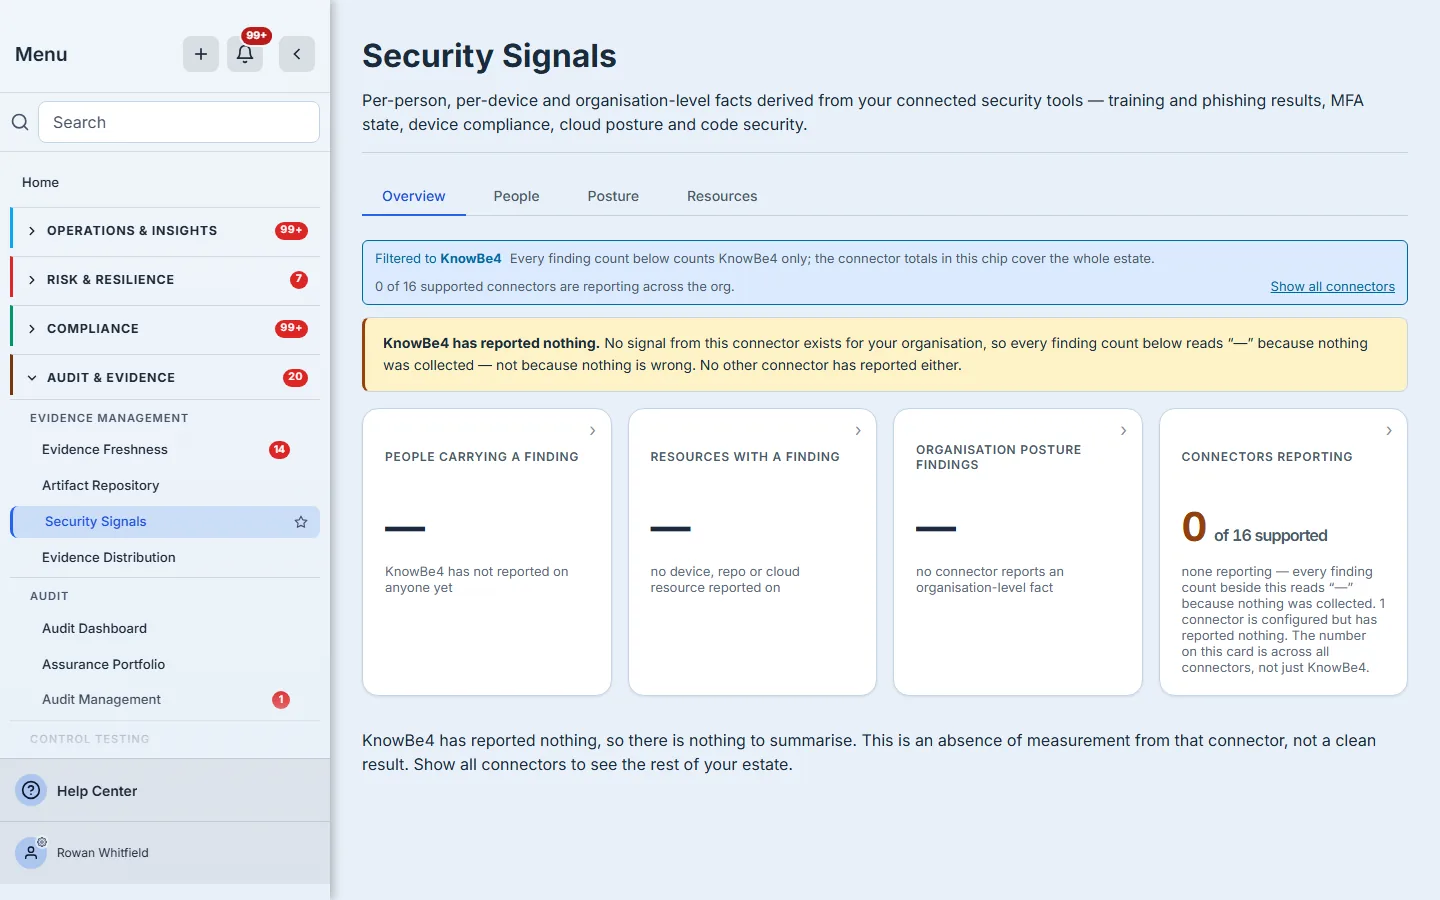
Under a filter, “is anything reporting?” has to be answered inside the filtered scope too. Otherwise a connector with zero rows gets an all-clear because a healthy sibling exists somewhere else in your estate — a true sentence about the wrong population, which is the most durable kind of wrong.
So the filtered empty state is its own message. It names the connector, says that connector has reported nothing, and separately tells you whether anything else is reporting — because this one is dead and everything is dead are different emergencies with different first phone calls.
The scope note also separates finding counts from connector totals. They are not the same number, and a chip promising “every count here covers one connector” while the payload carries estate-wide exceptions further down is a promise the page cannot keep.
Step 4 — A broken link is refused, not answered with zeros
This is the state most systems get wrong, and the one an auditor is most likely to stumble into: a stale bookmark, a hand-edited URL, a link pasted out of a report written last quarter, naming a connector that no longer exists.
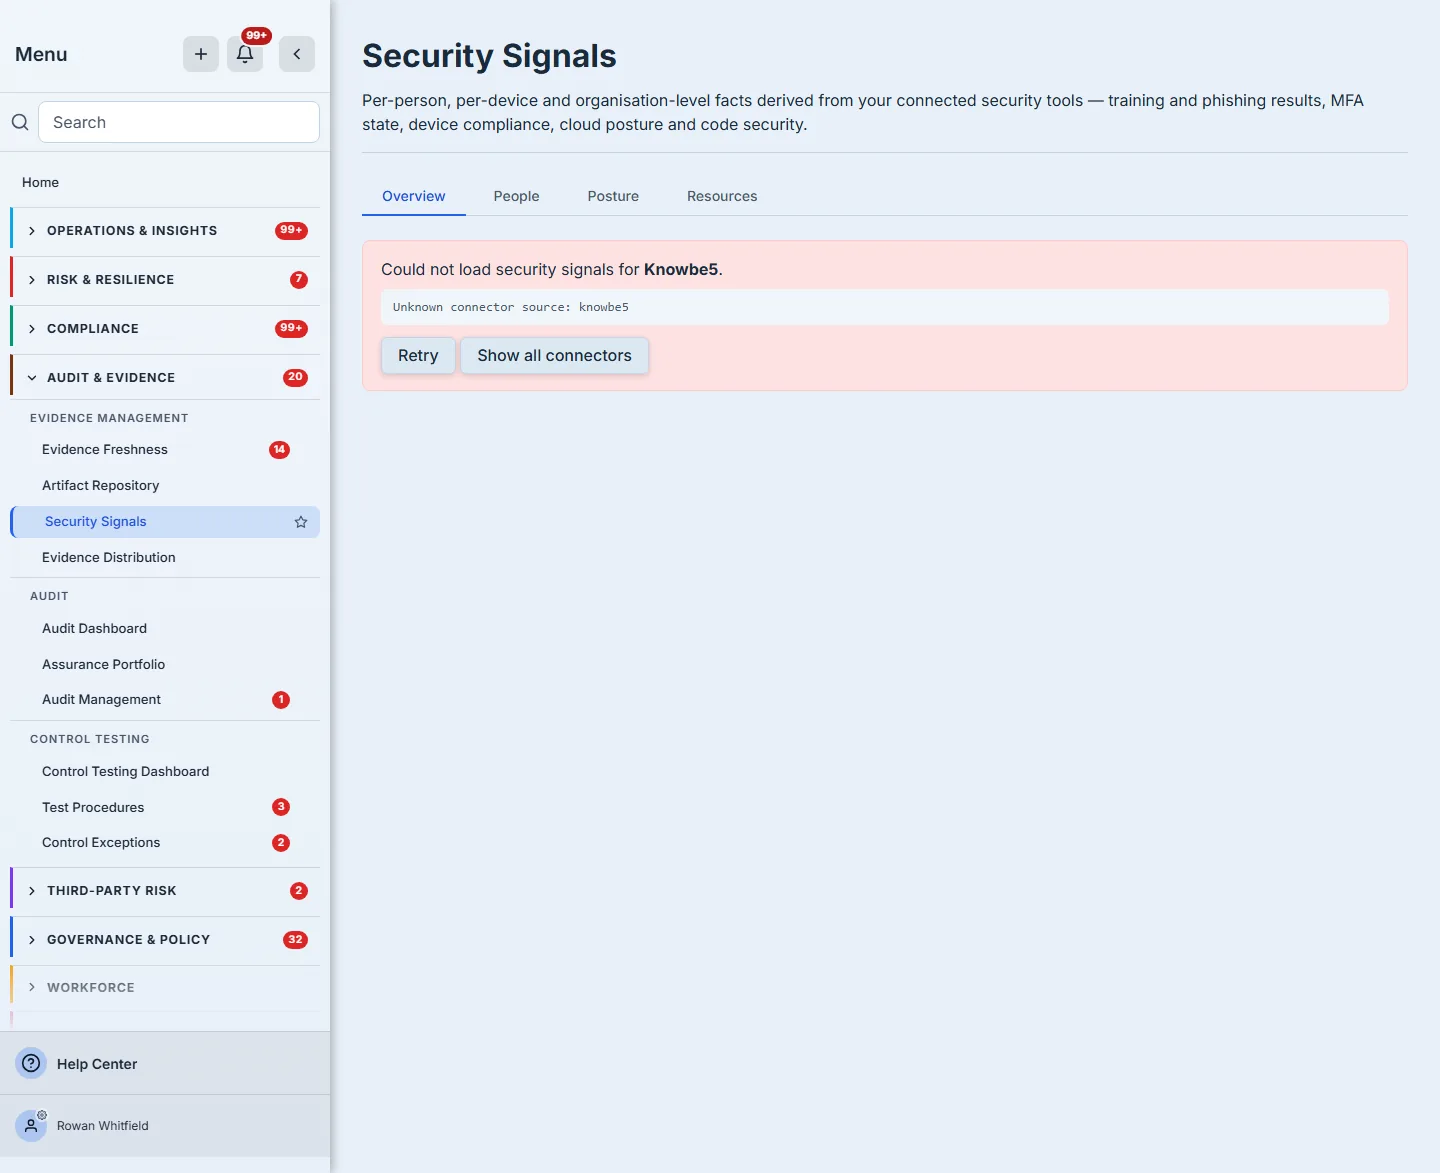
The tempting behaviour is to apply the filter anyway. It costs nothing, it returns a perfectly well-formed payload, and every count on it is zero — which every surface downstream renders as connected, nothing wrong. A page of zeros produced by a typo is indistinguishable from a page of zeros produced by a clean estate.
So the request is refused, and the page turns that into an error state with two exits: a Retry for the case where something transient happened, and a route back to the unfiltered page for the case where the link itself is wrong. Retry alone would be a trap — retrying a refused filter refuses again, forever.
What this article deliberately does not show you
Every screenshot above is a page with no data behind it. That is the subject, and it is the honest limit of this piece: the organisation shown here has no connected source, so nothing below could be photographed for it. The features are not missing, and saying so plainly is the point — a walkthrough that quietly omits half a product teaches you the wrong shape of it.
So, for the record, here is what Security Signals does once a source is connected, none of which appears in the images above:
- It ranks people by scored risk, and shows its working. Each person’s score breaks down into the individual findings that produced it, each carrying the source’s own denominator — “5 of 25 tests”, not a bare 5 — so a number can be argued with rather than merely accepted.
- It plots failing signals over time — one series each for People, Posture and Resources, with a note stating what the chart excludes. Posture carries a second series plotting the measured rate, because a recurring check’s pass/fail runs counted per week draw a sawtooth that hides a real improvement. Needs weeks of collection before any of them says anything, which no single sync can produce.
- It turns a finding into a tracked obligation. Raise as risk creates a register entry carrying the connector, the subject, the severity, the collection it came from and the date the source observed it — and the button tells you when that signal has already been raised, before you press it.
- It has a triage lifecycle on the signals themselves — a status that moves, an assignee, a time-boxed suppression, and a work item created per assignee and subject so assigning two hundred rows does not create two hundred tasks.
- It reports on devices, repositories and cloud resources, not only people, with the date each was last observed.
- It says when a list has been cut, naming which tab was capped, and it stops counting findings from a source you have disconnected — telling you how many it excluded and which connectors they came from.
- It holds an identity it cannot place, rather than dropping it. A connector identity whose email matches no employee record is counted and shown as not matched to an employee, with the note that it therefore cannot be assigned to anyone — because an unmatchable person quietly discarded is a coverage gap that looks like coverage.
- It separates machines from people. Service accounts and other machine identities are held in their own count rather than inflating the unmatched figure, since no employee record is expected for them in the first place. Identities belonging to people who have left are likewise counted separately.
- It names who is failing more than one thing. A person carrying findings against several controls at once is counted and ranked separately from a person carrying one, because those are different conversations.
- It refuses to score what it could not conclude. A finding whose source returned no conclusive result is counted as exactly that — no conclusive result — and never folded into either a pass or a fail. This is the same principle as the whole article, applied one level down: at the level of a single person, an absent fact and a negative fact are held apart.
Each of those needs a connected identity, training or cloud source to render, and this walkthrough was written on an organisation that has none. We would rather tell you they exist than show you a picture we staged.
What this buys you at audit
- A zero you can defend. Every count is accompanied by whether anything was collected to produce it, so “no findings” and “no data” are never the same sentence.
- A broken connector surfaces as a failure — named, dated, and carrying its last sync state — instead of as a clean bill of health.
- Bounded lists say they are bounded. Where a table is capped the page says so and names which tab was cut, so a truncated view is never read as a complete one.
- Findings from a disconnected source stop counting, and the page states how many were excluded and which connectors they came from — because a number that silently shrinks misleads exactly as much as one that silently persists.
- Every fact carries its provenance in the record. Each signal stores the collection it was derived from and the date the source observed it — and where the source dated nothing, the page says so rather than substituting the sync time. A risk raised from a signal carries both forward, so the register entry can still be aged years later without re-parsing anything.
Open Security Signals under Audit & Evidence, in the Evidence Management section — the sidebar row directly beneath Artifact Repository. What feeds it is Evidence Automation, which is not a sidebar row of its own: it is a tab on the Evidence Freshness hub, and it is where the banner’s own link sends you. If you have never connected a source, the page will tell you so in those words and hand you the link. If you have, the first thing it tells you is whether your sources are still talking — which, on the day one of them quietly stops, is the only thing on the page that matters.