Every regulator that touches third-party risk asks the same first question: what data does this vendor actually have? The SEC’s amended Regulation S-P (effective 2024) makes it explicit — your incident-response program has to know which service providers hold customer information so you can notify within 30 days of a breach at their shop. GDPR Article 30 requires a record of processing activities that names every processor and the categories of data they handle. The GLBA Safeguards Rule expects you to oversee service providers by the data you entrust to them. None of that is answerable from memory.
Most teams answer it with a spreadsheet — a grid of vendors down one axis, data types across the top, an “X” in the cells. It works exactly once. The day a vendor’s scope changes, or a new SaaS tool starts touching payroll, or someone leaves and the tab goes unowned, the map quietly goes wrong — and you don’t find out until an auditor or an incident forces the question.
Talarity treats data mapping as a live surface, not a document. The same vendors you already manage, the same risk tiers you already compute, wired into a matrix that stays current on its own and turns “who holds what” into a number you can act on.
Who’s involved
- Vendor / TPRM owner — builds the data-type catalog, maps each vendor, and reviews the exposure the map produces.
- Privacy or compliance lead — reads the map as the record of processing: which categories of regulated data sit with which processor.
- Security analyst — uses the derived exposure score to prioritize assessments, contracts, and monitoring on the vendors that hold the most sensitive data.
- Auditor — reads the matrix, the per-cell handling mode, and the review timestamps as evidence that oversight is real and current.
What’s on the page
The whole capability lives at /app/vendor-data-map (“Data Mapping” under Third-Party Risk → Vendor Inventory), organized into three tabs:
- Matrix — the interactive heatmap: data types (rows, grouped by domain) × vendors (columns), each cell colored by derived exposure.
- Data Type Catalog — the library of the data types your organization actually handles, each with a domain and a sensitivity rating.
- Criticality & Continuity — designate critical vendors and record business-continuity risk in one place.
Step 1 — Start from the matrix
The Matrix tab is the home screen. Across the top, a KPI strip reads the whole map at a glance: data types cataloged, vendors mapped, severe-exposure cells, flagged-critical vendors, and your single biggest data concentration. Below it, the heatmap: every data type your org handles, every active vendor, and a colored cell wherever a vendor touches that data.
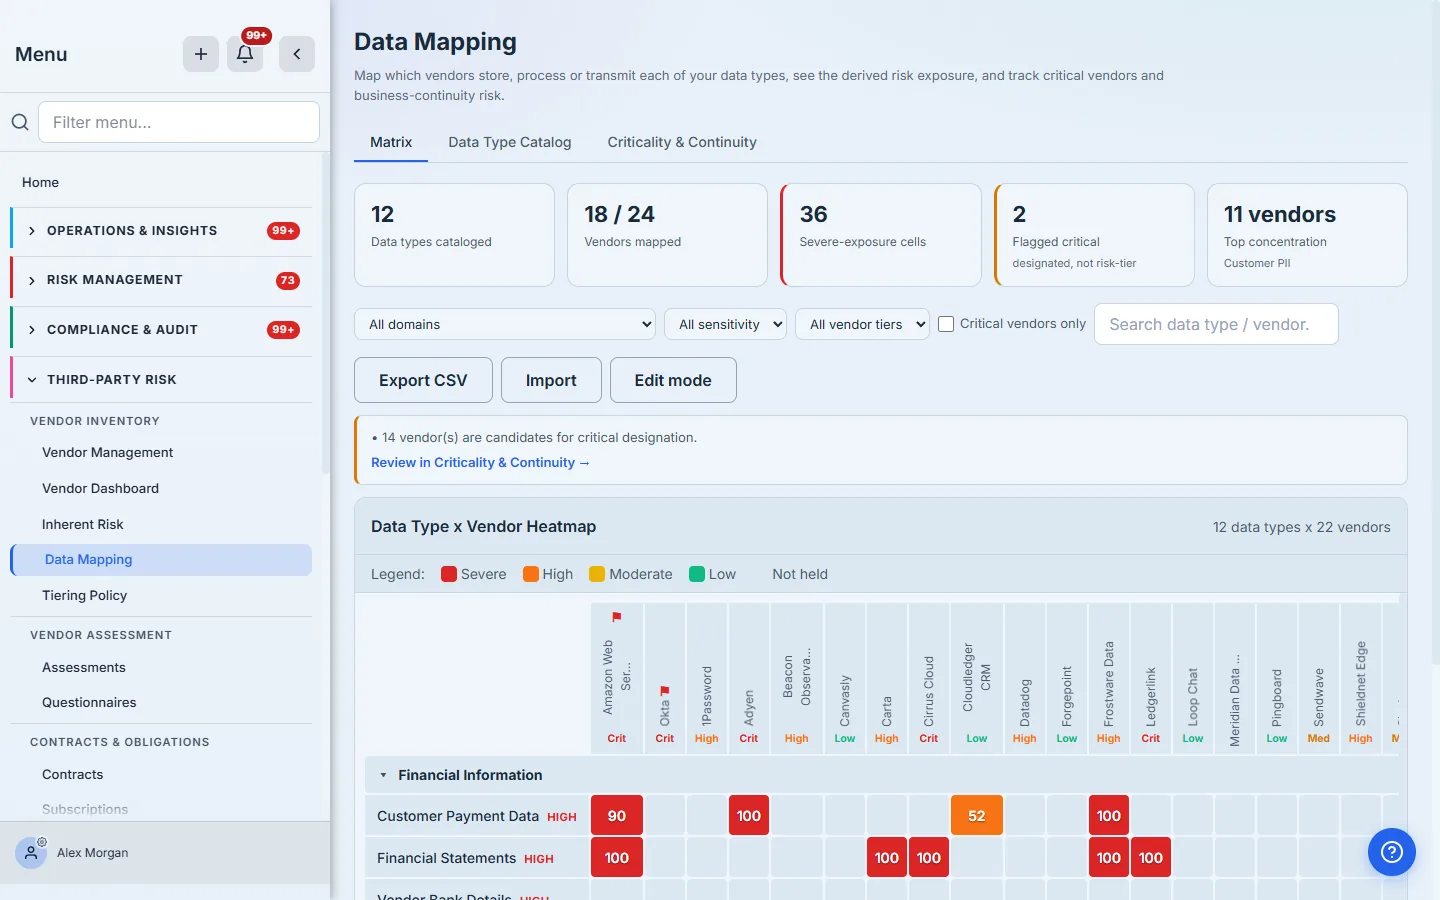
The color isn’t hand-set. Each cell’s exposure is derived — the data type’s sensitivity, weighted by how the vendor handles it (storing is worse than processing, processing worse than transmitting), scaled by the vendor’s own inherent-risk score. A high-sensitivity data type stored by a critical vendor lands severe; the same data type merely transmitted by a low-risk vendor lands lower. The legend maps four bands — Severe, High, Moderate, Low — and blank cells mean “not held.”
Why derived, not typed: a static map tells you a vendor has your data. A derived one tells you how much that should worry you — and it moves when the vendor’s risk moves, without anyone re-scoring the grid by hand.
Step 2 — Build your data-type catalog
Before you can map anything, you name the data your organization actually handles. The Data Type Catalog tab is that library. Each data type carries a primary domain (Financial Information, Personal Information, Technology & Cybersecurity, Regulatory & Compliance, and so on) and a sensitivity rating that feeds the exposure math.
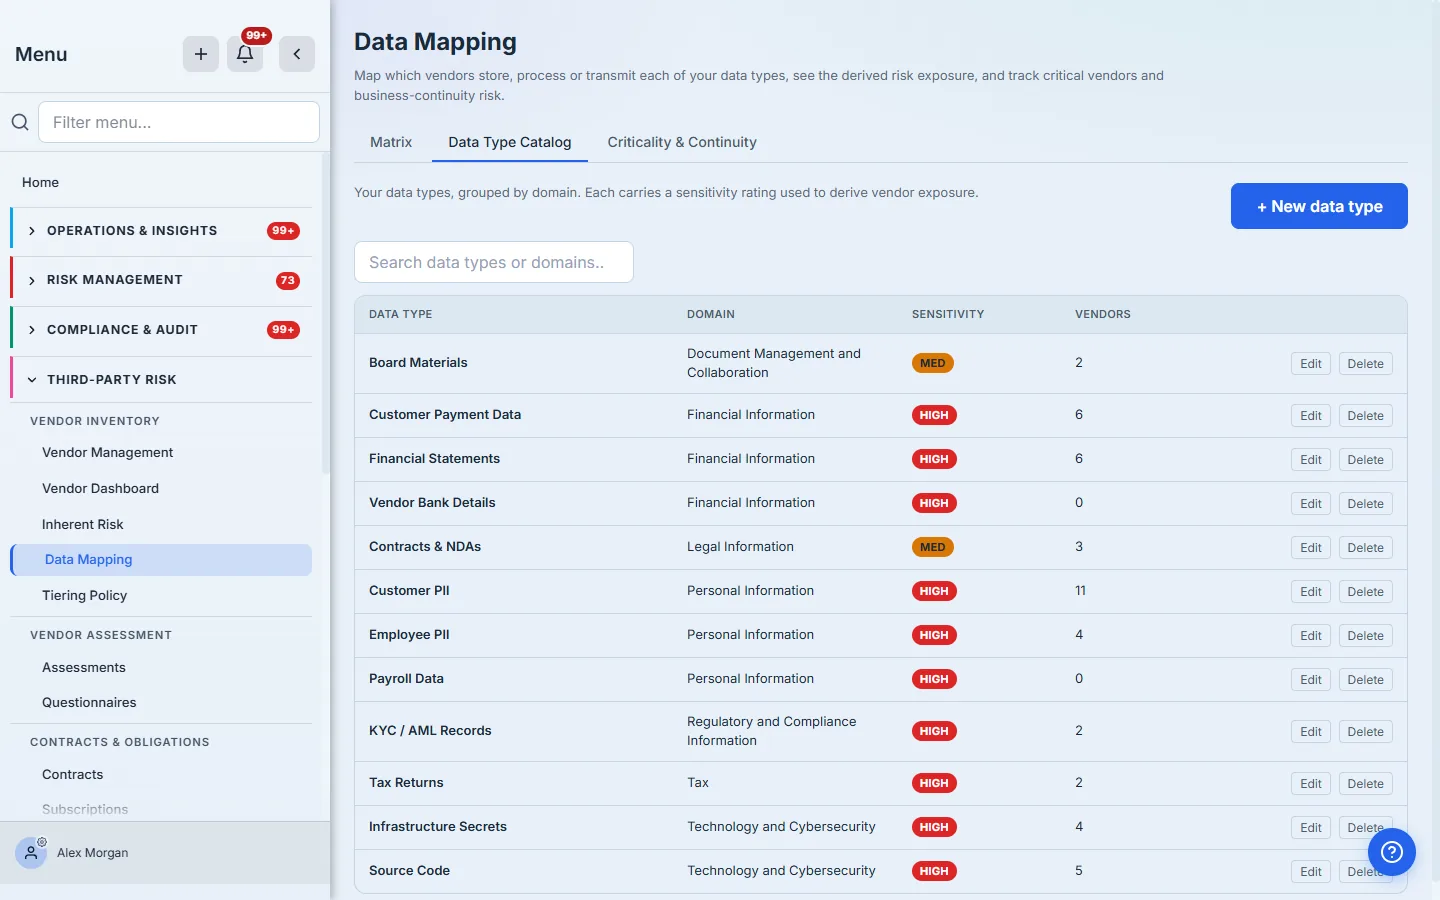
The catalog ships with the domains most programs need and lets you add your own data types with + New data type. The “Vendors” column is a live count — how many vendors currently hold each type — so you can see your concentration risk straight from the library.
Step 3 — Add a data type
Adding one is a single modal. Give it a name, an optional description, a primary domain, and a sensitivity rating. The last field — Data class — is the one that does the quiet work: it maps the data type onto the risk vocabulary that feeds vendor scoring, so classifying a vendor’s data actually moves its risk profile rather than just labeling it.
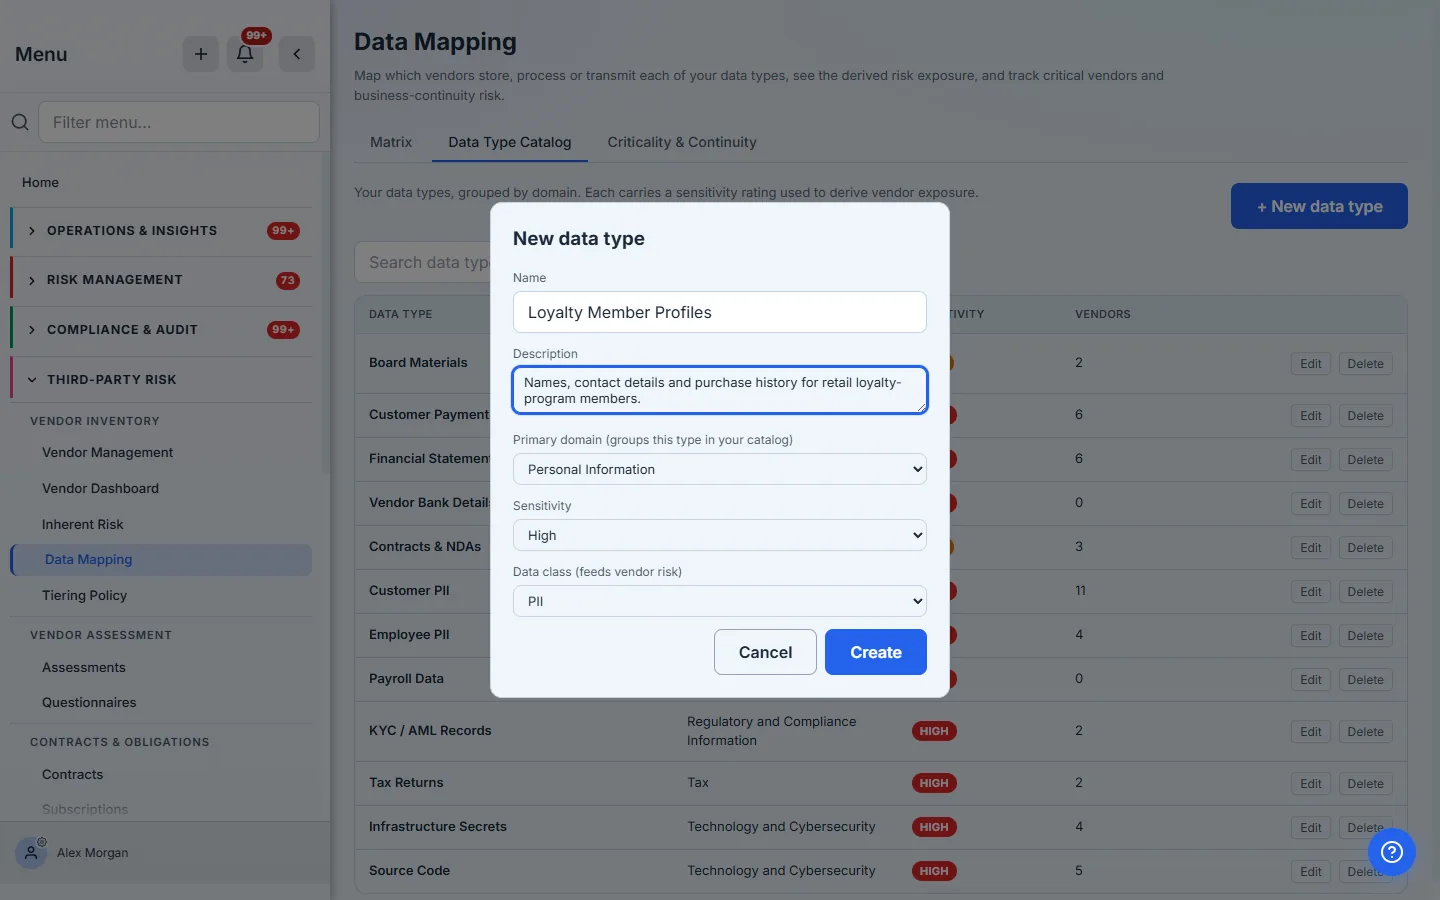
Sensitivity vs. data class: sensitivity (High / Medium / Low) sets how much a cell contributes to exposure. Data class (PII, PCI, Financial, Regulated…) is the vocabulary your vendor-risk engine already speaks — setting it lets a data mapping derive a vendor’s data-sensitivity factor instead of asking someone to answer it twice.
Step 4 — Map a vendor, cell by cell
Mapping is direct manipulation. Press Edit mode and every empty cell becomes a clickable target — click where a vendor touches a data type. Nothing is written as you click: changes stage in a bar at the bottom that counts your unsaved edits, and you commit them all at once with Save changes (or throw them away with Discard).
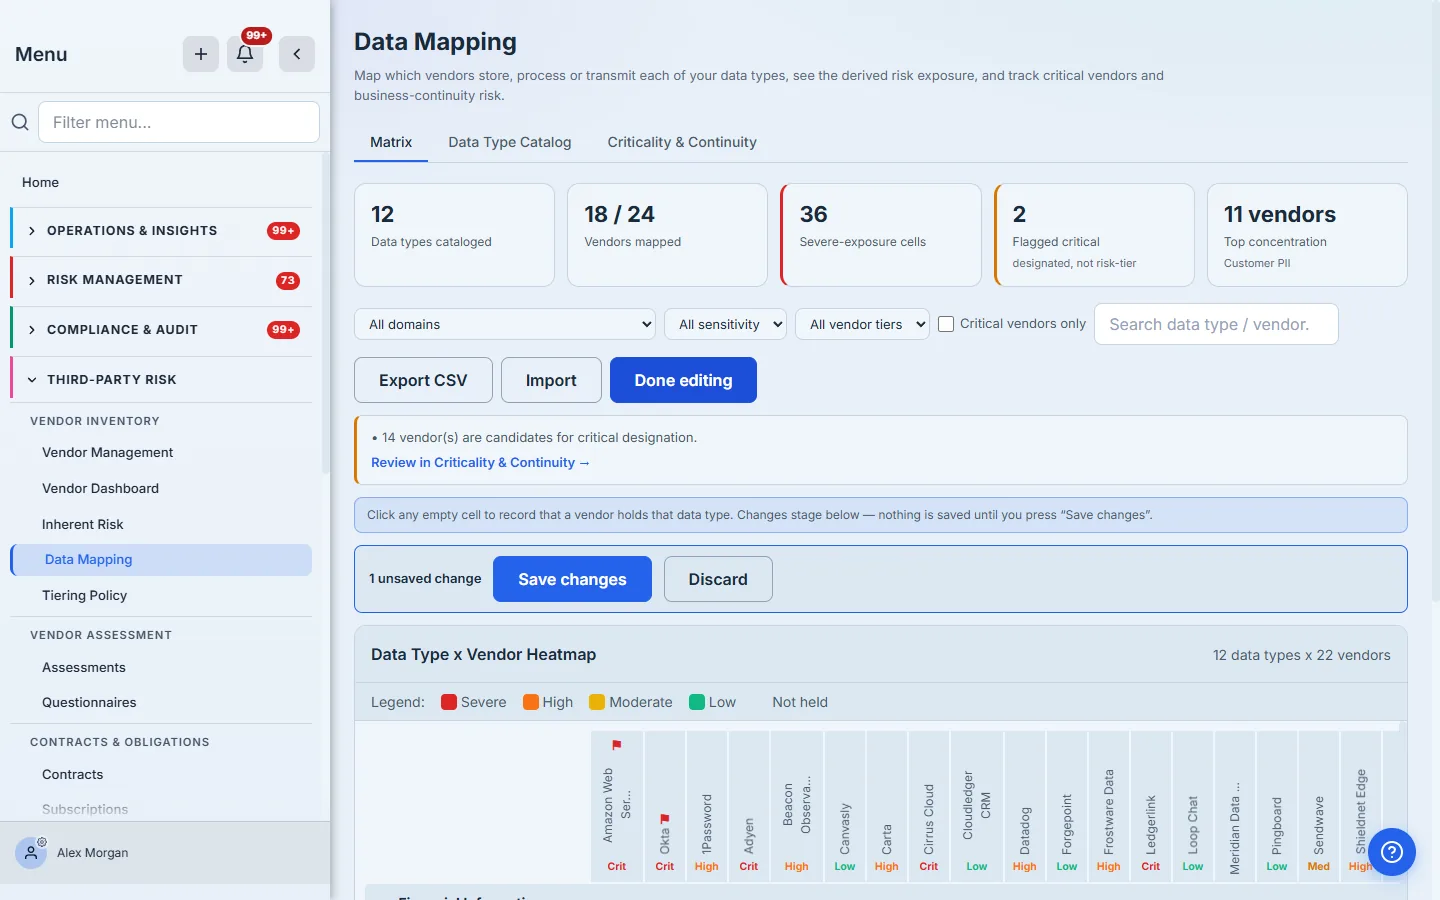
That staging matters at scale: you can walk a vendor’s whole row, or a data type’s whole column, and review the set before a single write hits the record.
Step 5 — Open a cell for the detail
Click any populated cell and a drawer opens with everything that cell means: the derived exposure and its band, whether the vendor stores, processes, or transmits the data, the sensitivity, and — this is the point — the actions that tie the map into the rest of your program. Launch an assessment scoped to this vendor, open a finding, jump to the contract, or remove the mapping.
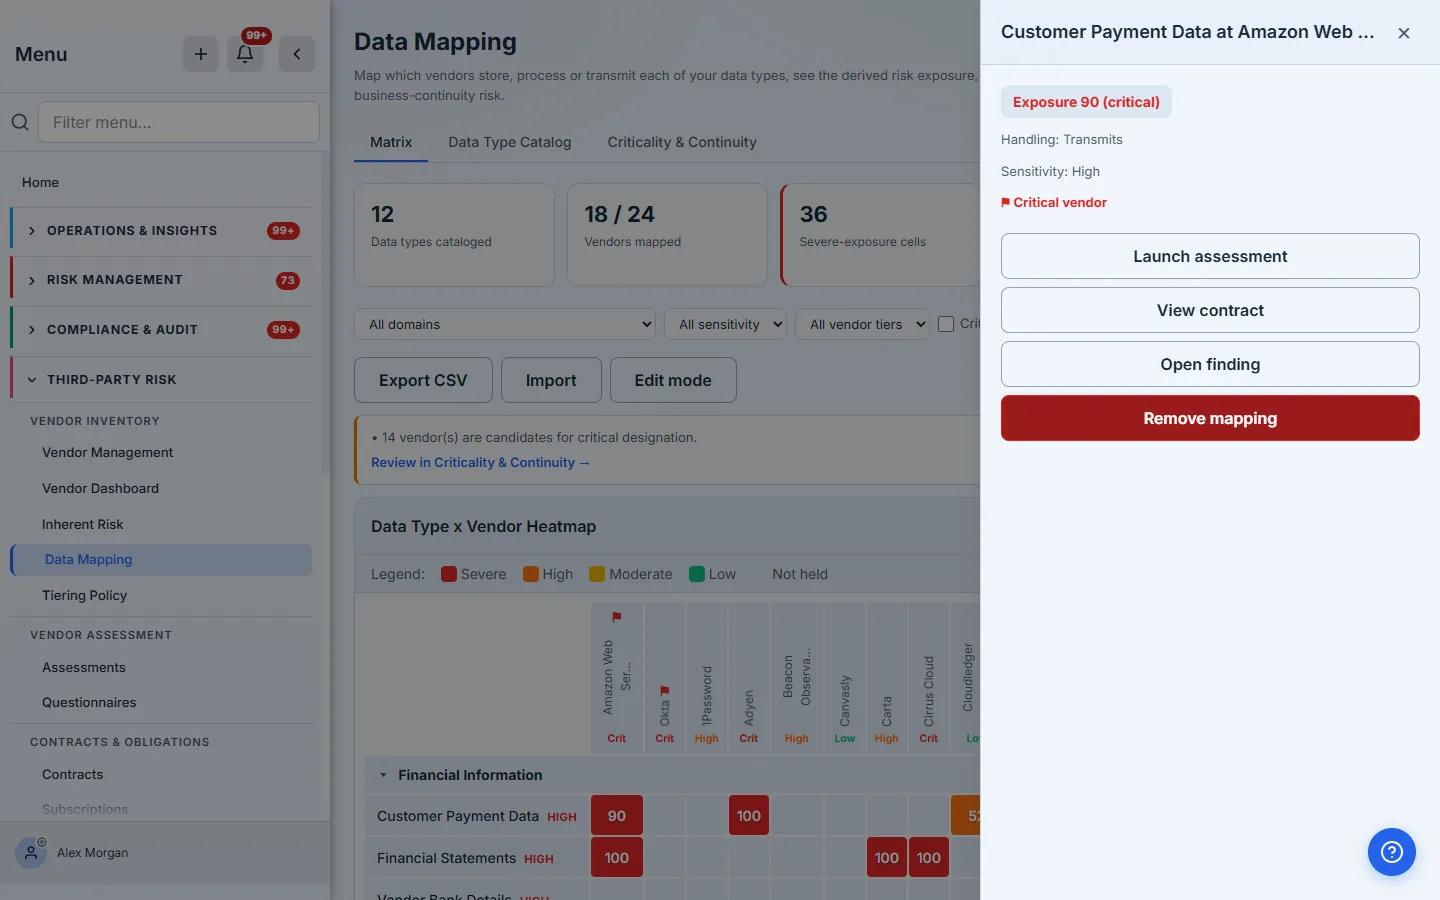
The map isn’t a dead-end artifact. Every cell is a launch point into the workflows that act on what it tells you.
Step 6 — Import your existing map
You almost certainly already have a spreadsheet. You don’t have to retype it. The Import wizard takes a CSV or JSON export — data-type rows plus vendor columns — matches the vendors against your existing inventory, and previews every create and every cell before anything is written.
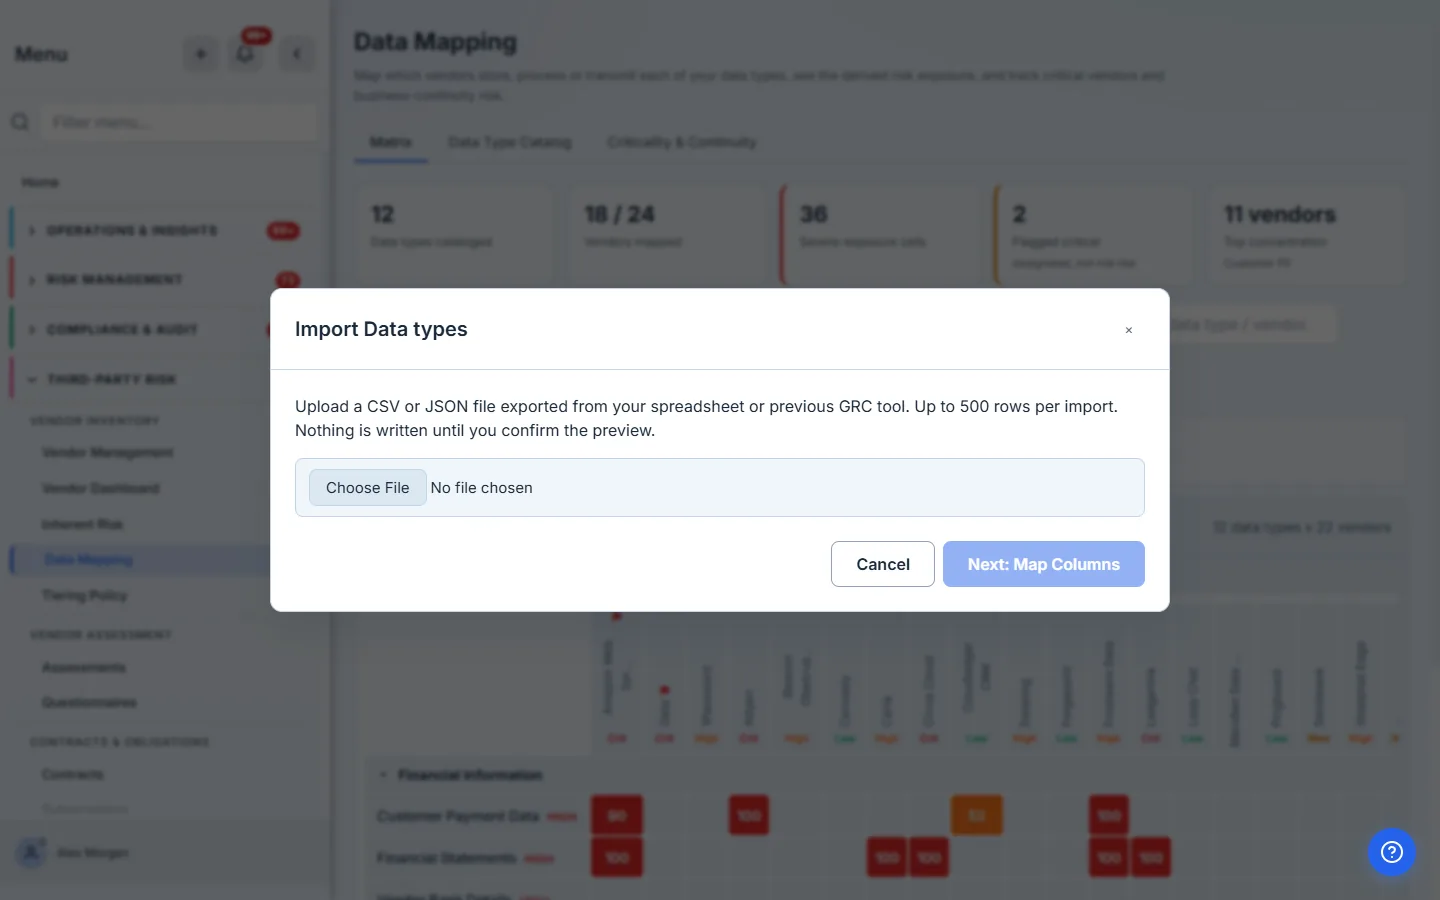
The one-pass migration: the Reg S-P critical-vendor spreadsheet most teams already maintain imports in a single pass — the data-type rows become your catalog, the vendor columns become mappings, and the exposure scores compute on arrival.
Step 7 — See it on the vendor record
The map doesn’t stay siloed on one page. Open any vendor and its Risk tab now carries a Data Exposure card: the vendor’s exposure score, its business-continuity risk, and the top data types it holds by exposure — with a link straight to its slice of the full map.
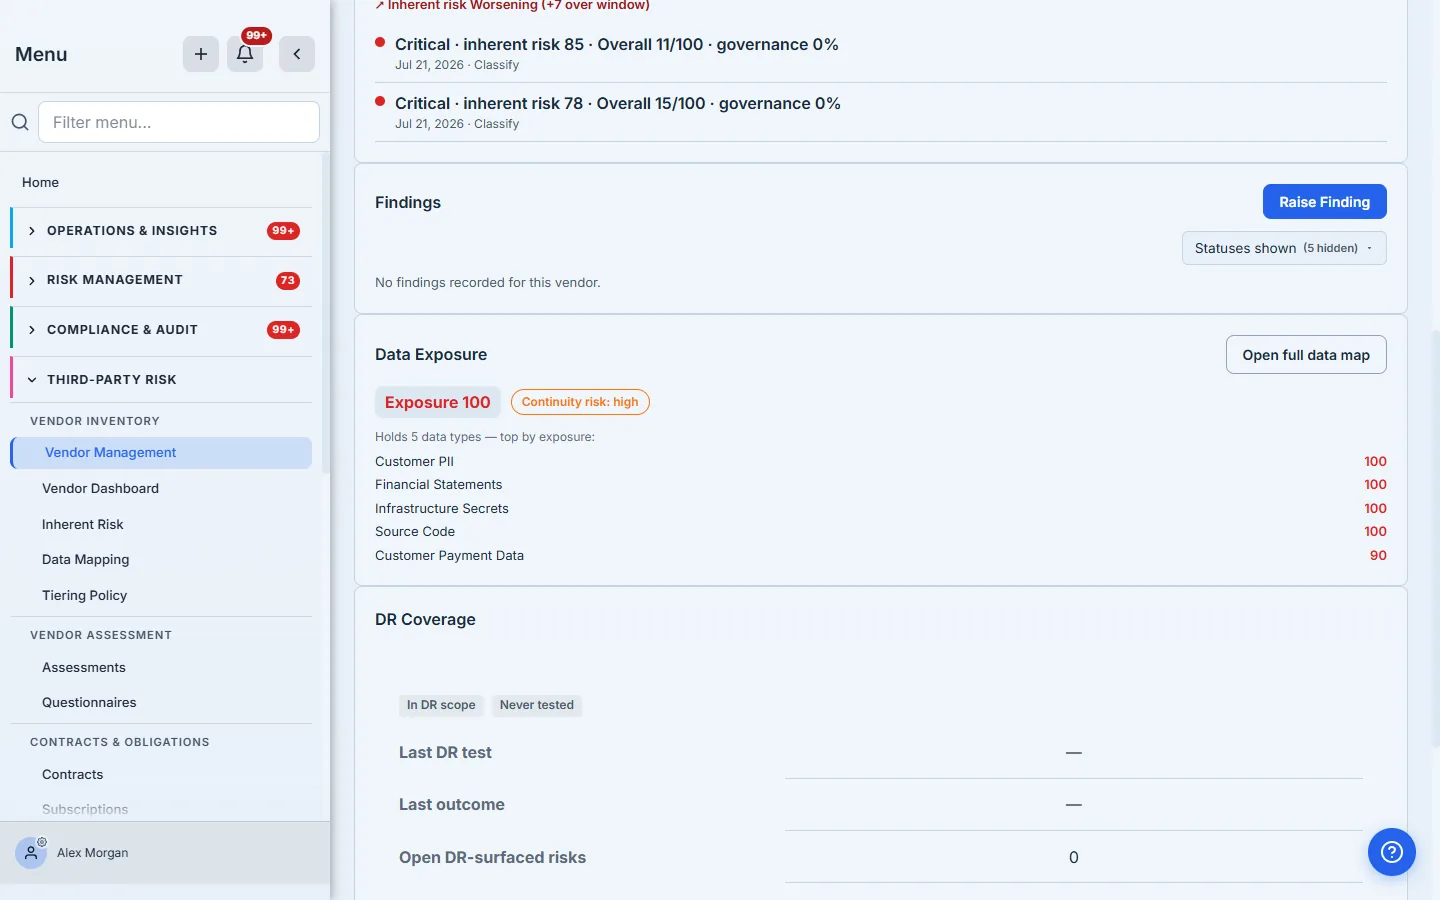
So the person doing a vendor review, the person triaging an incident, and the person prepping for an audit all see the same current answer to “what does this vendor hold?” — without opening a spreadsheet anyone has to remember to update.
What you walk away with
- A living record of processing — every vendor, every data type, storing / processing / transmitting — that satisfies GDPR Article 30 and answers Reg S-P’s “which providers hold customer data” on demand.
- A derived exposure score that ranks vendors by real data risk and moves on its own as vendor risk changes.
- A map that’s wired into the work — assessments, findings, contracts, and the vendor record all reachable from the cell — instead of a document that goes stale in a drawer.
The companion article, Vendor risk mapping, picks up where this leaves off: turning the exposure this map produces into criticality designations, business-continuity ratings, and a defensible picture of concentration risk across the whole portfolio.
Related: what data a vendor touches is one of the strongest inputs to inherent risk tiering, and it is the first thing to revisit at offboarding. Overview: vendor risk management.