A data map tells you what a vendor holds. Risk mapping answers the question that actually drives your program: so how much should this vendor worry me, and can I prove it? SOC 2 CC9.2 expects you to assess and manage vendor risk rather than treat every supplier alike. ISO 27001:2022 A.5.19–A.5.22 build the whole supplier-relationship domain on proportional scrutiny. The FFIEC and the 2023 Interagency Guidance both zero in on concentration — the risk that too much of your operation rides on one provider, or one provider’s one region.
The failure mode is a “critical vendor” list that’s really just a gut call in a spreadsheet cell — nobody can defend it, nobody updates it, and it’s disconnected from the data that should drive it. Talarity closes that gap. The exposure that data mapping derives becomes the input to three governance-grade outputs: a criticality designation that’s a deliberate act with a reason on the record, a business-continuity rating, and a portfolio view of where your data — and your operational dependence — actually concentrates.
Who’s involved
- TPRM owner — designates critical vendors, records business-continuity risk, and owns the concentration picture.
- Business-continuity lead — reads and sets the BC rating: what happens to core operations if this vendor goes dark.
- Security analyst — works the exposure ranking top-down, putting effort where the data risk is.
- Auditor / examiner — reads the criticality designation, its reason, the exposure that backs it, and the concentration analysis.
Two kinds of “critical” — and why the distinction matters
Talarity keeps two concepts deliberately separate, because conflating them is how programs lose defensibility:
- Risk tier (Critical / High / Medium / Low) is computed — the inherent-risk engine derives it from weighted factors. It’s the tier badge you see throughout the vendor program.
- Flagged critical is a designation — a governance decision a human makes, with a reason, that this vendor is business-critical regardless of what the math says. It carries the ⚑ flag.
A vendor can be high-tier but not business-critical, or business-critical for a reason the risk factors don’t capture. Keeping the two apart means the map never overstates how many vendors you’ve formally designated, and every designation has a name and a rationale behind it.
Step 1 — Read exposure across the portfolio
The Data Mapping matrix (/app/vendor-data-map) is where risk becomes visible. Every cell is a derived exposure score — the data type’s sensitivity, weighted by handling mode, scaled by the vendor’s inherent risk — banded Severe → High → Moderate → Low. The hotspots are the vendors and data types that should own your attention.
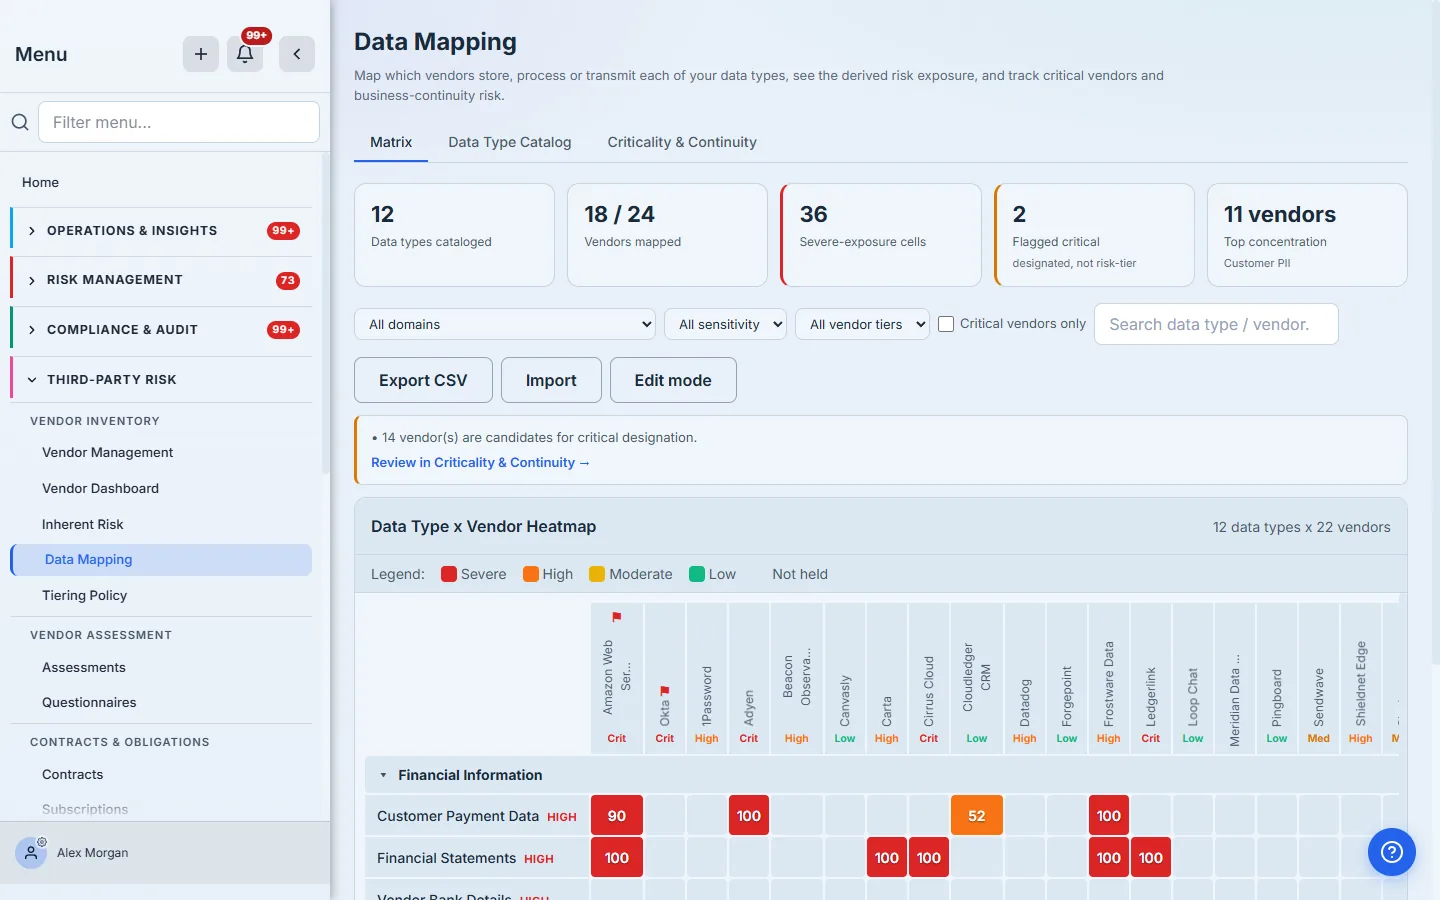
Because the score is derived rather than typed, it re-ranks itself. When a vendor’s inherent risk climbs, every cell in its column recomputes — the map surfaces the new hotspot without anyone re-coloring the grid.
Step 2 — Trace one exposure to its inputs
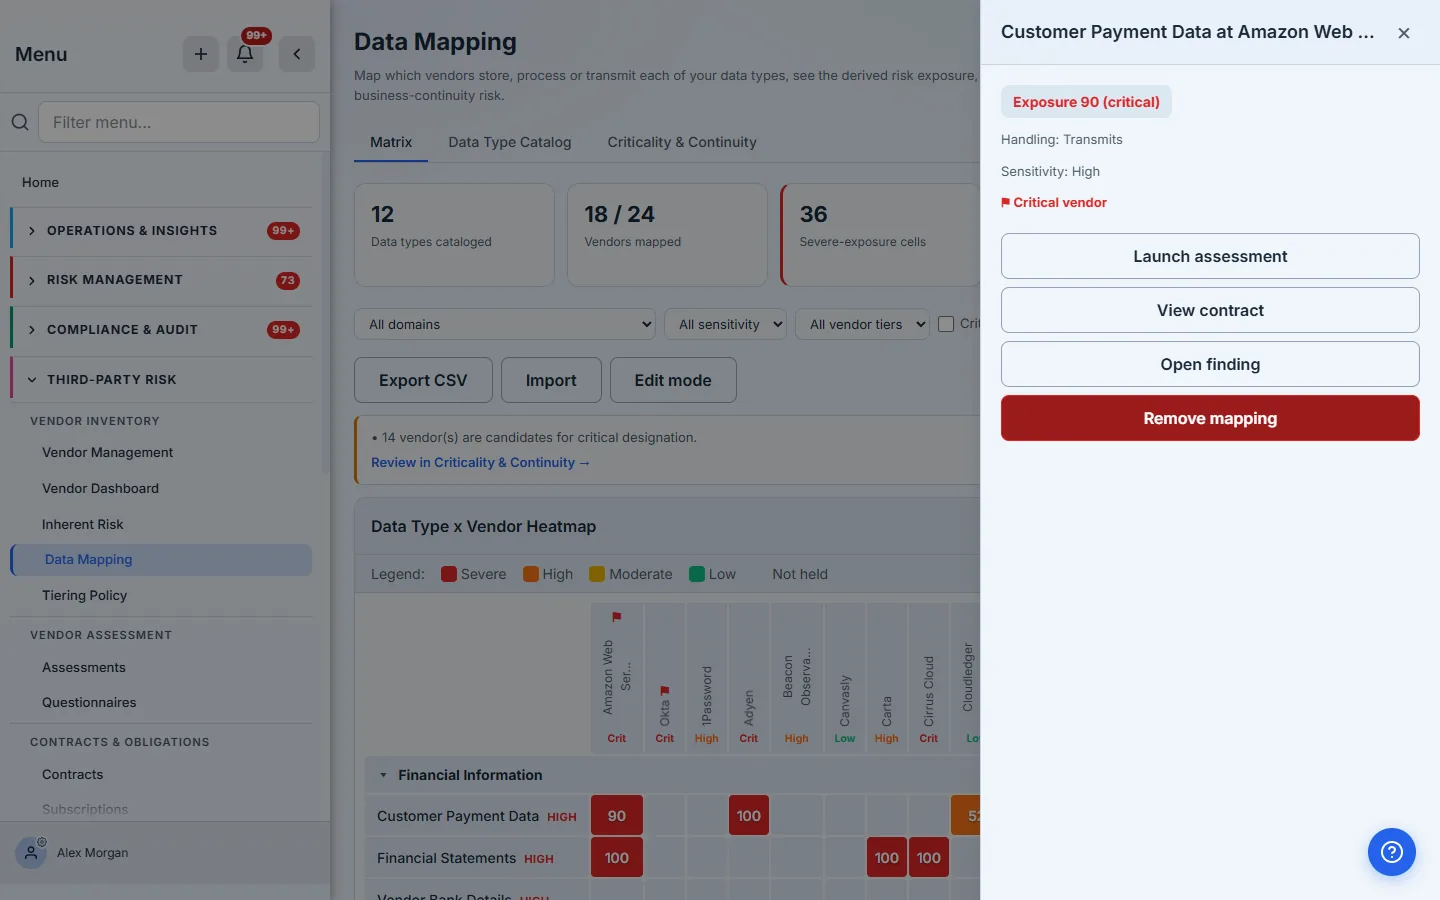
Click a cell and the drawer shows exactly how that number was built: the exposure and its band, the handling mode (stores is weighted heaviest, then processes, then transmits), and the underlying sensitivity. Nothing is a black box — the score decomposes into inputs you set.
Step 3 — See a vendor’s whole exposure profile
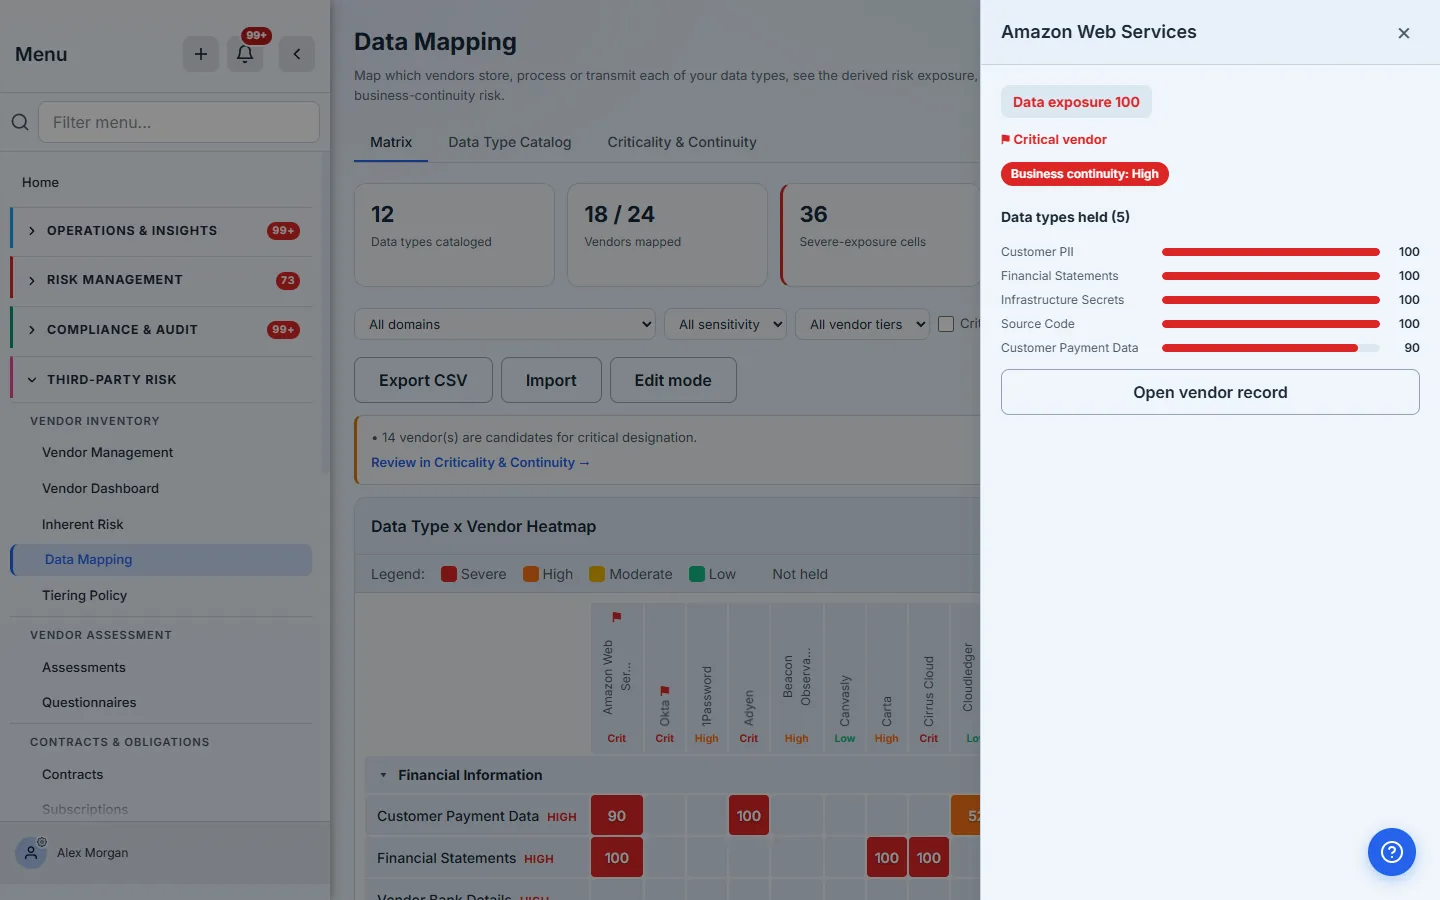
Open a vendor’s column header and the drawer rolls its whole footprint into one view: the vendor-level exposure score (on the same 0–100 scale as the matrix cells, where 100 is the most severe), its flagged-critical status, its business-continuity rating, and every data type it holds ranked by exposure. This is the “how bad is this one vendor” answer in a single panel.
Step 4 — Designate criticality and record continuity risk
The Criticality & Continuity tab is where the governance decisions happen. Each vendor gets a Flagged critical checkbox — designating one is a deliberate act — and a Business-continuity risk rating (High / Medium / Low) that records the impact if the vendor’s failure disrupted core operations. Both save inline, and both feed notifications and the concentration analysis. A search and a “flagged critical only” filter keep the list navigable no matter how many vendors you carry.
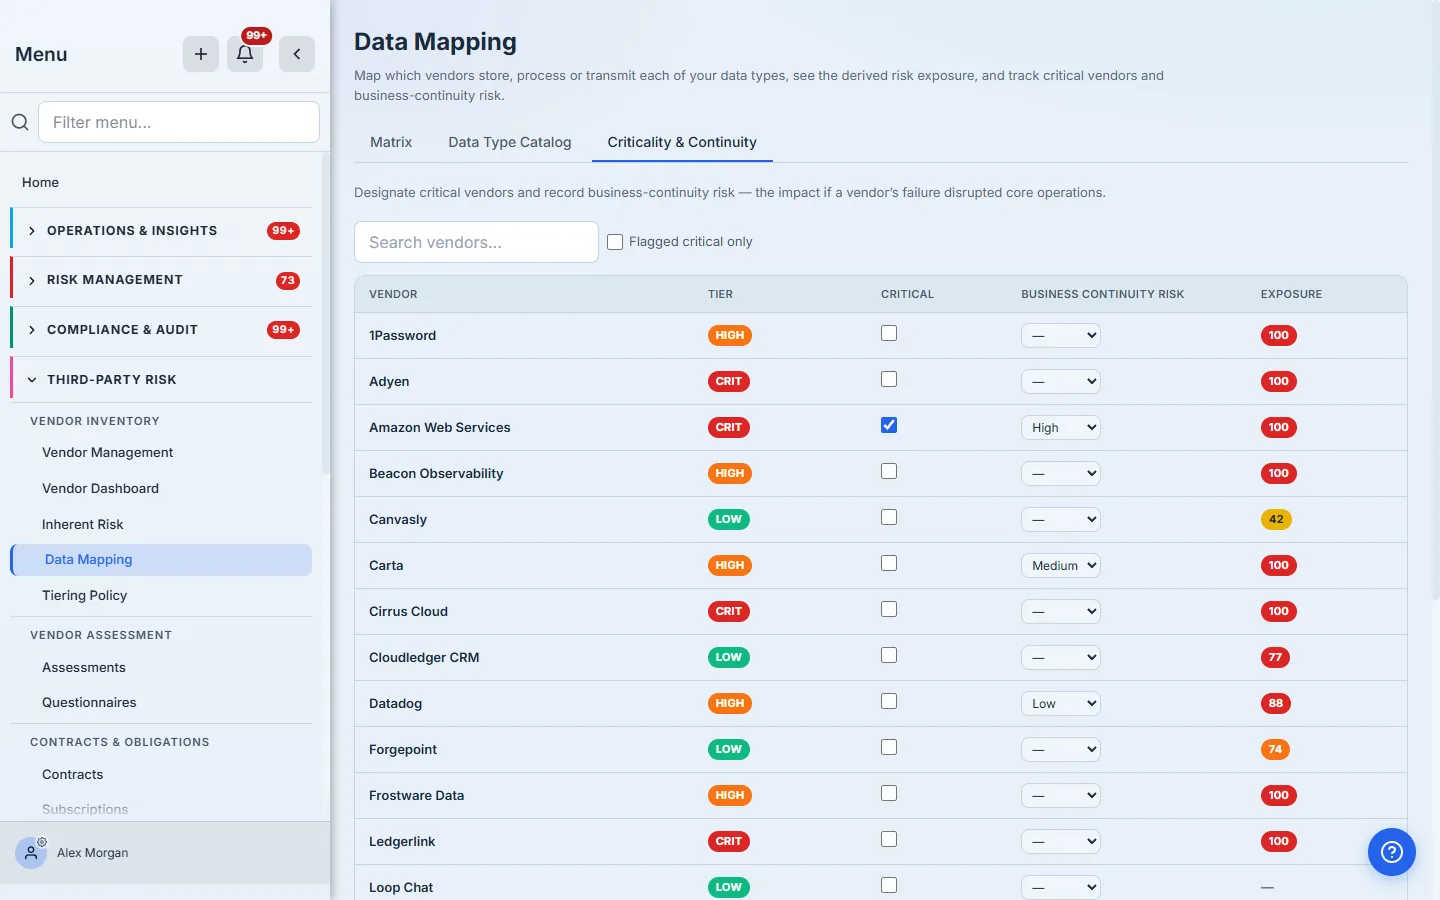
Why continuity is a separate axis: a vendor can hold very little data yet be the single point of failure for a core process — or hold a lot and be trivially replaceable. Exposure measures the data risk; the BC rating measures the operational one. Marking both is what lets you tell a payments processor apart from a stock-photo subscription for real.
Step 5 — Carry the flag everywhere the vendor appears
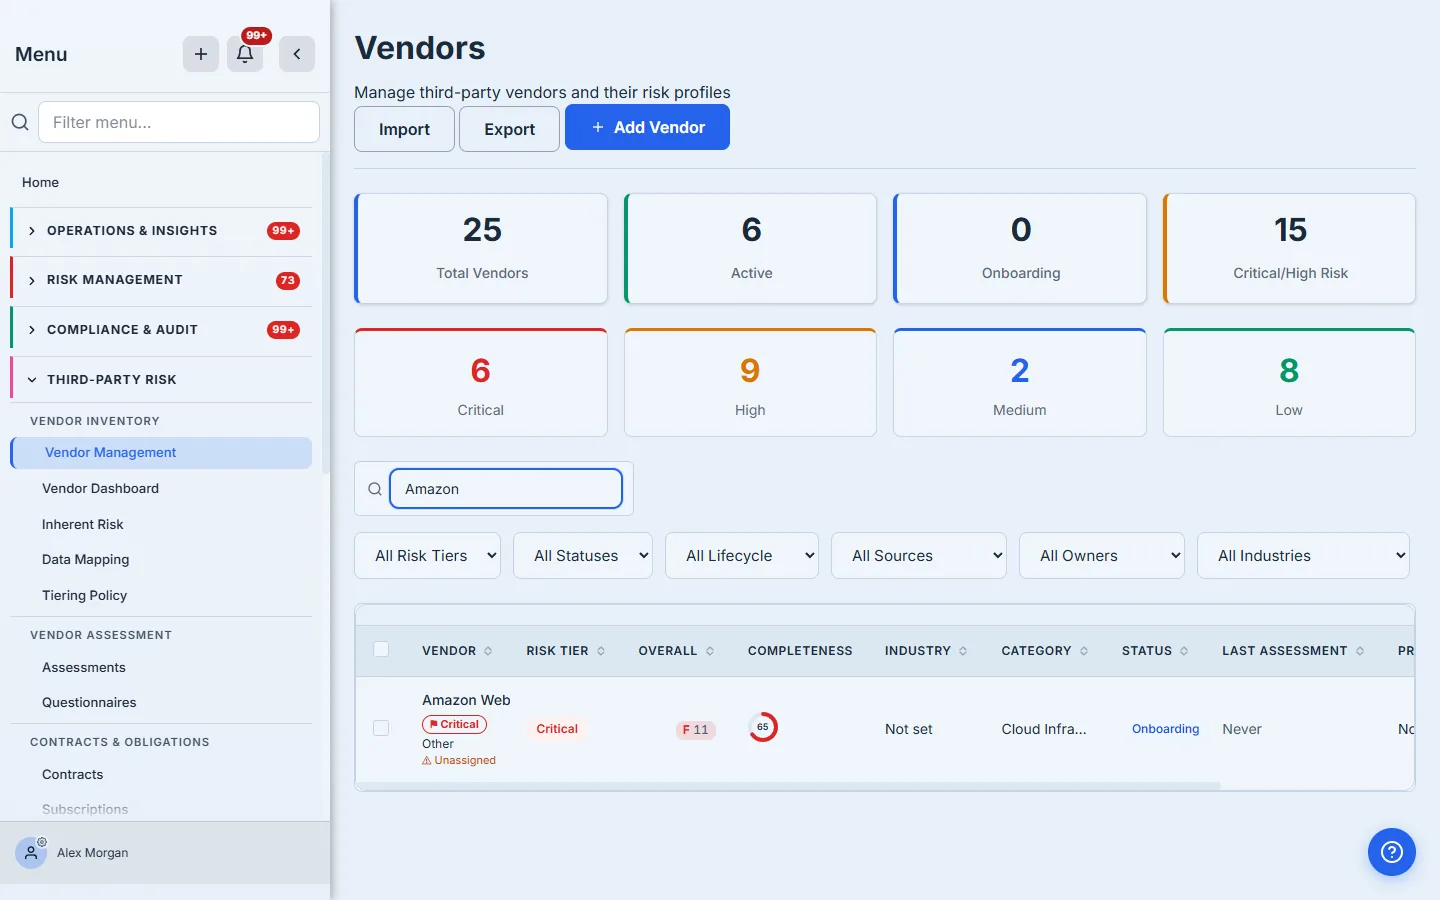
A designation is only useful if it’s visible where decisions get made. Once a vendor is flagged critical, the ⚑ Critical badge follows it — onto the vendor list, the vendor record, and the matrix column — distinct from the computed risk-tier column beside it. The portfolio KPI cards count vendors by tier so you can orient the whole book at a glance.
Step 6 — Land it on the vendor record
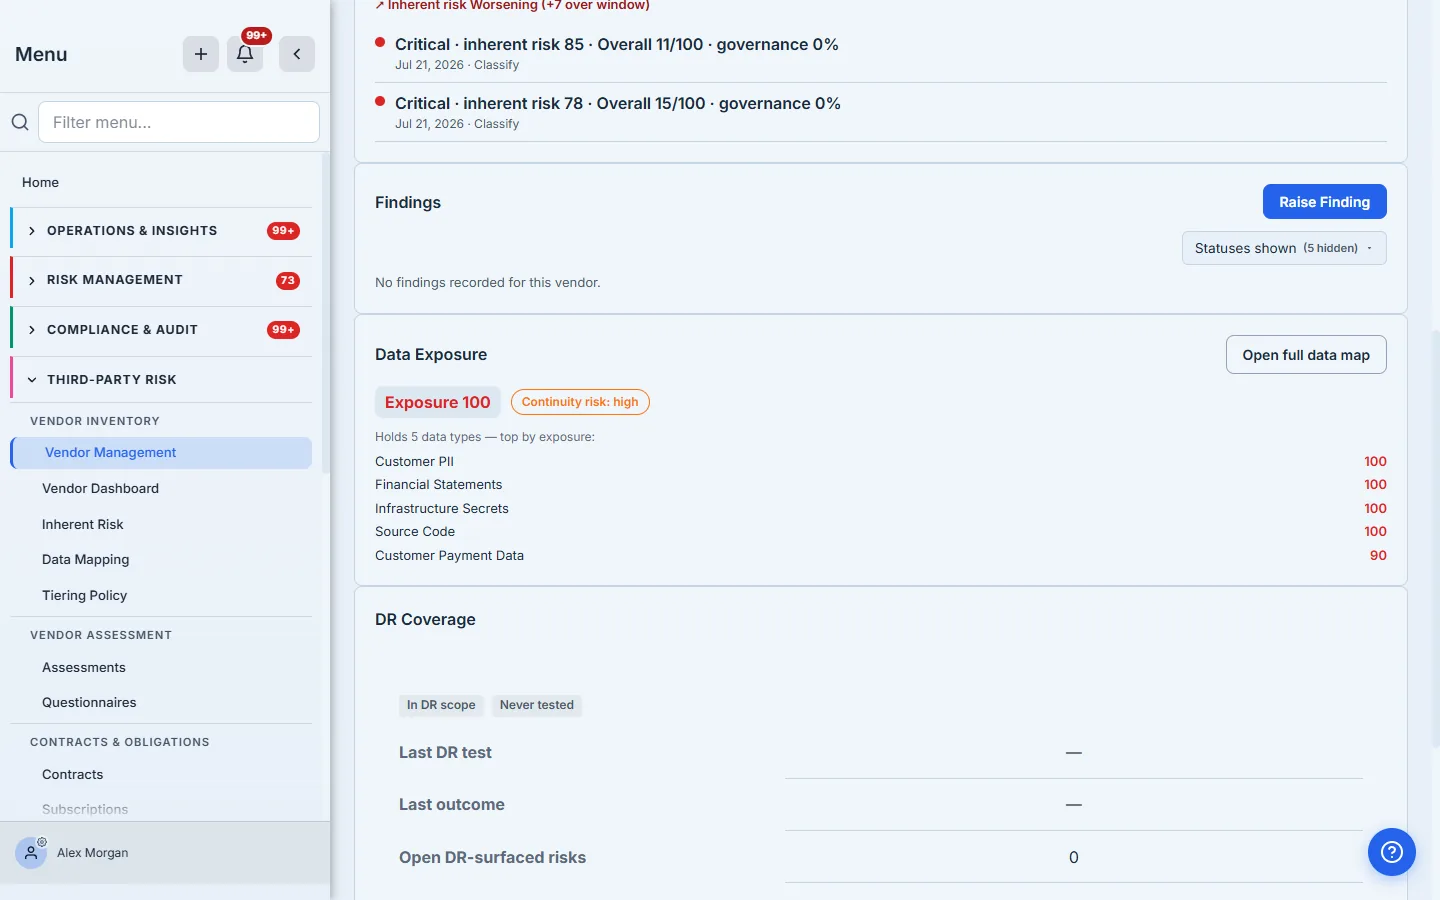
Every vendor’s Risk tab carries a Data Exposure card: the exposure score, the continuity chip, and the top data types the vendor holds — with a link straight to the full map. The reviewer, the incident responder, and the auditor all read the same current risk picture from the record itself.
Step 7 — Watch concentration across the book
The portfolio KPIs on the matrix close the loop back to the regulators’ favorite question. Severe-exposure cells, flagged-critical count, and your single largest data concentration — how many vendors hold your most-concentrated data type — are the concentration signal FFIEC and the Interagency Guidance ask you to manage. It’s the difference between “we have a vendor list” and “we know where our exposure piles up.”

What you walk away with
- A derived exposure score per vendor and per cell that ranks real data risk and re-ranks itself as vendor risk moves.
- A defensible criticality designation — a deliberate governance act with a reason, kept distinct from the computed risk tier, and visible everywhere the vendor appears.
- A business-continuity axis and a concentration view that answer the operational and systemic questions — the ones SOC 2 CC9.2, ISO 27001 A.5.19–22, and the FFIEC concentration guidance actually test.
Start with the Vendor data mapping walkthrough to build the map this article turns into risk — the catalog, the cell-by-cell mapping, and the one-pass import that gets your existing spreadsheet onto the platform.
Related: mapping vendor risk onto your own register is what turns a tier into something the risk committee can act on, and it is where concentration stops being a vendor problem. Overview: vendor risk management.