Every GRC programme reports numbers. Percentage of controls tested. Mean time to remediate. Phishing click rate. They go into board packs and audit responses, and they are treated as facts.
Far fewer programmes can answer the three questions that decide whether a number is a fact: where did it come from, when was it last computed, and who owns it. A number nobody can trace and nobody has recomputed is worse than a missing number, because it still gets reported — and it gets reported with exactly the same confidence as one that was measured this morning.
Metric Catalog is the register that holds those answers. It is deliberately unexciting: a list of metric definitions, each with a category, an owner, a cadence, a lineage and a history of recorded values. Its job is to make an indefensible number visible before somebody defends it.
There is a standards reason as well as a practical one. ISO 27001’s Clause 9.1 — Monitoring, measurement, analysis and evaluation does not simply ask you to measure things. It enumerates what you must determine: what needs to be monitored and measured, the methods used, when the measuring happens, and who does it. That list is, almost field for field, a metric record — the metric, its lineage, its cadence, its owner.
Who’s involved
- The GRC or security lead owns the programme’s numbers: which metrics exist, which are published, and which are trustworthy enough to report.
- A metric owner owns one metric — its cadence, its lineage, and recording its values.
- The auditor never edits anything here, but reads the lineage: a number with a documented derivation is evidence, and a number without one is an assertion.
The dashboard leads with what is broken
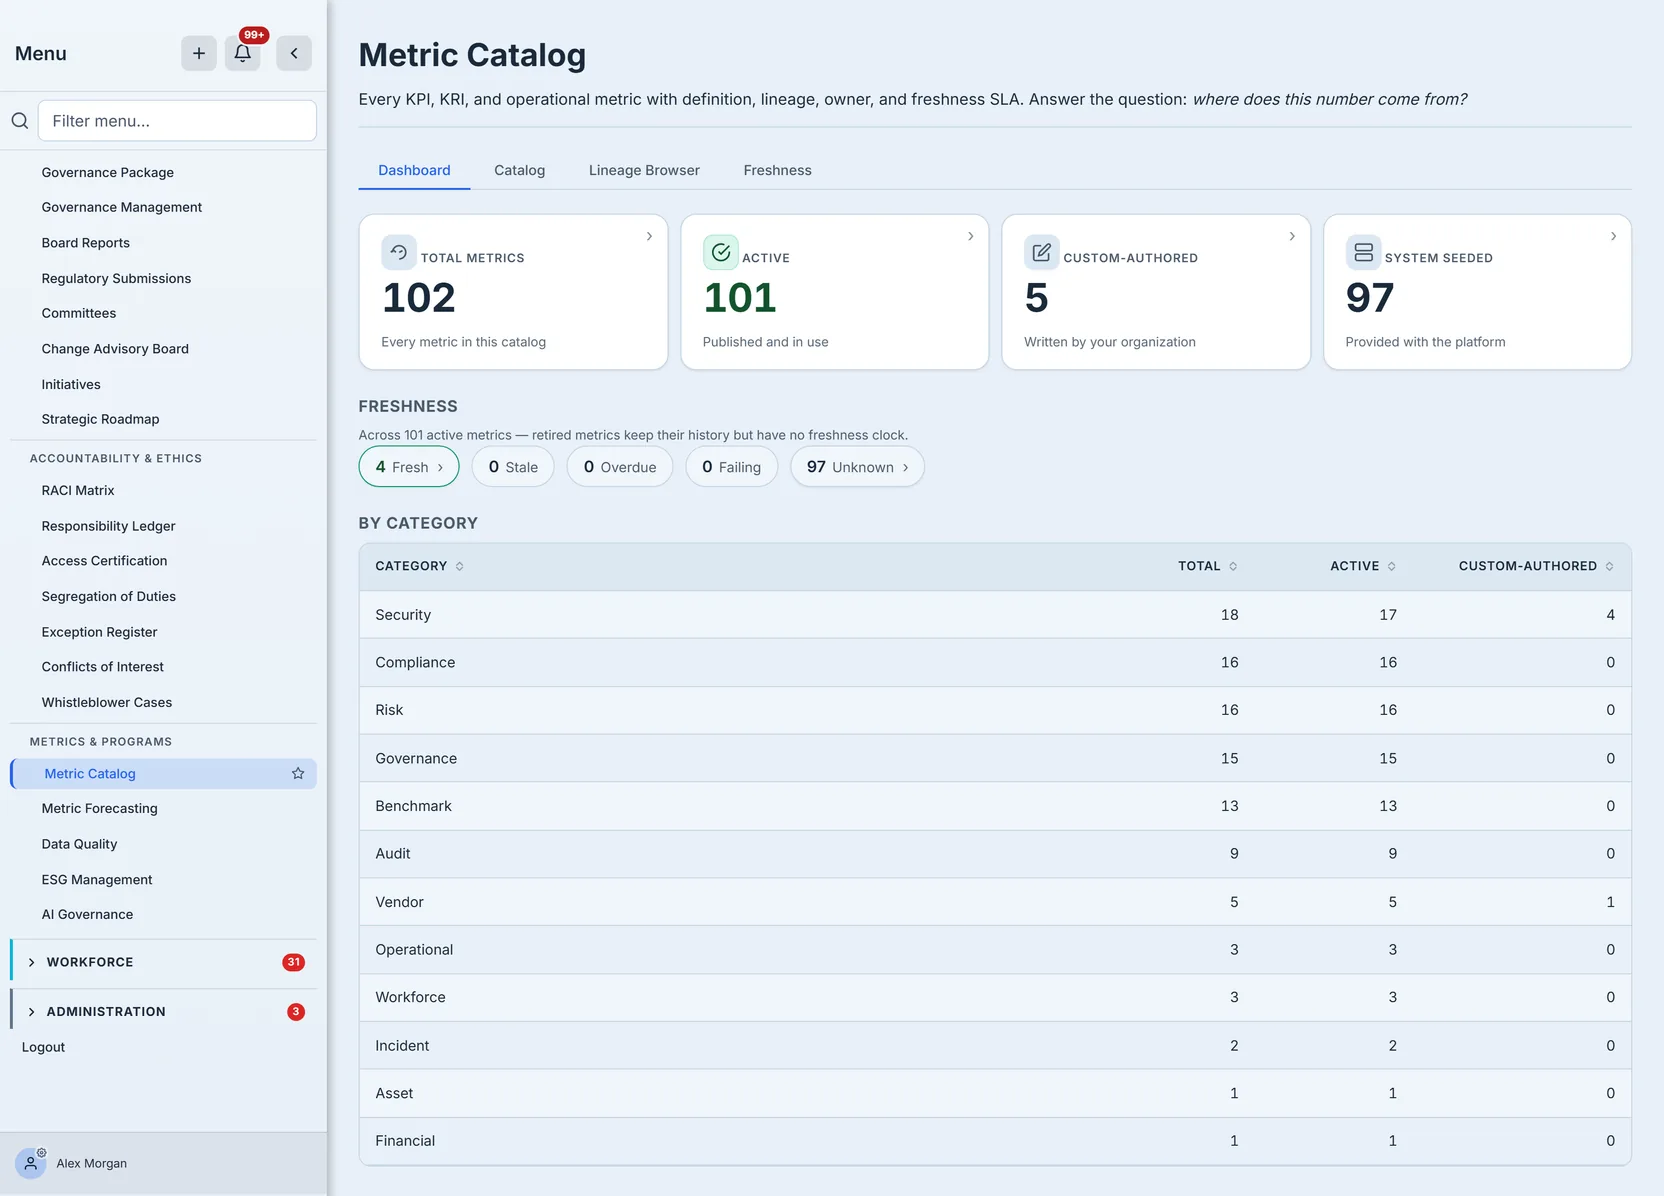
Most catalogs open with a count of how much you have. This one opens with that, then immediately tells you how much of it you cannot rely on.
The four tiles across the top are inventory: Total Metrics, Active, Custom-Authored and System Seeded. The last two are the split between metrics your organisation wrote and metrics the platform seeded for you — a provenance distinction, not a quality judgement. A seeded metric is not worse than an authored one; it simply came from somewhere else. All four open the catalog filtered to the rows they count, so “which of these did we write ourselves?” is a click rather than a reading exercise.
Beneath them, the freshness chips count every metric by state: fresh, stale, overdue, failing, and unknown. Unknown is not a failure mode — it is the state of a metric that has never recorded a value, so it has no clock to have fallen behind. A chip only takes on its alarm colouring when its count is above zero, so a row of zeroes stays quiet.
That distinction matters more than it sounds. The catalog above holds 102 metrics — 97 seeded by the platform and 5 written by the organisation — and exactly 4 of them have ever recorded a value. Four are fresh; ninety-seven are unknown. The honest reading is not “nothing is late”, because almost nothing has a clock at all: it is “four of these are measured, and the rest are definitions waiting for a first value.”
The chips also account for 101 of those 102, and the missing one is not an error: a retired metric has stopped accumulating snapshots, so it has no freshness state to report and drops out of the count while remaining in the inventory. If the two numbers ever disagree by more than your retired metrics, that is worth asking about.
Which is what a real catalog looks like early on, and why unknown deserves its own state rather than being folded into stale. A metric that has never been computed is not behind schedule — it has no schedule yet.

Then Catalog Gaps, which is the section worth reading first. Three tiles, each amber above zero and green at zero:
- No Lineage — active metrics with no lineage steps. Nobody can say how these are derived.
- No Snapshot (30 days) — active metrics with no recent value. These are being reported from memory.
- No Owner — active metrics with nobody accountable for them.
Those three are the honest read on a measurement programme. A catalog of two hundred metrics where all three tiles are green is a programme. A catalog of two hundred where they are not is a list.
Each tile is also a way in, not just a number: click one and the catalog opens filtered to exactly the metrics it counts. That is the difference between being told a hundred metrics have nobody accountable for them and being handed the hundred. The freshness chips work the same way — click 97 Unknown and you land on the Freshness tab already narrowed to those metrics.
Three more sections fill in the shape of the catalog between the chips and the gaps:
- By Category breaks the inventory down by domain — risk, compliance, governance, security and the rest — with the total, the active count and how many your organisation authored. It is the quickest way to see that one domain is carrying the measurement programme while another has nothing.
- Top Stalest ranks the metrics that have fallen furthest behind. It ranks stale, overdue and failing metrics only — so in the catalog above, where the four measured metrics are all fresh and the other ninety-seven active metrics have no clock at all, it has nothing to rank, and says so rather than reporting that everything is within SLA. (Those are opposite conclusions, and only one of them is true.)
- Recently Published lists what has been promoted to active in the last 90 days. On a healthy programme it is never empty for long; a catalog that publishes nothing for a quarter is one nobody is tending.
The catalog
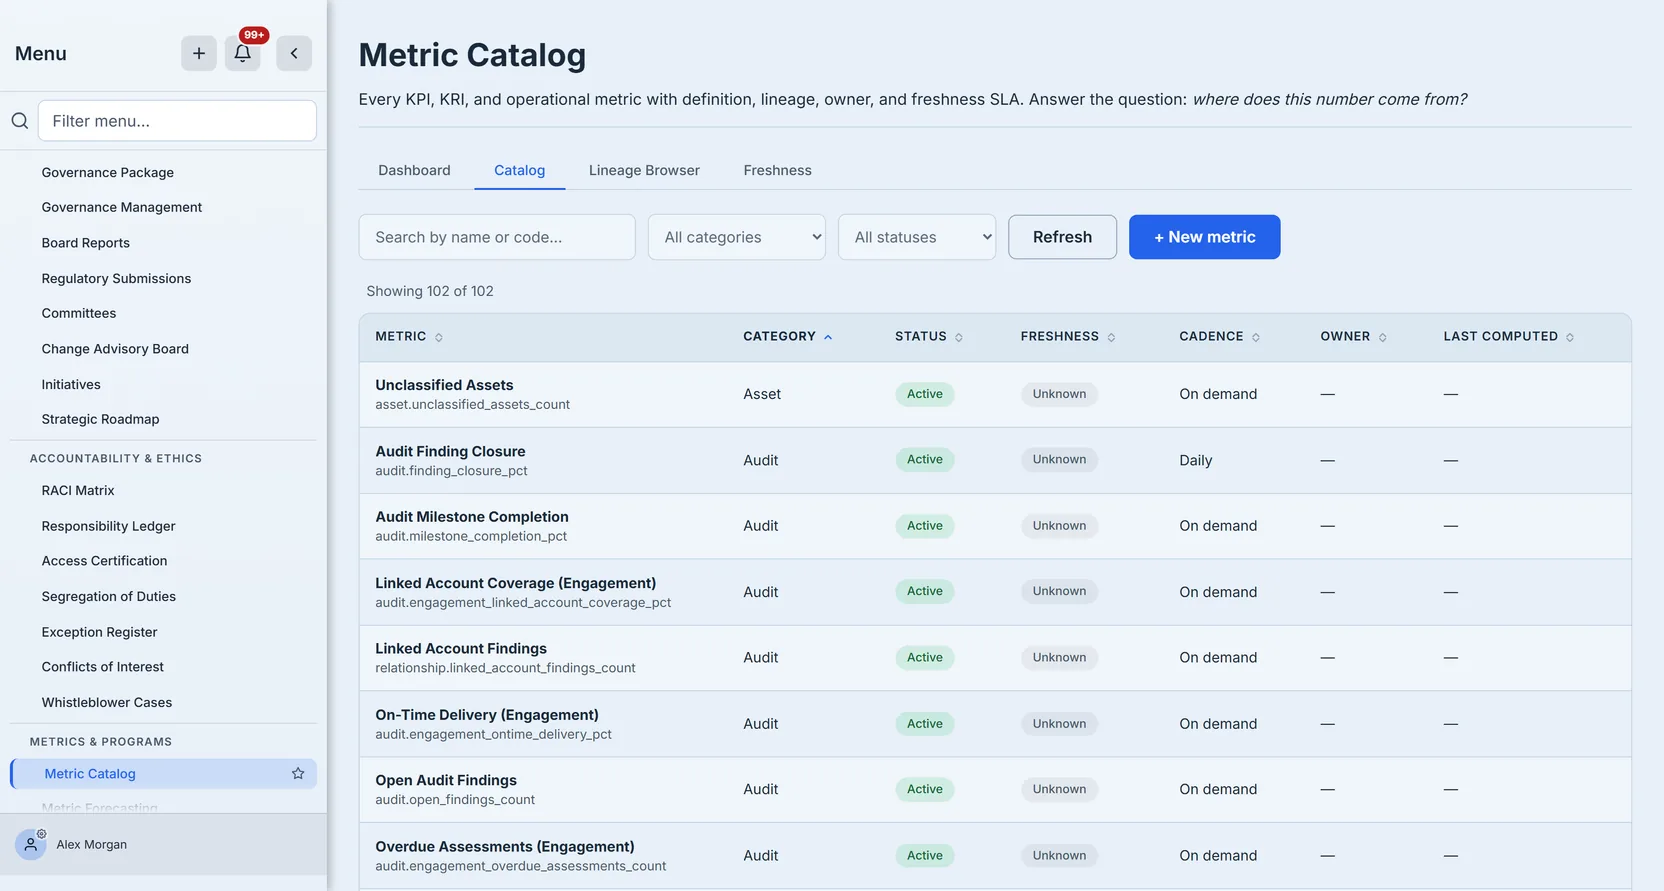
One row per metric definition, with the columns that decide whether you would quote it: Category, Status, Freshness, Cadence, Owner and Last Computed. Freshness and Last Computed are the pair that matter — a metric can be perfectly defined, owned and categorised and still be six months stale.
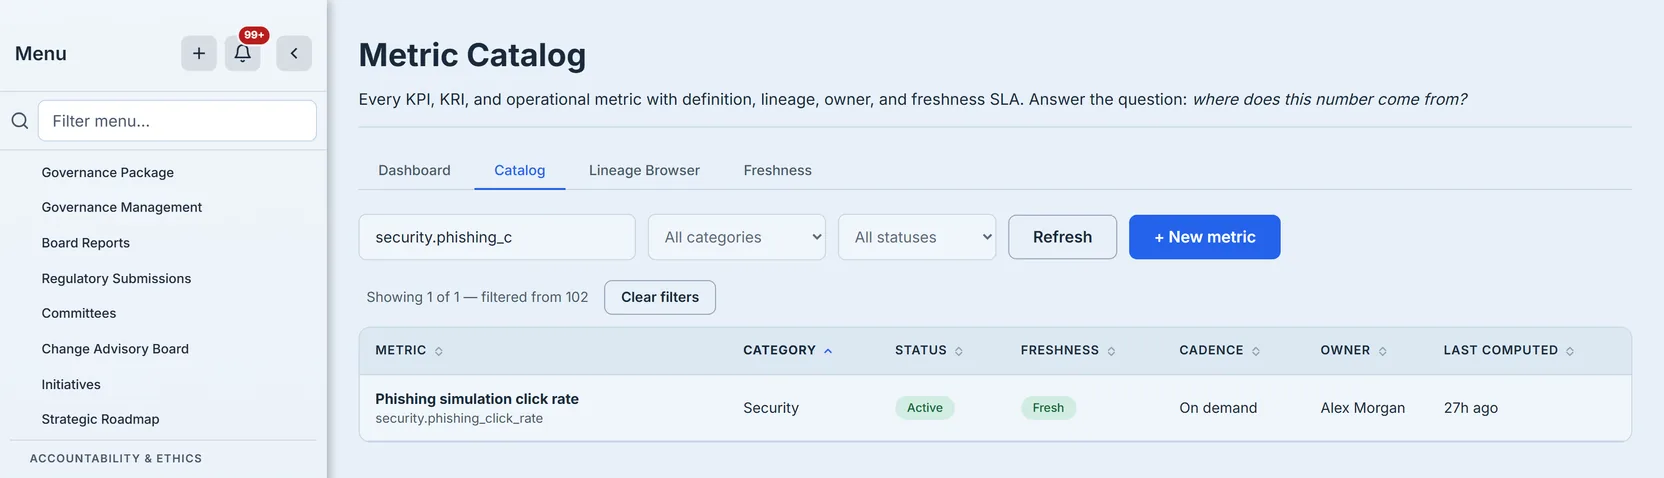
Search narrows by name or code, and the category and status filters stack with it. That second half is easy to miss and worth knowing: searching security.phishing_c — a fragment of the code that appears nowhere in the metric’s name — still finds it. Codes are how dashboards, forecasts and widgets refer to a metric, so being able to search the way the system names things, not only the way people do, is what lets you start from a code in a config file and end at the record that explains it.
Defining a metric
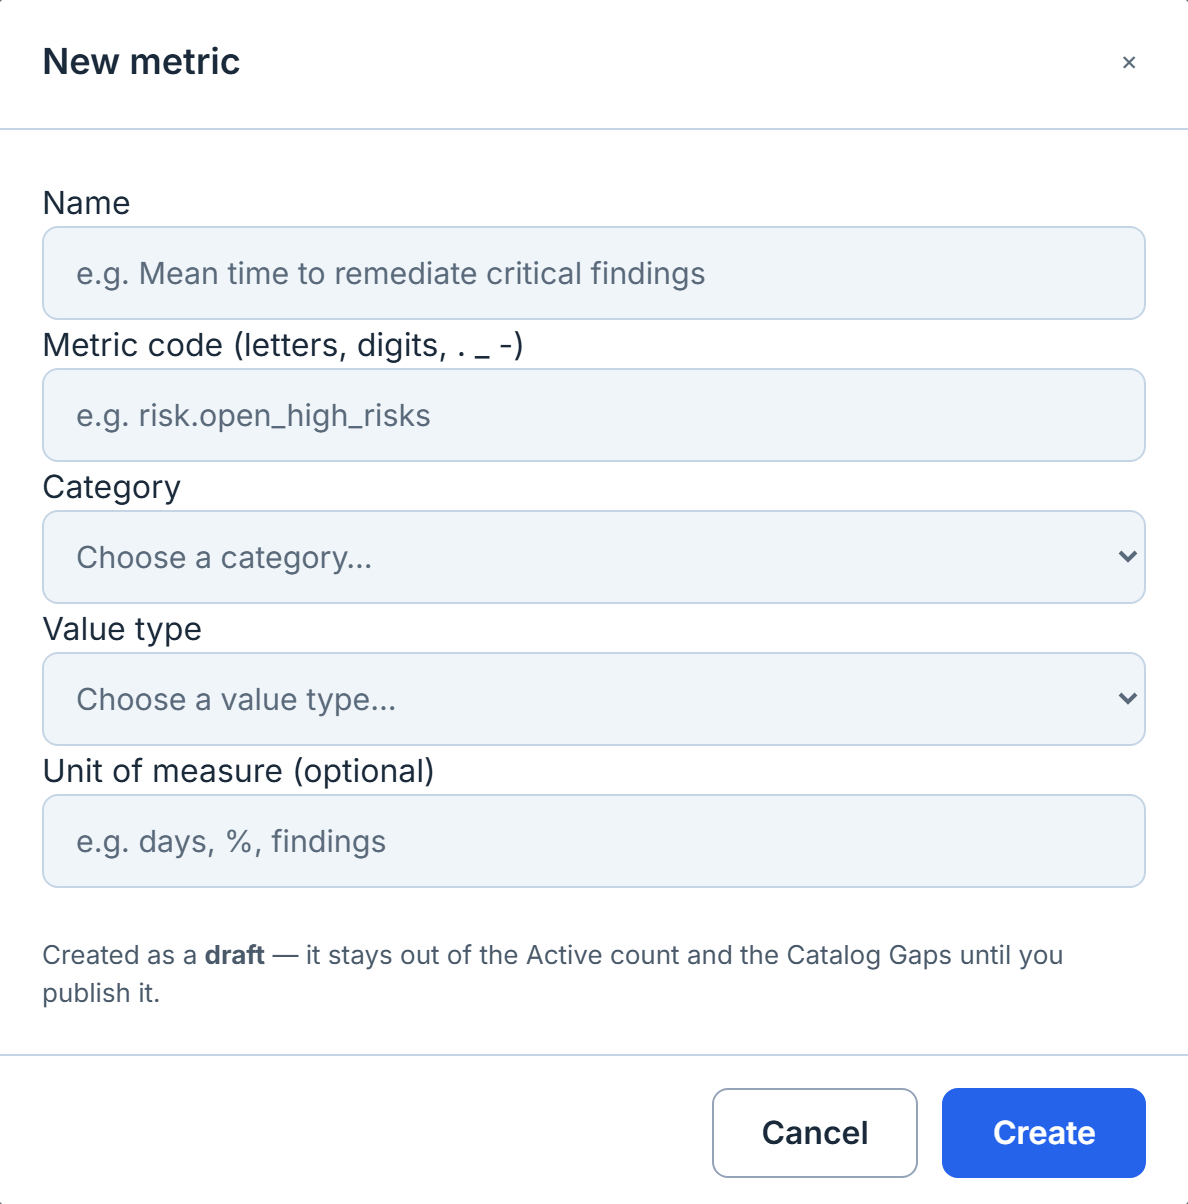
A metric needs a name, a code, a category, a value type and — optionally — a unit. Five fields is deliberately few. The barrier to registering a number your programme already reports should be low; the work that makes it trustworthy comes afterwards, in lineage and snapshots.
The code is the metric’s stable, human-readable handle — unique within your organisation, and the thing everything outside the catalog refers to it by: a deep link to this page resolves a metric by its code, and dashboard widgets reference it the same way. Give it a namespace, as the seeded metrics do (risk., audit., relationship.), and a reader can tell which programme a number came from before reading its name. The namespace is a grouping convention, not a second copy of the Category field — relationship.linked_account_findings_count is categorised under Audit, because the programme a metric comes from and the discipline it reports into are not always the same thing.
Its history is safe regardless: lineage steps and snapshots are bound to the metric record itself, not to any text you can edit, so renaming a metric never orphans what it has already recorded.
Value type and unit answer different questions, and it is worth keeping them straight. The unit is what the number is expressed in; the value type is what kind of quantity it is. A mean time to remediate carries a unit of days and a value type of Duration (days) — not Count, which would say the metric counts days rather than measuring elapsed time in them.
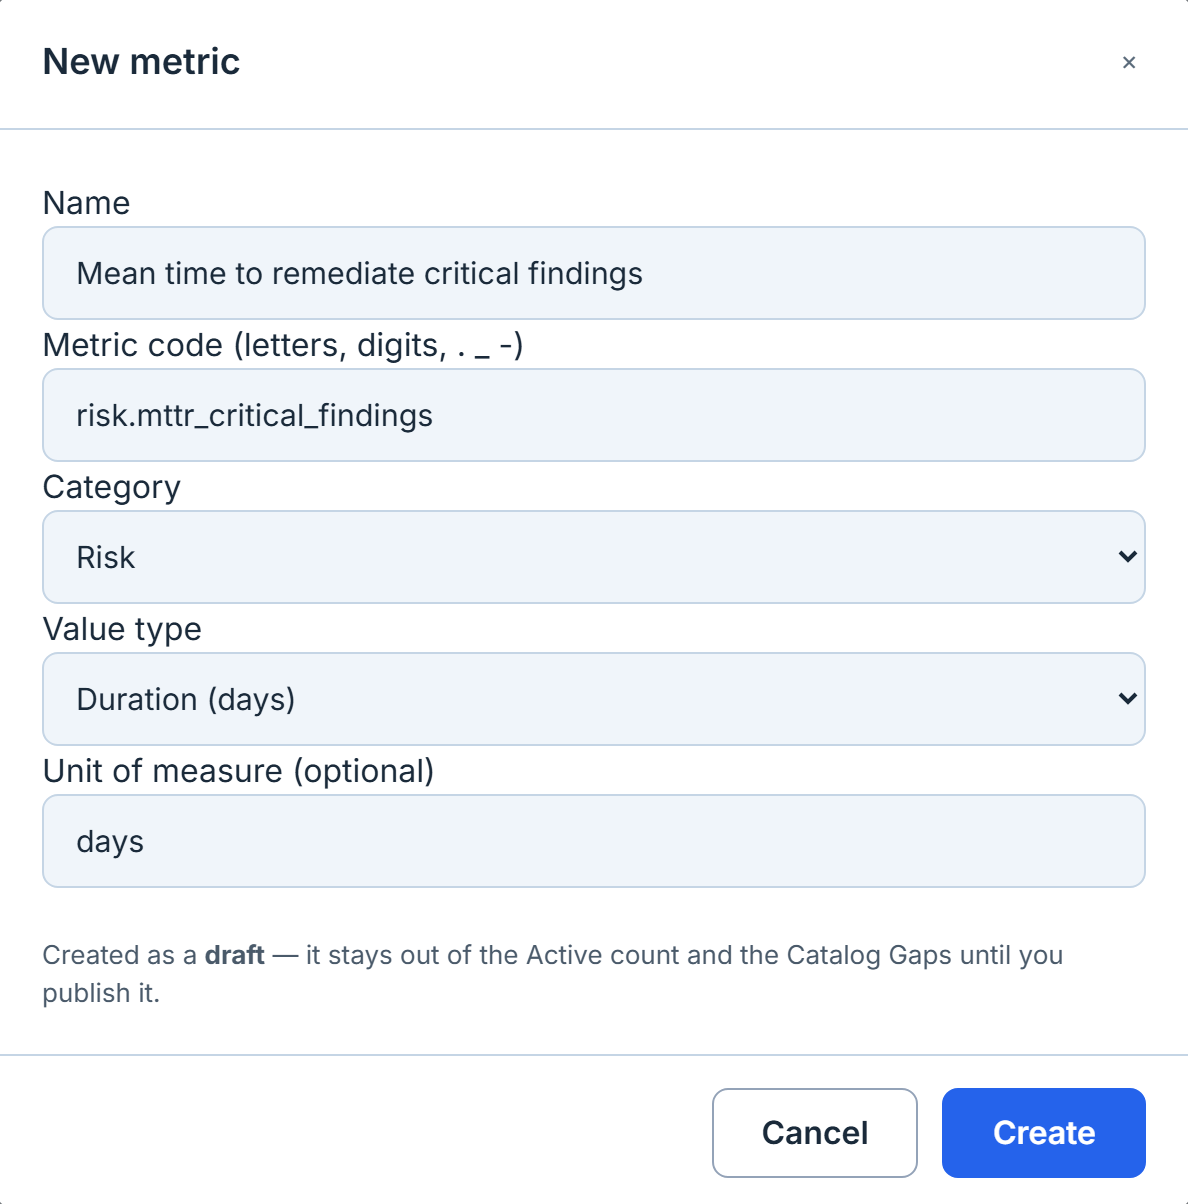
New metrics land in draft. That matters: a draft metric is not counted as Active and does not appear in the gaps tiles, so writing a definition does not immediately make your catalog look worse. Publishing is the deliberate step that says this number is now part of the programme.
The metric record, and its lifecycle
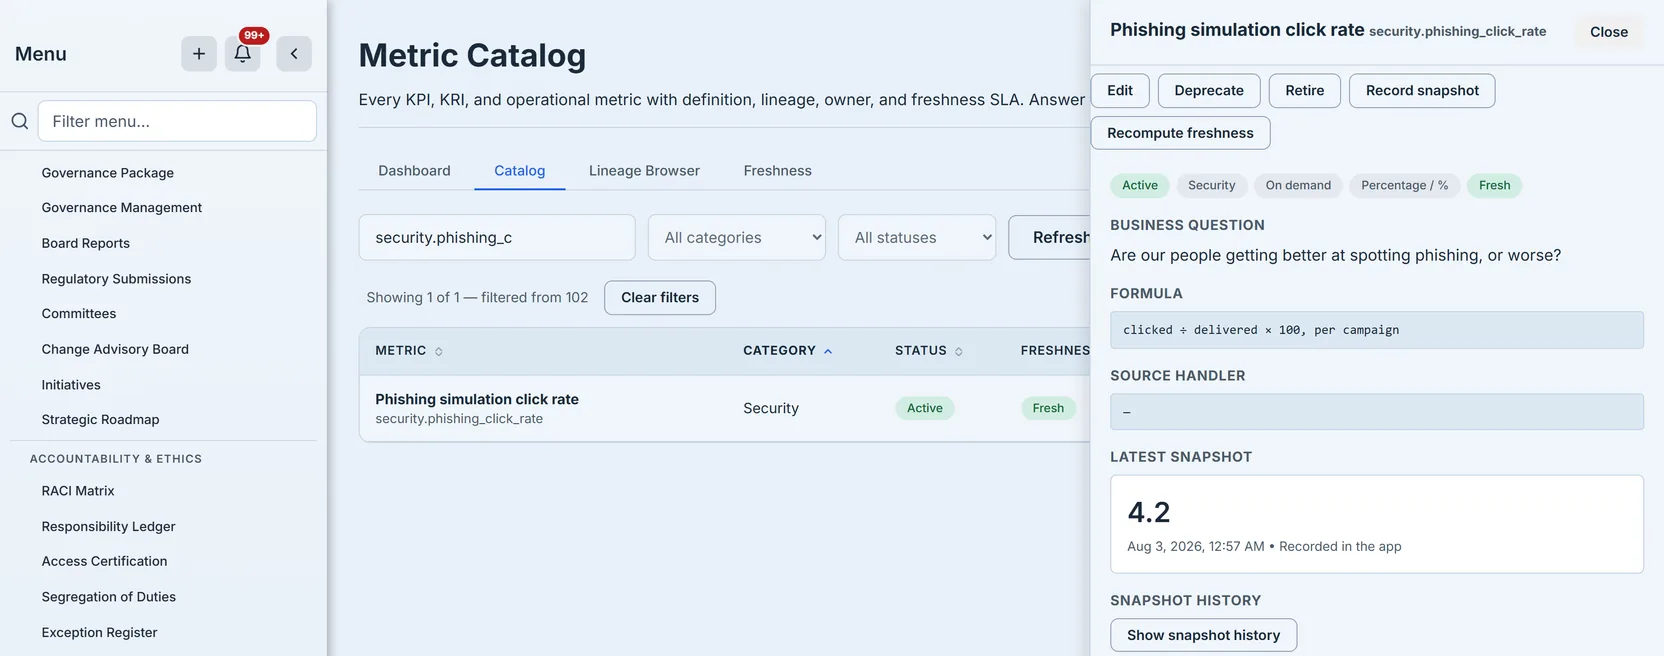
Opening a metric gives you the whole record in one panel.
Business question is the field most catalogs omit and the one that earns its place. “Are our people getting better at spotting phishing, or worse?” is what the number is for. A metric that cannot state its question is a number in search of a reason to exist.
Formula states the derivation in plain terms — clicked ÷ delivered × 100, per campaign. Source handler is the machine-readable counterpart: the identifier of the code that computes the metric automatically, where such code exists. A metric you record by hand has no source handler, and an em dash there is the correct, honest answer rather than a missing value — it is how you tell an automated metric from a manual one at a glance.
Latest snapshot shows the current value with when it was recorded and how. Below it, Show snapshot history opens the series behind that number, and the lineage steps are listed in order.
The action row names only the transitions actually available from the current state. A draft offers Publish; publishing moves the metric to active, that button disappears, and Deprecate and Retire take its place. You are never looking at a row of greyed-out actions working out which one applies.
Deprecate is the interesting one, because it takes a successor. Replacing a metric without orphaning its history is the normal case — a definition improves, the old series still has to mean something — and superseding is how you do it. Retire stops a metric accumulating snapshots and hides it from the default filters while preserving everything already recorded.
Notice what is not on that row: there is no delete. A metric definition cannot be removed once it exists — the terminal state is Retire, and retiring preserves every snapshot and lineage step already recorded. That is a deliberate constraint rather than a missing feature. A deleted metric would take with it the evidence that you were ever measuring, and “we used to track that” is exactly the claim an auditor cannot verify. Deprecate-with-successor keeps the trail; retire closes it; nothing erases it.
(Individual lineage steps can be deleted — that is editing a description of how a number is derived, not destroying the number’s history.)
Snapshots: starting the clock
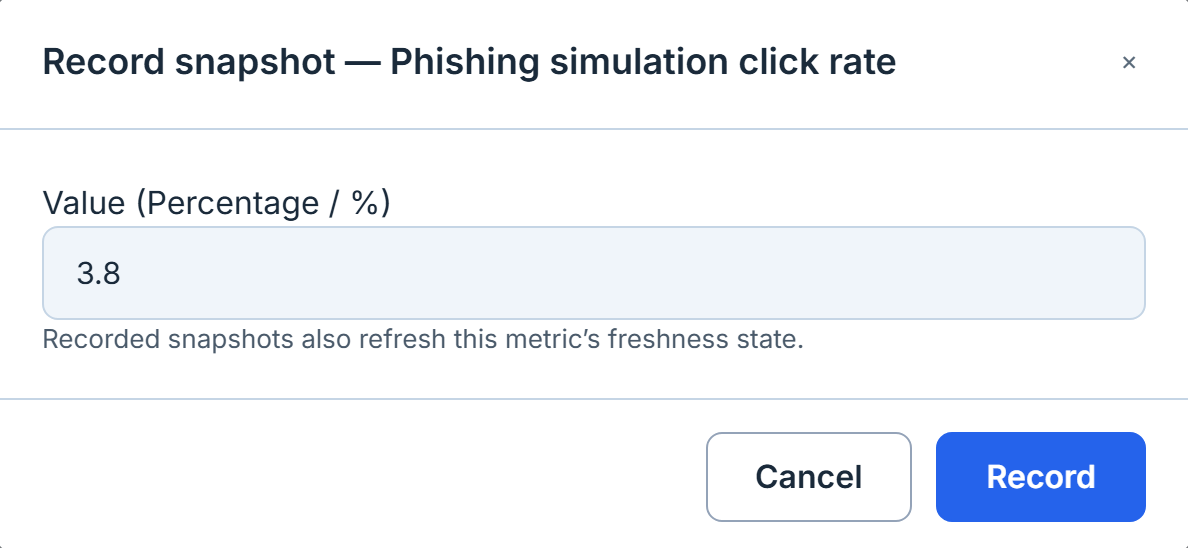
Recording a snapshot is what turns a definition into a measurement. Until the first value lands, a metric sits in unknown — it has no freshness state, because there is no clock running. Recording a value also refreshes that state, which is why the modal says so rather than leaving you to wonder whether a second step is required.
This is also where the value type you chose earlier starts doing work. A metric typed as a count, percentage, ratio, currency, duration or score gets a numeric field — labelled with its own unit, so you are told what you are entering. A metric typed Boolean or Categorical gets a free-text field instead, because “amber” is not a number. Choose the type carelessly and this is the modal that makes you regret it.
Lineage: where the number comes from
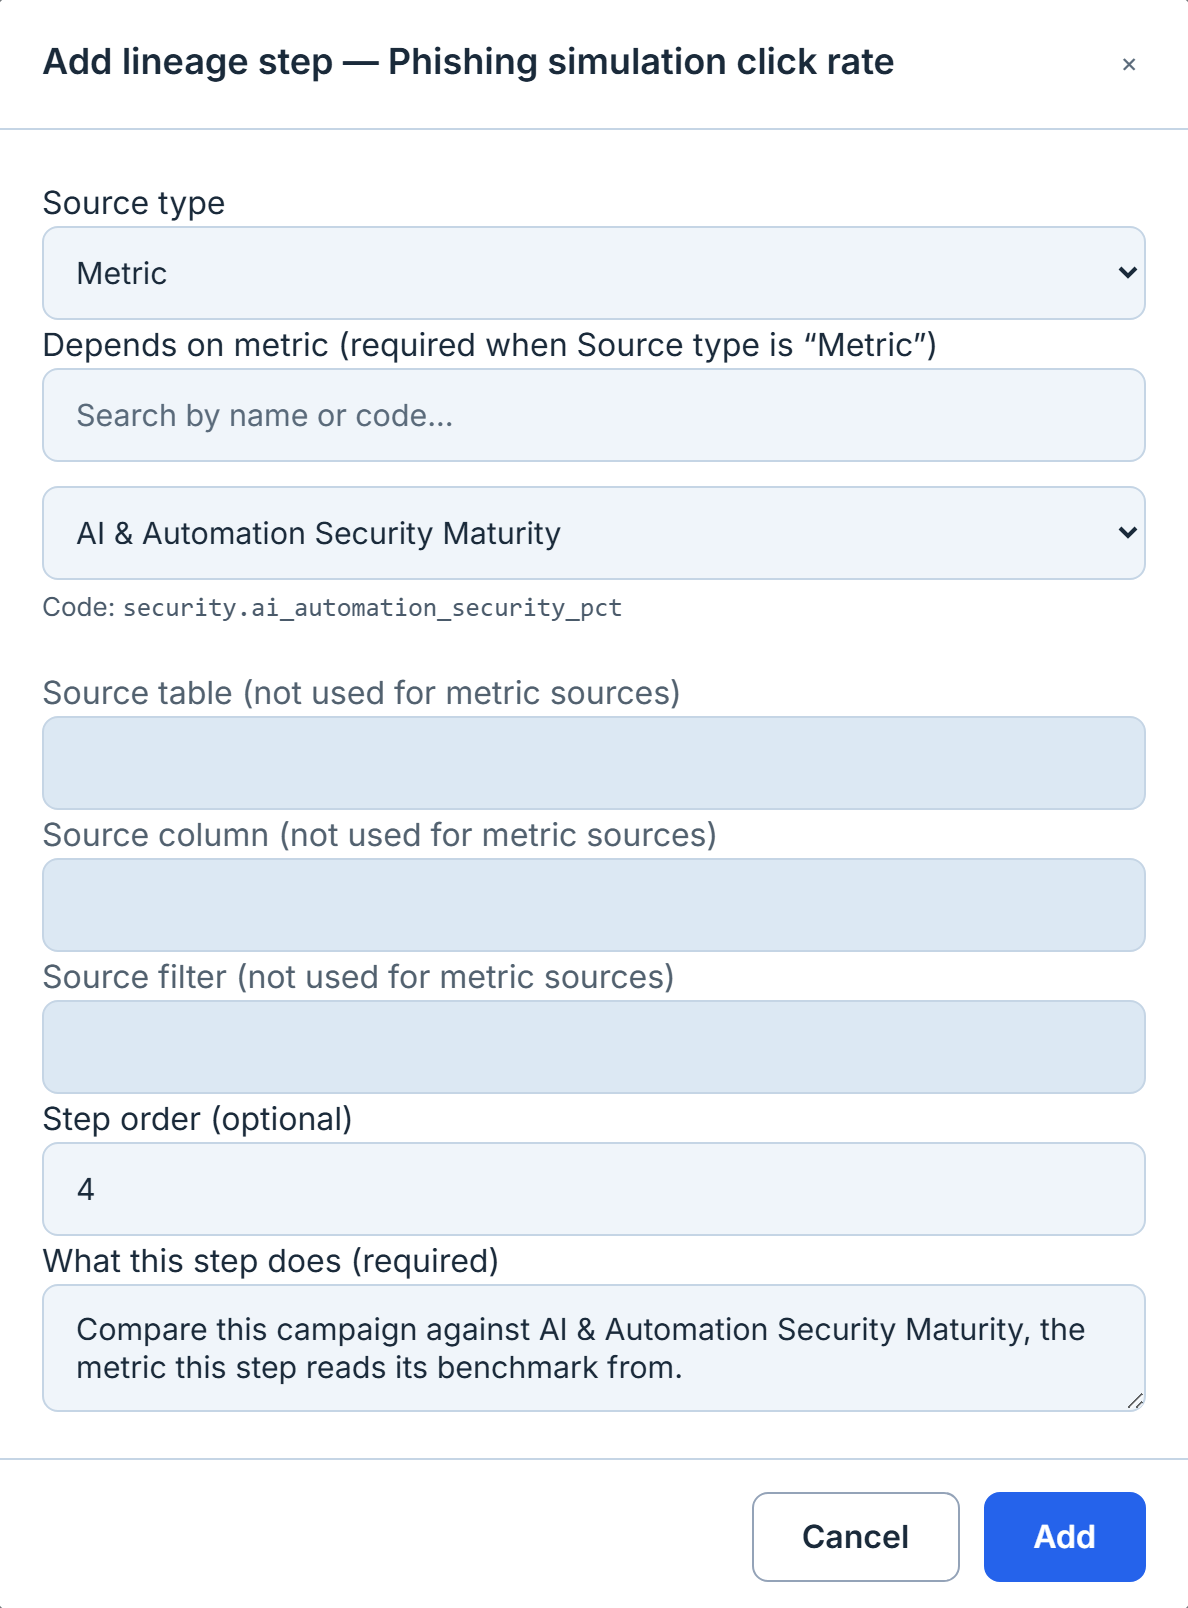
A lineage step records one stage of a metric’s derivation: a source type, either the table and column it reads or the metric it depends on, an order, and a required description of what the step does.
The form enforces the rule rather than trusting it, and so does the backend behind it. If the source type is metric, you must name the metric it depends on. If it is anything else, you must not — a dependency on a source that is not a metric is a contradiction, and it is refused rather than stored as something incoherent. A metric also cannot be its own dependency: naming itself is rejected outright, on both the add and the edit path.
The exclusivity runs in both directions, which is what the screenshot above is showing. With Metric selected as the source, the table, column and filter fields grey out and each one’s label says so — not used for metric sources — rather than leaving three live-looking boxes beside a rule that forbids them. It is the same rule the backend applies: a step naming both an upstream metric and a database column would be claiming two different origins for one number, in the one feature whose entire purpose is telling an auditor where a number came from.
Steps can be edited and deleted afterwards, and that is a deliberate difference from the metric itself. A metric definition is permanent — the terminal state is Retire, and nothing erases it, because the record that you were measuring is itself evidence. A lineage step is documentation about that record: if somebody wrote down the wrong table, or the derivation changed, the honest thing is to correct it rather than leave a wrong chain standing beside a right one. Deleting a step removes a claim about where a number comes from; it never touches a value the metric has recorded.
The description is mandatory in every case, and that is the field that does the real work. “Count the campaign recipients who clicked the simulated phishing link” is a sentence an auditor can read. A lineage step nobody can read is not provenance.
Worth being precise about what lineage is, because the word suggests more automation than it claims: these steps are the derivation somebody has documented, not a pipeline the platform executes. A metric whose value is recorded by hand still shows “Recorded in the app” against that value, and a metric computed by code names the code in Source handler. Lineage tells a reader how the number is supposed to be produced; the snapshot tells them where this particular number actually came from. Both matter, and conflating them is how a documented chain gets mistaken for a running one.
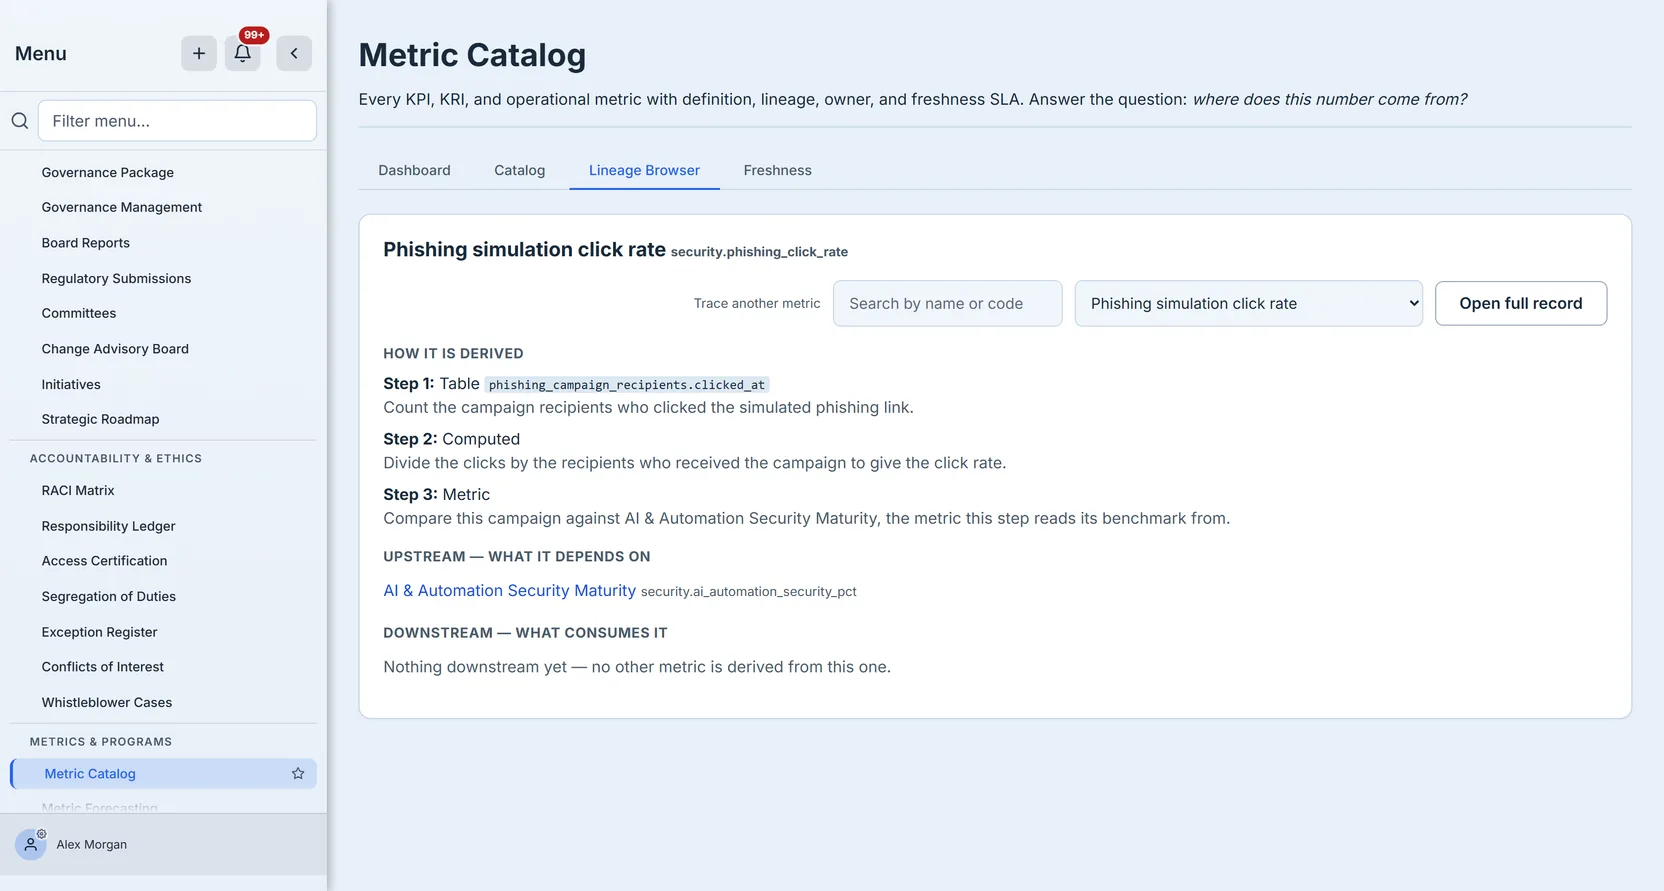
The Lineage Browser tab is the same picture without the rest of the record around it: how the metric is derived, what it depends on, and what consumes it. Direct dependencies sit flush; anything further away is indented and labelled with how many steps out it is, so a long chain shows its shape rather than reading as a flat list. Every node is a link, so you can walk the chain metric by metric instead of reading a diagram somebody drew once and never updated. Open a metric anywhere in the catalog and this tab follows it.
Trace another metric switches the tab to any other metric without going back to the catalog, and it searches the same way the catalog does — by name or code. That second half matters more than it sounds on a catalog of any size: a dropdown of every metric in the organisation is a list you scroll, and the thing you usually have in hand is the code from a dashboard tile or a config file, not the name somebody typed. Searching by code is what turns “I have this identifier” into “here is the record that explains it”.
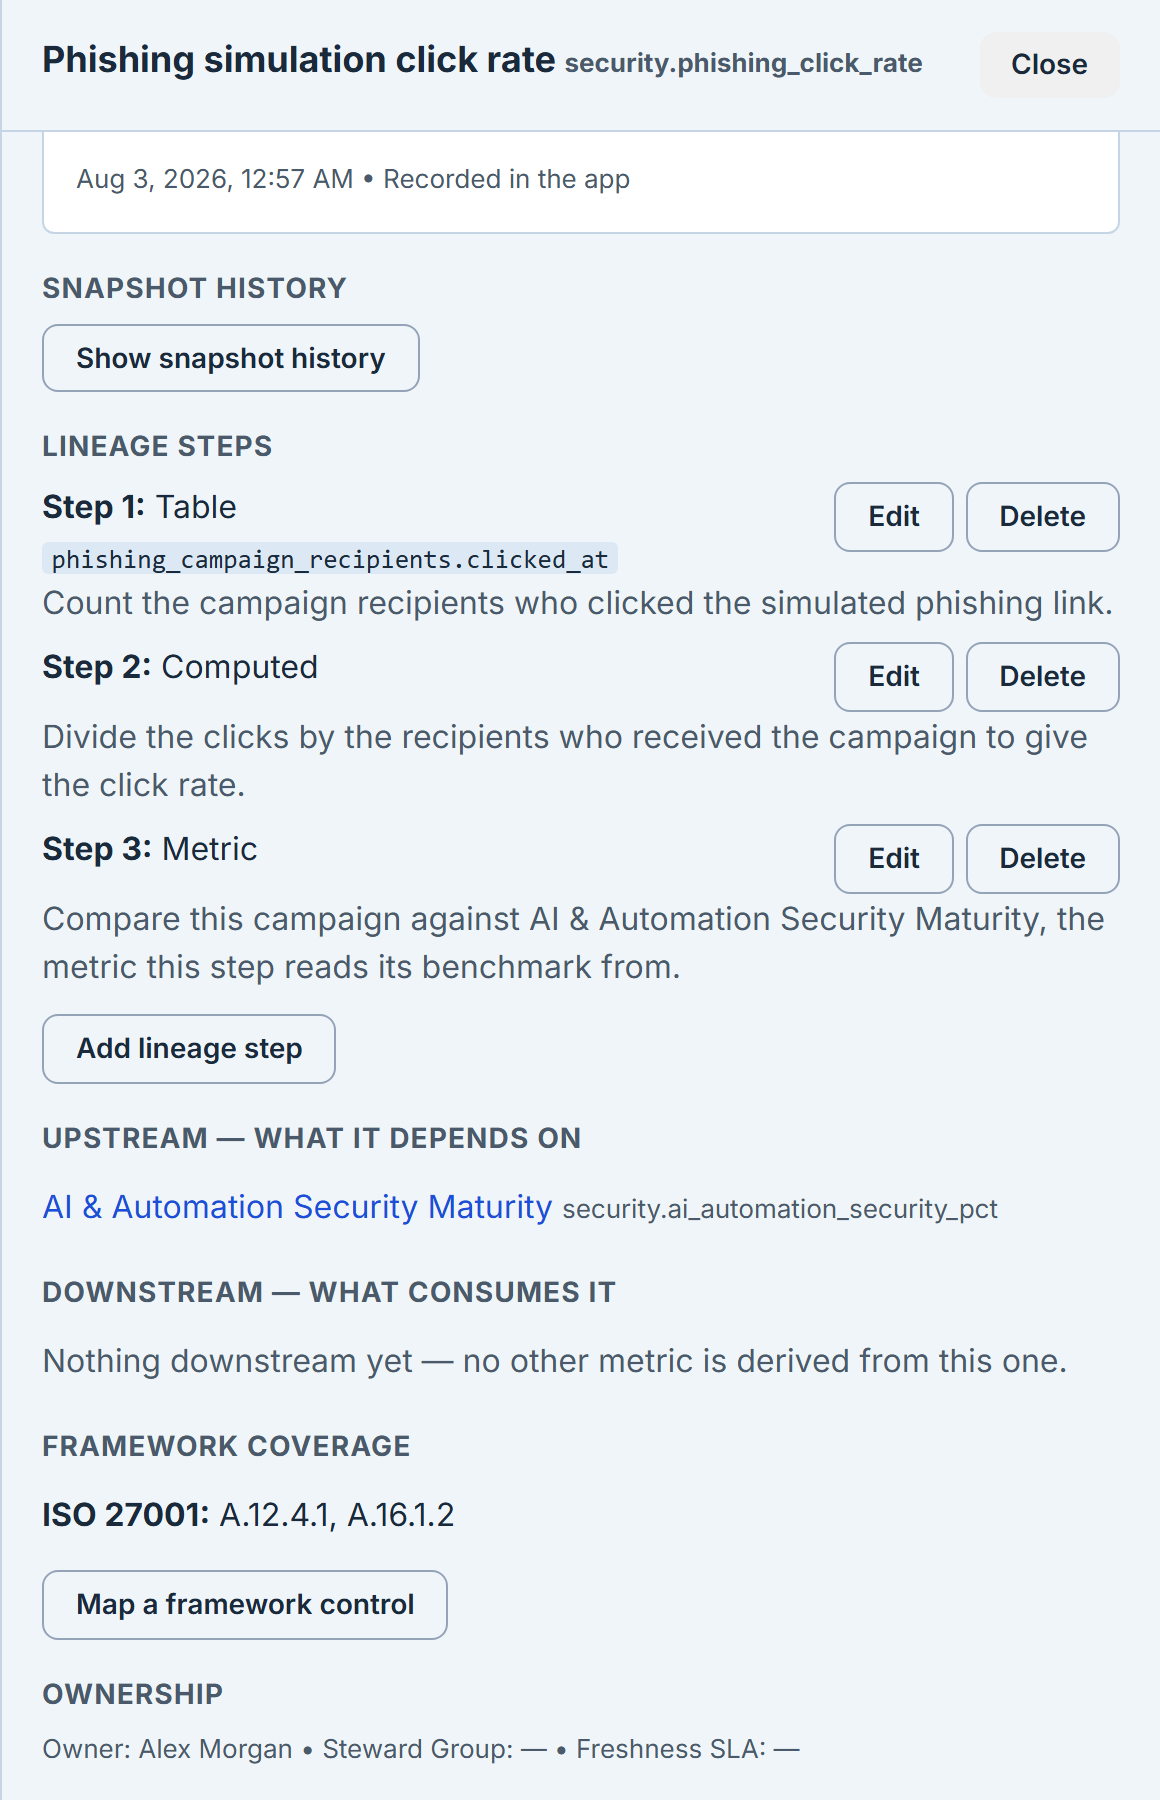
Below the steps, the panel resolves the metric’s place in the wider graph: Upstream (depends on) and Downstream (consumed by), each entry indented by its distance and labelled with the metric’s code, with anything beyond a direct dependency marked by how many steps away it sits. Both are links — click one and that metric opens, so you can walk a derivation chain rather than reconstruct it from notes. When there is nothing to show, the lists say what the absence means — “Nothing downstream yet — no other metric is derived from this one” — rather than rendering empty or leaving you to guess whether the lookup failed.
That is the question an auditor actually asks next. Not “how is this number derived” — the steps answer that — but “what else moves if this number is wrong”. Downstream answers it directly.
Ownership closes the panel with the three facts that decide whether the metric is maintained: its owner, the steward group responsible for it, and its freshness SLA — how long after the last computation the metric is allowed to age before it flips from fresh to stale. Leave the SLA empty and the metric never goes stale by the clock, which is the right answer for an on-demand metric and the wrong one for anything you expect to be refreshed on a cadence.
Framework Coverage sits alongside, and it is the reason this page belongs in a compliance conversation rather than an engineering one. Use Map a framework control to record which controls a metric evidences — a phishing click rate speaks to ISO 27001 A.12.4.1 and A.16.1.2, event logging and the reporting of security events — and a mapping may also carry an evidence strength qualifier, drawn from the same vocabulary the platform uses for every other kind of evidence: authoritative, corroborating, preliminary, insufficient, rejected.
That qualifier is deliberately optional, and worth leaving empty until somebody has actually judged the mapping. An unassessed mapping displays no qualifier at all rather than defaulting to a comfortable one, because a strength nobody assigned is an assessment nobody made — and an auditor reading it would have no way to tell the difference. When it is set, it is what stops a single figure being over-claimed across a dozen controls it only partly speaks to.
Freshness
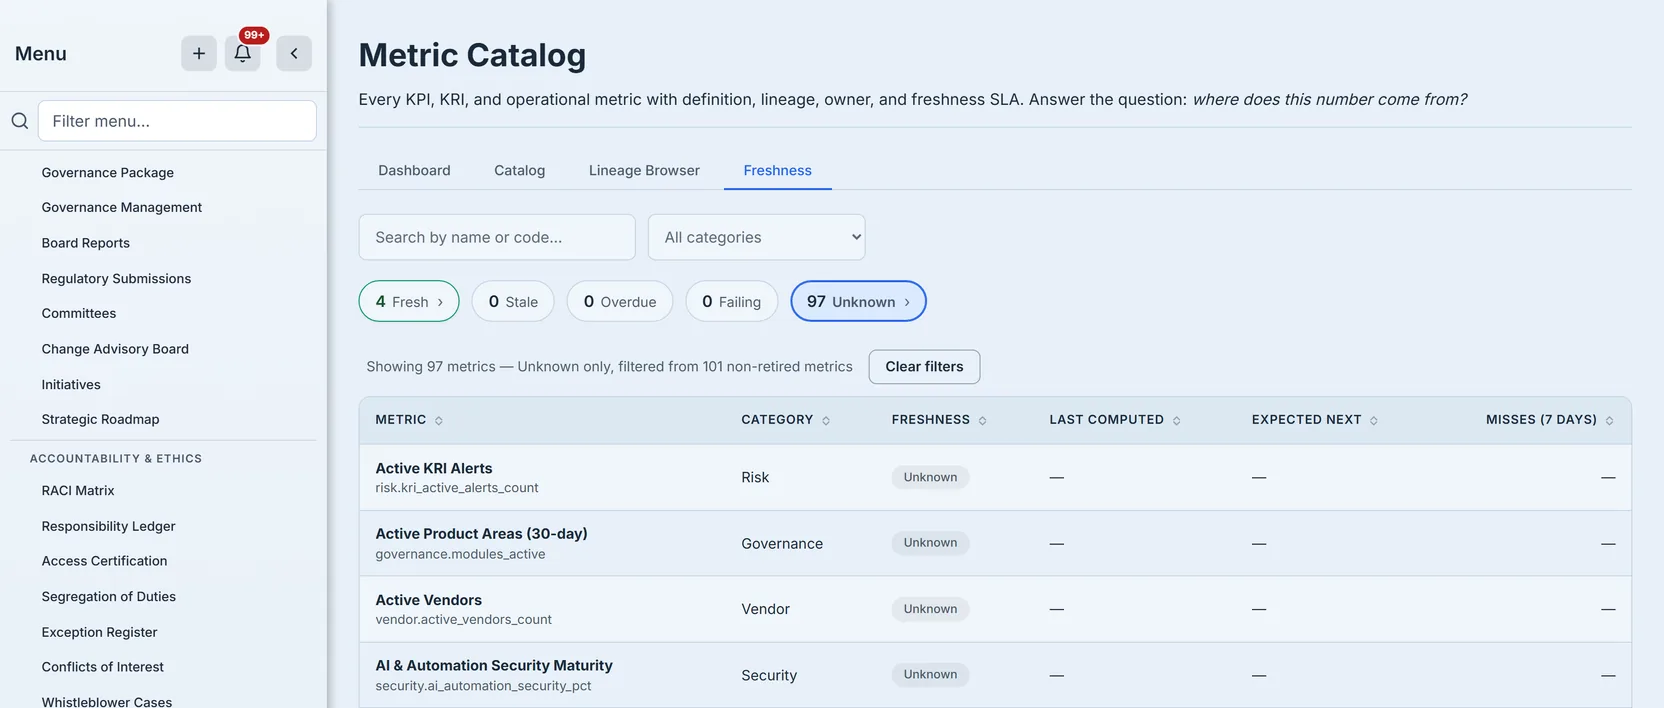
Freshness is derived, not stored by hand: a metric is fresh while it is inside its expected next computation, stale once it is past that but inside its SLA, and overdue beyond it. A metric on an on-demand cadence never decays, because there is no expected next tick to miss.
Failing is never set by the clock — it requires the compute job to say so — which keeps “nobody ran it” and “it ran and broke” as different answers. Conflating those two is how a broken pipeline hides behind a stale number.
Every chip with a count is a filter, and the screenshot above is taken with Unknown pressed — which is why the counter beneath it describes 97 metrics rather than the whole catalog. Beside the chips are the same search box and category filter the Catalog carries, matching on name or code, because a state filter that returns ninety-seven rows has only moved the problem. A chip reading zero is deliberately not clickable: filtering to an empty table is a dead end, not an affordance. Whenever anything is filtered — here or on the Catalog — a Clear filters button appears beside the count, because most of the ways into a narrowed table are indirect: a gap tile, an inventory tile, a chip, a By Category row. A reader can easily arrive at a filtered list without having touched a filter, and the way back should not be a guess.
Unknown is usually the largest bucket on a catalog nobody has computed yet, and it is not a failure — it is a metric that has never recorded a value, so it has no clock to have fallen behind. It stays grey at any count for that reason, while a non-zero fresh or overdue chip wears its state’s colour.
The detail panel also offers Recompute freshness for a single metric. Recording a snapshot already refreshes that metric’s state in the same operation, so this is for the other case: re-deriving where a metric stands without recording a new value — after an SLA changes, say, or when you want one metric’s state moved ahead of the org-wide sweep.
Working the page
Most organisations arrive here the same way: a platform-seeded catalog, nothing computed, and all three gap tiles amber. That is not a failure state, it is the starting position. The order that gets you out of it:
- Read the gaps before the totals. A total is not progress — “102 metrics, 100 of them with nobody accountable and 97 never measured” is the actual status. The three tiles tell you which problem you have — undefined derivation, unmeasured, or unowned — and they are different problems with different fixes.
- Assign owners first, because owners do the rest. No Owner is the only gap you can close from a desk in an afternoon, and it is the one that makes the other two somebody’s job rather than yours. Edit a metric, pick a person, move on.
- Narrow to what you actually report. You do not need 102 defensible metrics; you need the dozen that reach a board pack or an audit response to be defensible. Filter to those, and give them lineage and a first snapshot.
- Let the clock start. A metric with one snapshot and a cadence begins aging honestly — fresh, then stale, then overdue — and from then on the catalog tells you the truth without anyone maintaining a spreadsheet about it.
- Return to the gap tiles, not the metric list. They are the page’s scoreboard. Green on all three means every active metric can be traced, has been measured recently, and has a name attached to it.
The failure mode to avoid is authoring a hundred definitions before recording a single value. A defined metric that has never been computed is still unknown, still counted in No Snapshot, and still not evidence.
Where these definitions actually go
The catalog is not a filing cabinet that only auditors open. It is wired into the surfaces where the numbers get read.
Dashboard widgets declare which metric codes they display. When a dashboard renders, it collects the codes of every visible widget and fetches their definitions in one call — which is what fills the ⓘ affordance on a widget card. Click it and you get that metric’s definition, its owner and its freshness, taken from this catalog. A reader who challenges a figure on a dashboard is one click from the record you maintain here, which is precisely why an empty Business question or a missing owner is not a cosmetic gap.
Metric Forecasting is the other consumer, and it reads exactly what this page records: a metric’s snapshot history is the series the projection runs on. A metric with two snapshots cannot be forecast meaningfully — that page is downstream of the discipline this one enforces.
It is also stricter than you might expect, and this is where the value type comes back a third time: forecasting reads numeric snapshots only. A metric recording text values — the Boolean and Categorical types — has a perfectly valid history here and is simply out of scope there. Worth knowing before you type a metric as categorical and later wonder why it cannot be projected.
Metrics also depend on each other. A lineage step whose source type is metric points at another metric in this same catalog, so the register describes its own internal graph as well as its external sources.
Access
Metric Catalog belongs to the Governance module — one of the platform’s three core modules, alongside Compliance and Risk. In the sidebar it sits under Governance & Policy → Oversight & Accountability, with the other accountability surfaces: RACI, segregation of duties, the exception register and access certification.
Within that, the page is gated by org group through the governance-hub feature. A user whose groups do not carry it does not see the page at all — not a greyed-out link, not an empty page: the nav item is absent. So “I can’t find Metric Catalog” is usually a group-membership question, not a navigation one, and it is answered in Administration → Org Groups rather than by hunting the sidebar.
What this guide does not cover
It does not cover Metric Forecasting, its neighbouring tab on the same Metric Catalog row, which projects a metric forward from the snapshot series this page records — the register here, the analysis there. It does not cover Security Posture, which presents a curated set of framework scores to a reader — against a target, a published industry reference and an opt-in peer cohort; the catalog is where numbers are governed, not where they are displayed. And it does not cover Data Quality, which scores the completeness of the records feeding metrics rather than the metrics themselves.
Two more neighbours are worth knowing, because the code connects this page to each of them:
- Ten dashboards that read your data live — the delivered dashboards draw their figures from the metrics this catalog defines, and the ⓘ beside a figure is that definition. A figure showing a number this catalog does not define has nothing to explain itself with.
- Reading the compliance dashboard — the destination for most of these numbers, and the place a challenged figure is usually first questioned.