An auditor asking “how quickly would you know?” is asking about latency of detection, and every major framework has a version of the question. ISO 27001:2022 puts it under A.8.16 Monitoring activities — anomalies have to be evaluated and acted on, not merely recorded — with A.5.24 requiring that incident response be planned and prepared, not improvised at the moment of discovery. SOC 2 asks the same thing through CC7.2: the entity monitors system components and acts on identified anomalies.
The failure mode is rarely that the platform missed the event. It is that the event sat on a dashboard nobody had open. Your on-call engineer watches a pager. Your security team watches a SIEM. Your analysts query a warehouse. A control that fails at 02:00 has to arrive there, not wait politely in a web app until someone logs in.
Outbound webhooks at /app/integrations/webhooks are how Talarity pushes rather than waits. You subscribe an HTTPS endpoint you control to specific platform events; Talarity signs each delivery with HMAC-SHA256, retries on failure with exponential backoff, and records every attempt.
Who’s involved
- Platform administrator — creates subscriptions and holds the signing secret.
- The engineer who owns the receiver — implements the signature check and the verification handshake. Often not the same person, which is why the secret is copyable and the contract is on screen.
- Security / on-call — the consumer. Cares that
incident.raisedandsla.breachedarrive within seconds. - Auditor — wants the delivery record: what was sent, when, whether it arrived, and what happened when it didn’t.
Who can open this page. It sits under Integrations and requires organization-settings access plus a licence covering integrations. Access is granted by group rather than job title — see least privilege in practice.
The page in four tabs
The Dashboard is the operating view: how many subscriptions are live, how deliveries have gone over thirty days, and which events your organisation actually raised in the last week.
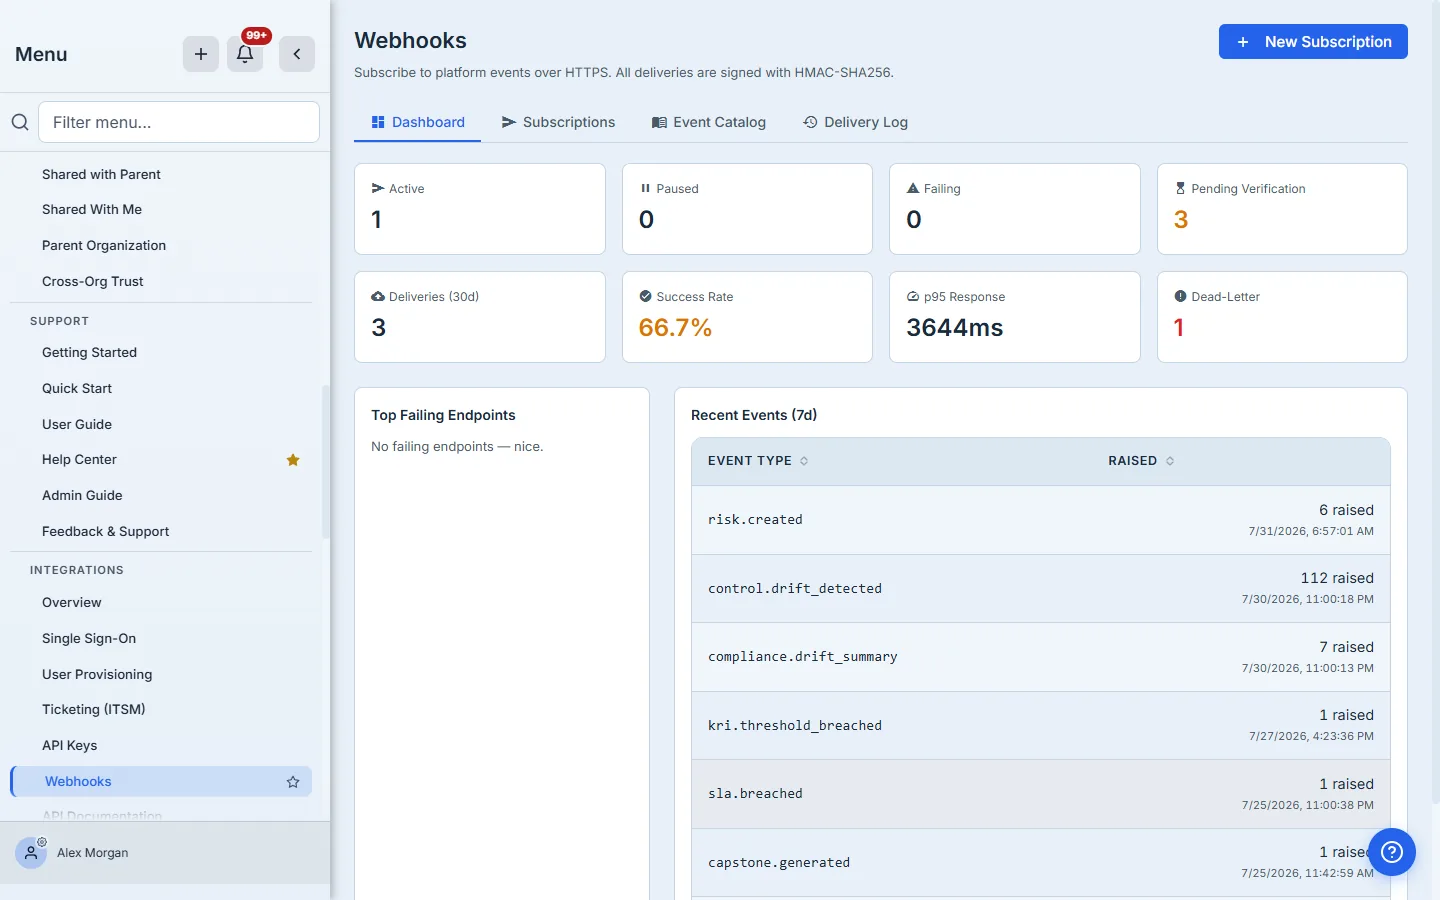
Read that Recent Events table before you subscribe to anything. It is the honest answer to “what does this organisation actually emit?” — 112 control.drift_detected in a week is a real signal worth routing; an event with no rows is one you can skip for now.
Step 1 — Find the events you need
The Event Catalog lists every subscribable event, grouped by domain, each with its code, a human name and a description of exactly when it fires.
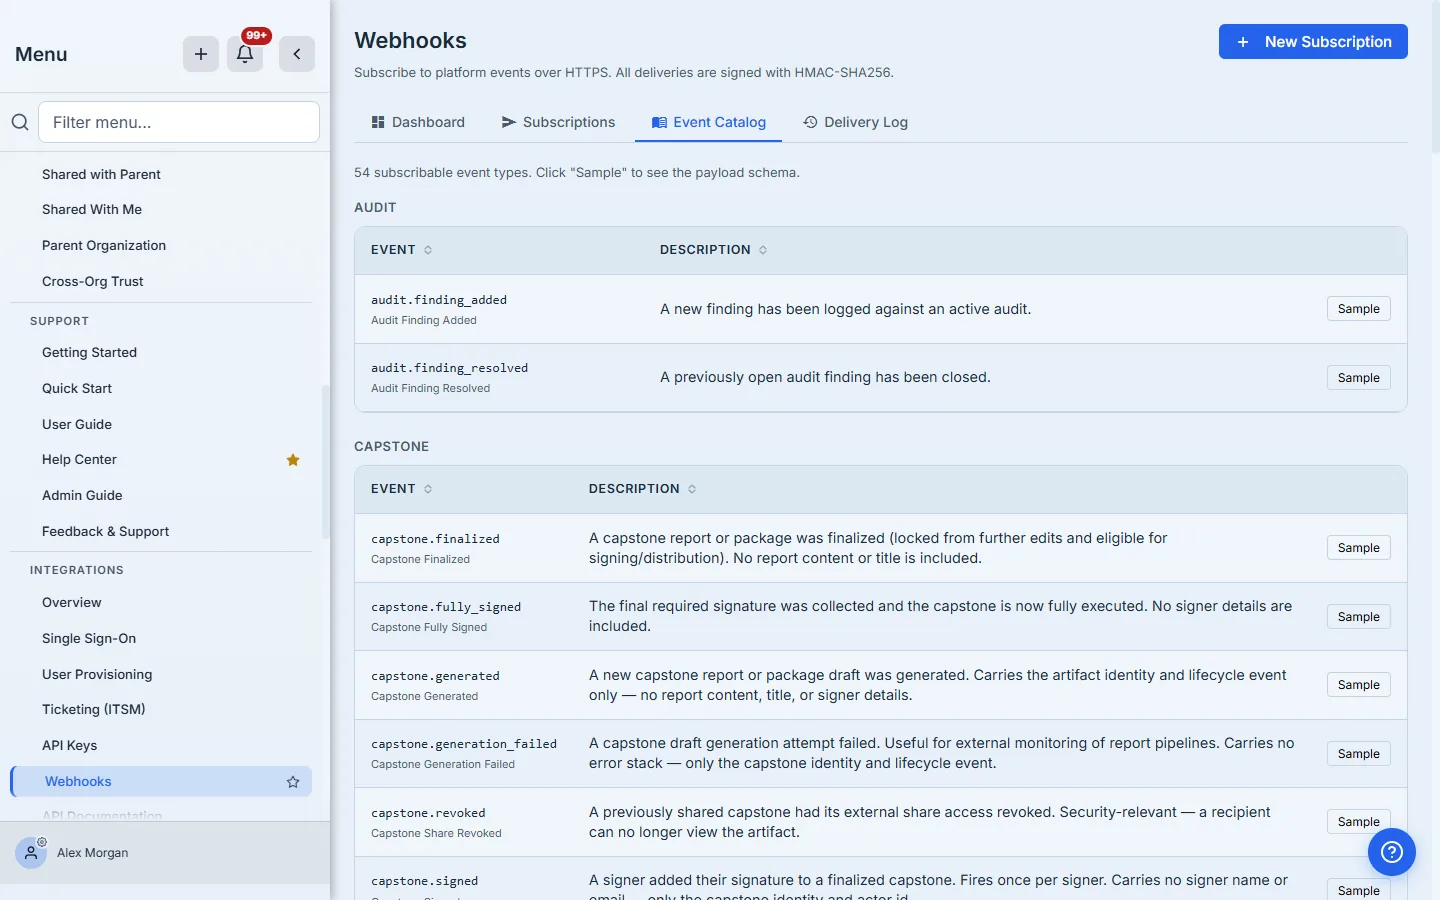
Descriptions are precise about what a payload does not carry. capstone.signed says “Fires once per signer. Carries no signer name or email — only the capstone identity and actor id.” That is deliberate: a webhook crosses a trust boundary to a third-party host, so the payloads carry identity and lifecycle, and content is fetched afterwards through the authenticated API by something holding your credentials.
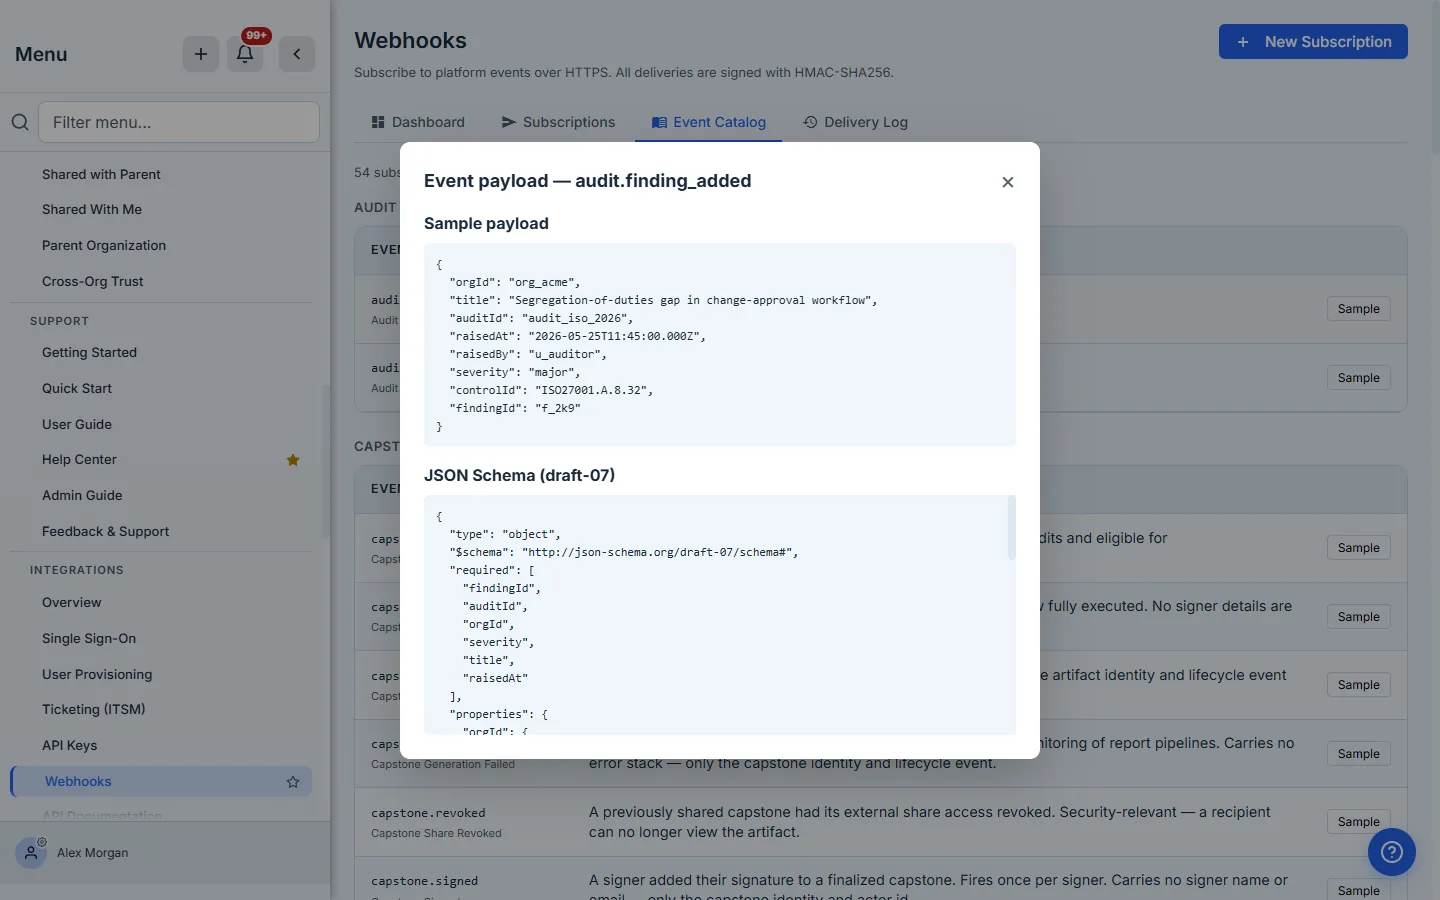
Sample shows both a realistic payload and its JSON Schema, so the person writing the receiver can generate types before a single event has fired.
Step 2 — Build the subscription
A subscription is a name, an HTTPS endpoint, a payload format, and a set of events. The event picker filters as you type and shows the human name beside each code, so you are choosing from meaning rather than from a wall of identifiers.
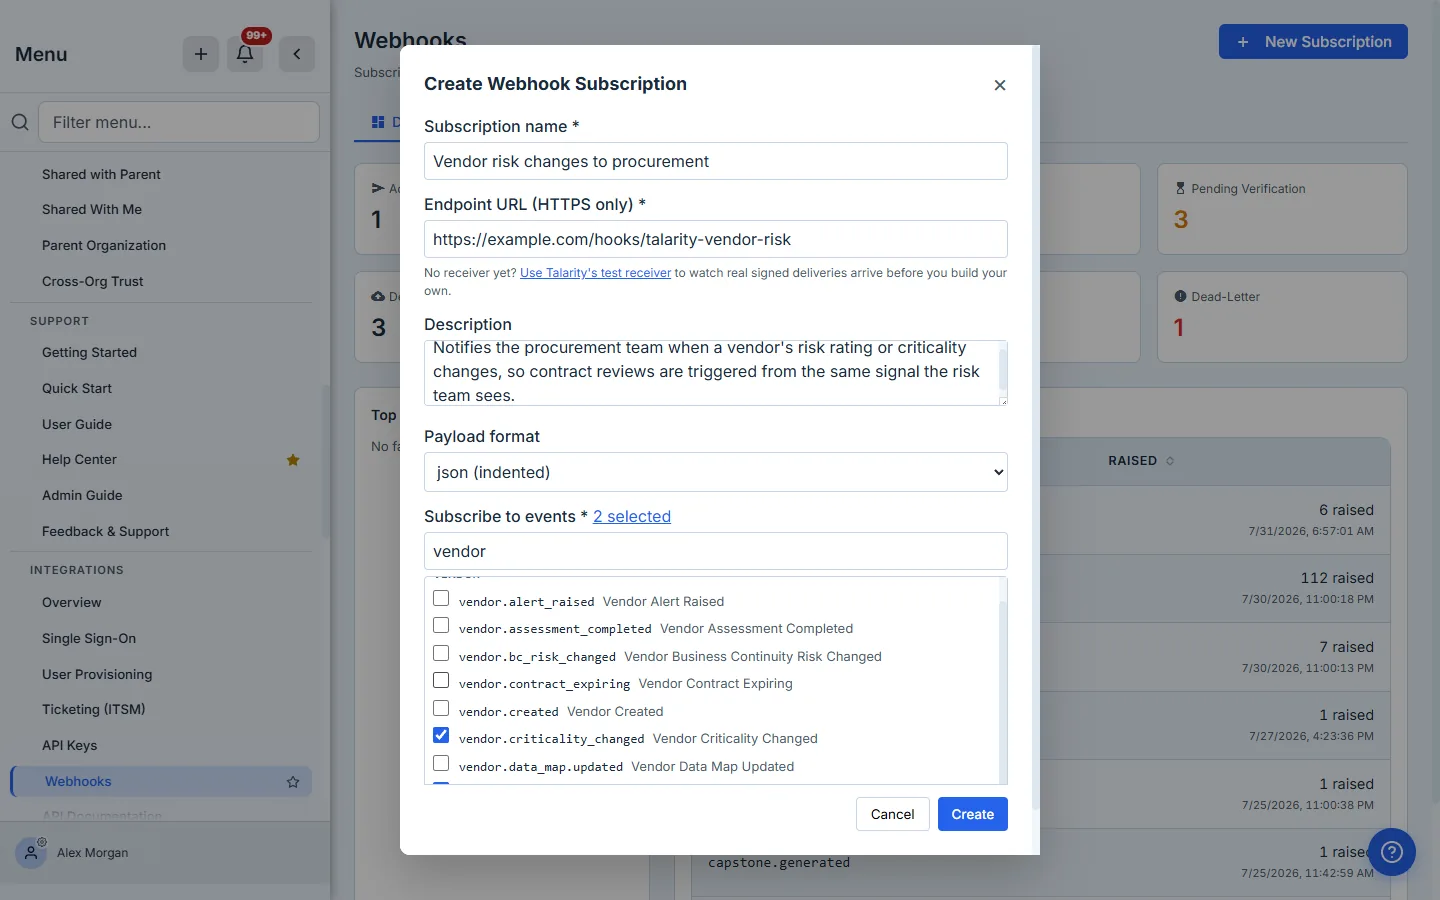
Two details that matter at real scale. Your selection survives filtering — search vendor, tick two, search incident, tick two more, and all four are still selected. The running count says so, and it is a link: click 2 selected and the list collapses to just your choices, which is the only practical way to review a set drawn from 54 options across several searches. And the endpoint must be HTTPS, validated before the subscription is created: the URL is resolved and screened against an outbound policy, so an endpoint pointing at a private or metadata address is refused at creation rather than at delivery time.
Four payload formats are offered — json, json_compact, cloudevents_v1 and form_urlencoded. Pick cloudevents_v1 if your consumer already speaks CloudEvents; the envelope changes but the data does not.
Step 3 — Take the signing secret
On creation Talarity mints a signing secret and shows it exactly once.
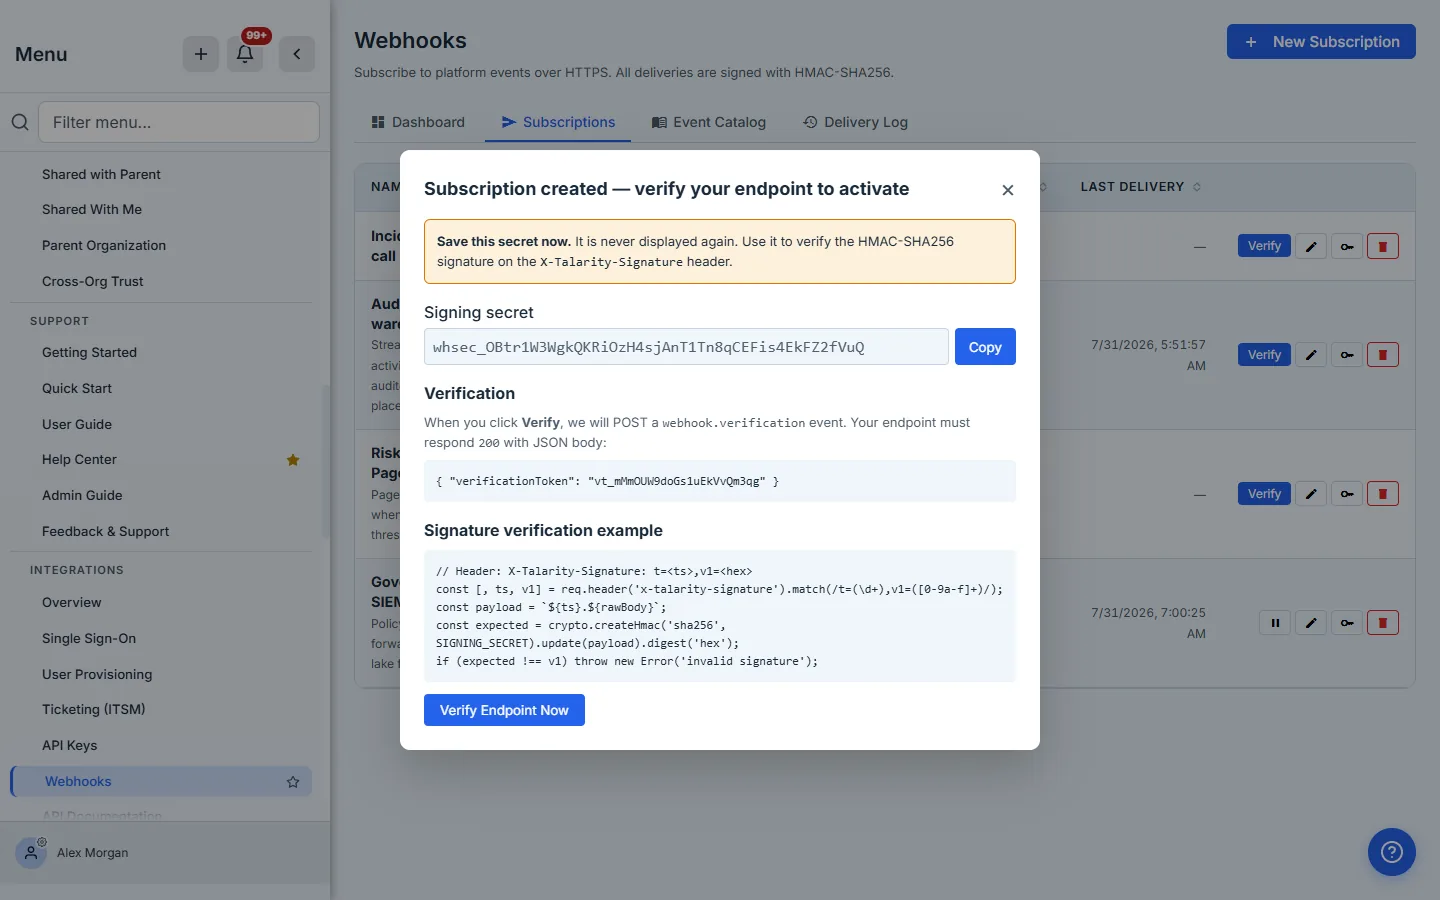
Every delivery carries an X-Talarity-Signature: t=<timestamp>,v1=<hex> header, where the hex is HMAC-SHA256(secret, "<timestamp>.<raw body>"). The modal ships the verification code with it, because the single most common webhook defect in the wild is a receiver that accepts anything posted to its URL.
Verify the signature over the raw body, before parsing. Re-serialising JSON changes whitespace and key order, and the signature will never match. Compare in constant time. Reject timestamps outside a few minutes so a captured request cannot be replayed at leisure.
If you lose the secret, Rotate on the subscription row mints a new one — also shown once. New deliveries are signed with the new secret from that moment; deliveries already in flight against the old one still complete, so a rotation does not strand the queue. Update your receiver promptly all the same.
Step 4 — Prove you own the endpoint
A new subscription starts at Pending verification and sends nothing. To activate it, Talarity POSTs a webhook.verification event and your endpoint must answer 200 with a JSON body echoing the token it was sent. Passing that handshake proves you control the URL — the reason a subscription cannot silently start streaming your org’s events to an address someone typed by mistake.
That creates a chicken-and-egg problem for anyone who has not built a receiver yet, so Talarity ships one. Use Talarity’s test receiver fills the endpoint with a first-party URL that implements the contract properly: it answers only requests carrying a valid HMAC for a real subscription, echoes the verification token, and returns 200 to genuine deliveries. Point a subscription at it, watch real signed traffic arrive, then re-point at your own service once you know what a good request looks like.
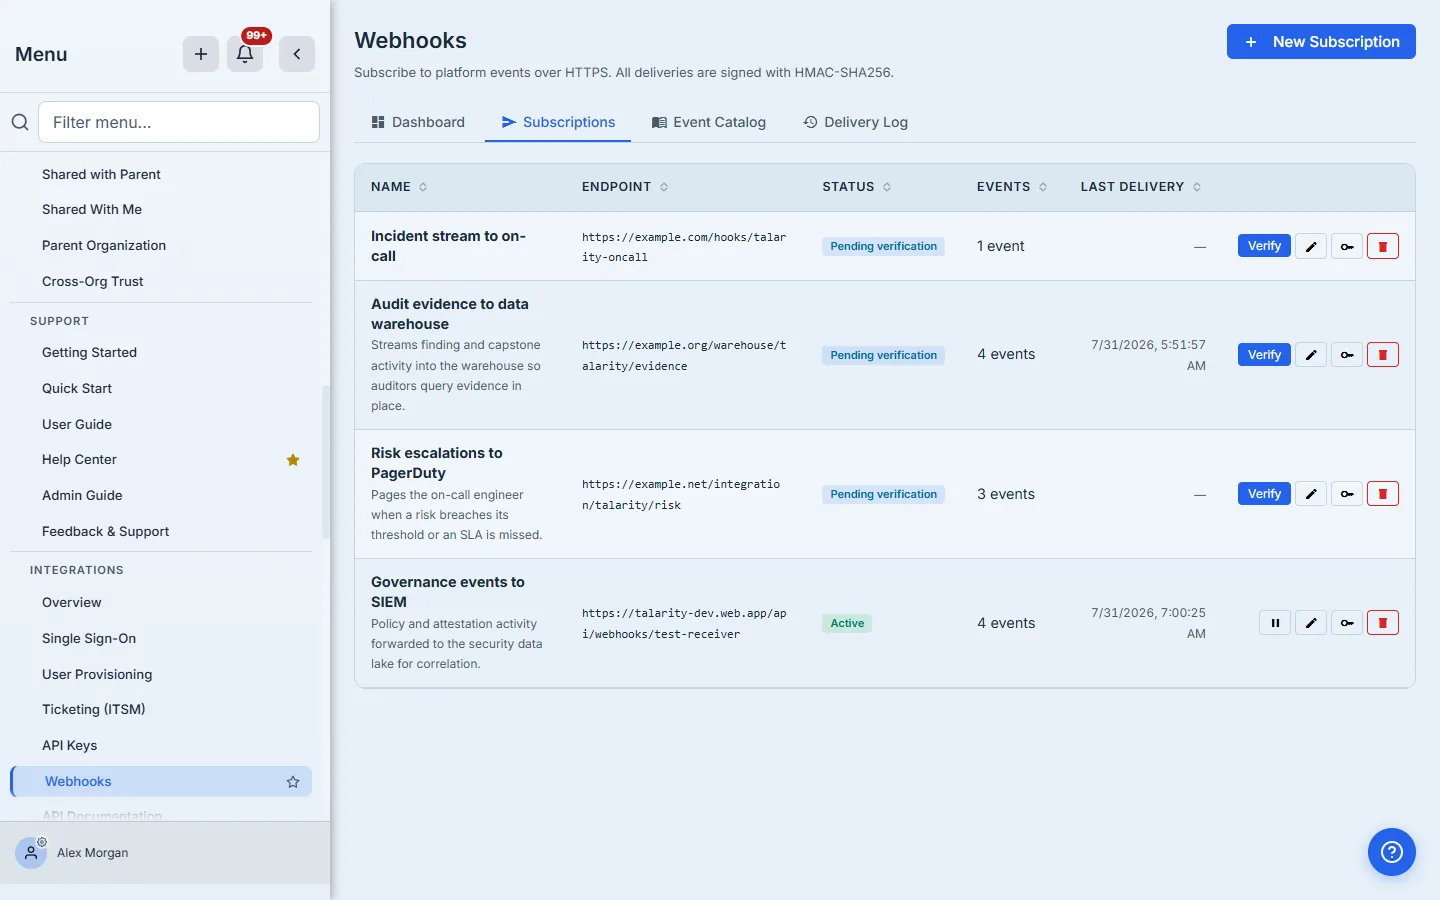
When verification fails, the reason is specific — HTTP 405, or “Response body did not include verificationToken JSON field” — followed by a restatement of the contract. That is the difference between a diagnosable integration and an afternoon of guessing.
Step 5 — Watch the deliveries
Every attempt is recorded: which event, what status, the HTTP code your endpoint returned, how long it took, and which attempt number it was.
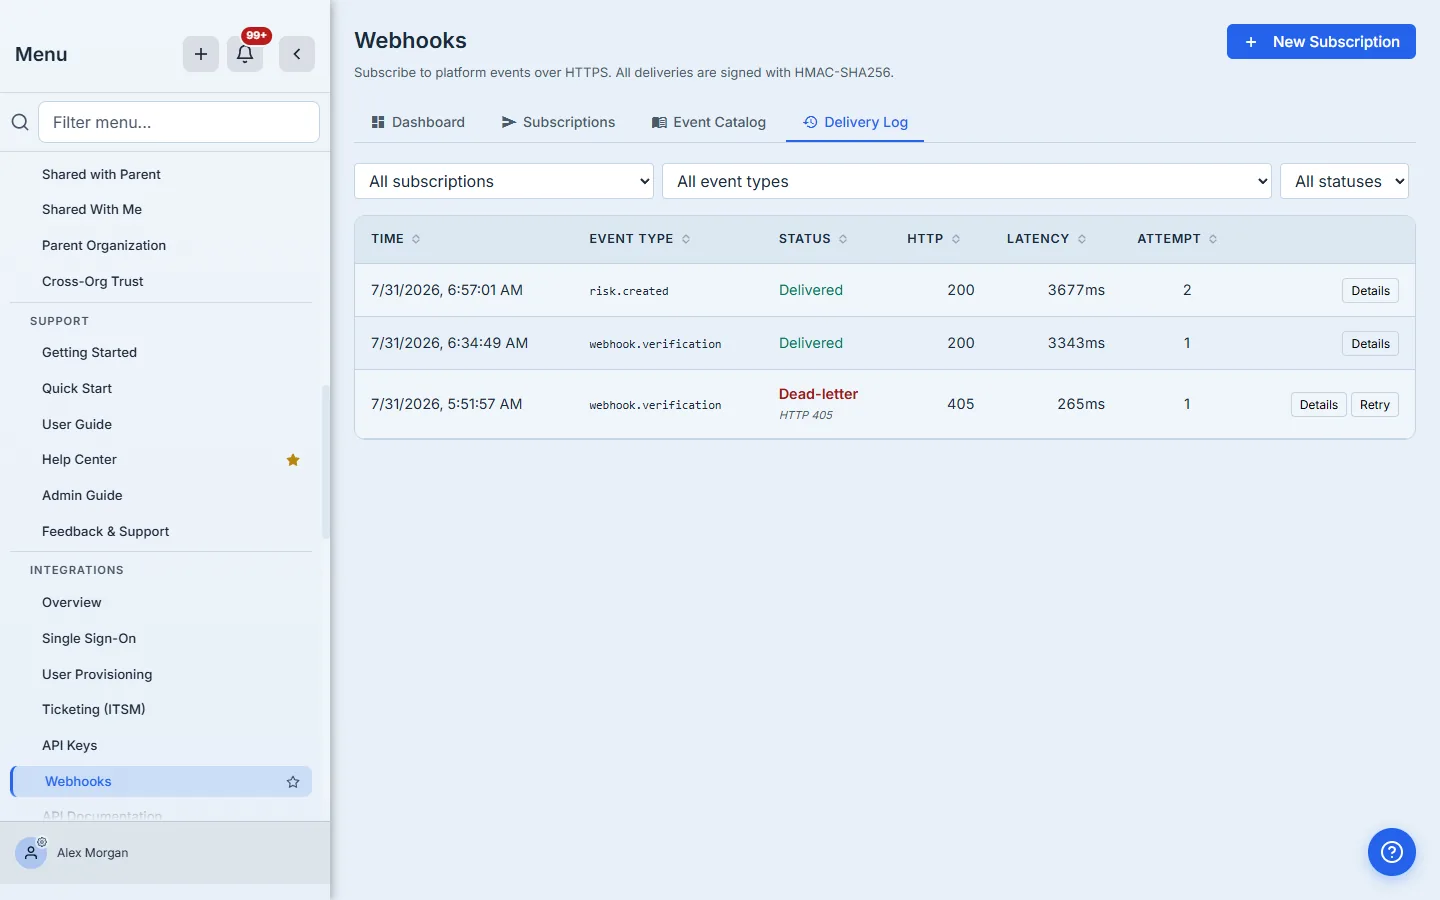
Three things in that log are worth reading carefully.
Attempt 2. Deliveries are queued, then delivered by a worker on a fifteen-minute sweep. A first attempt that fails is retried with exponential backoff and jitter — five attempts by default, from thirty seconds out to an hour — so a receiver that is briefly down does not lose events.
Dead-letter. Once the retry ladder is exhausted the delivery stops being retried automatically and is marked dead-lettered. It is not deleted: it stays in the log with its final HTTP status, and Retry re-queues it by hand after you have fixed the receiver. The HTTP 405 above is an endpoint that exists but refuses POST — exactly what an unimplemented receiver looks like.
Latency. p95 Response on the dashboard is your receiver’s p95, not ours. If it climbs, the queue behind it grows.
The three filters narrow by subscription, event type and status, and the event filter lists human names beside the codes.
Details on any row opens the delivery itself — the timing, the exact payload that was sent, and the body your endpoint returned.
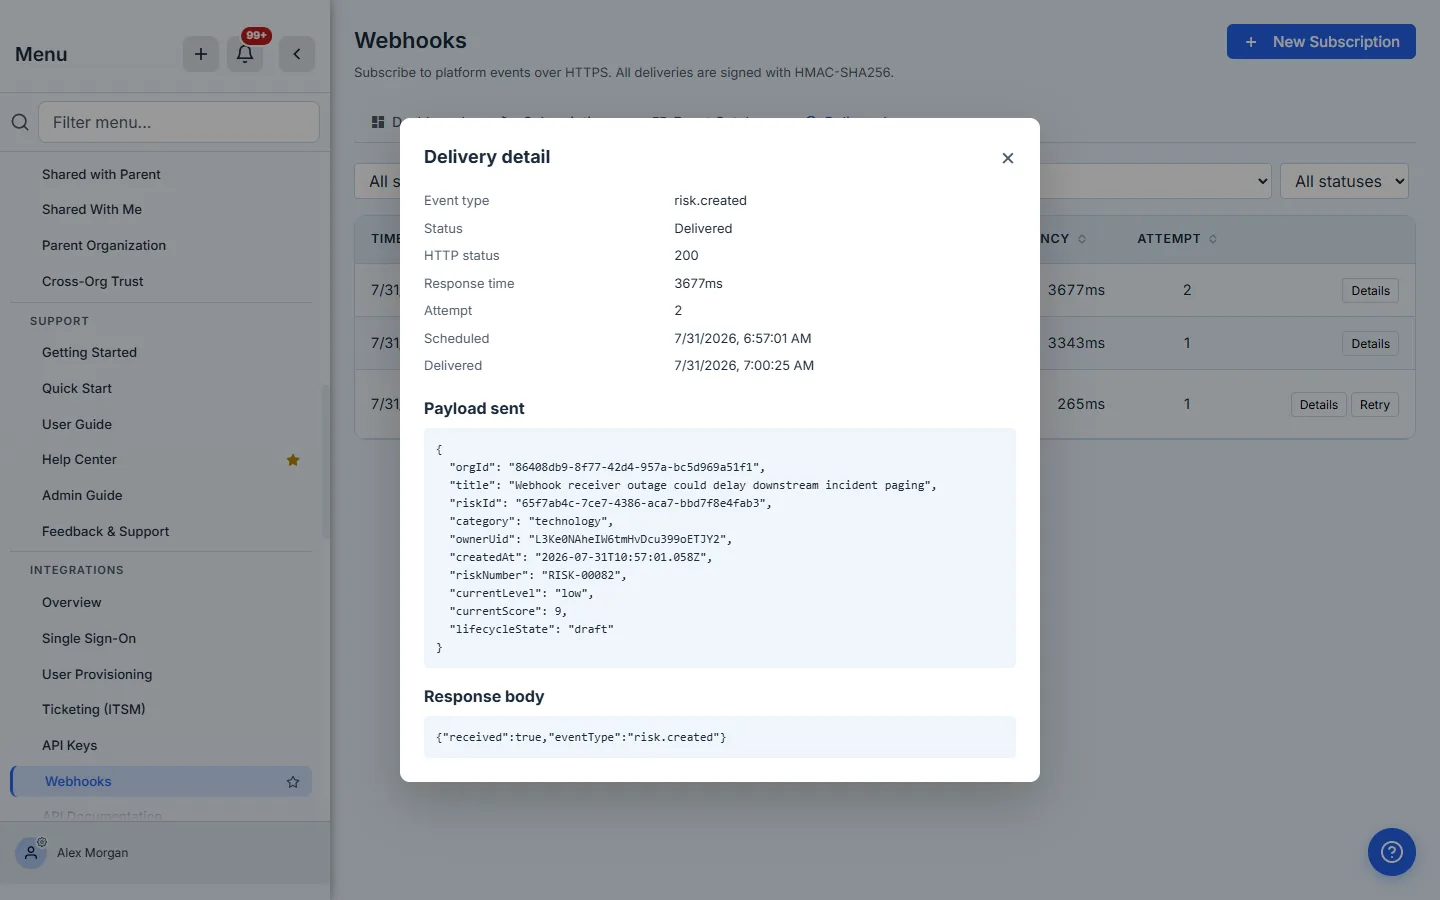
That is the view to open when a receiver rejects something and nobody can agree on what was sent. If the event log entry has aged out, the modal says so rather than showing an empty box — an absent payload and a payload of {} are different facts.
Step 6 — Change what you receive
Subscriptions are editable. Reopen one to rename it, change format, or adjust the event set — the picker opens with your current selection already ticked and counted.
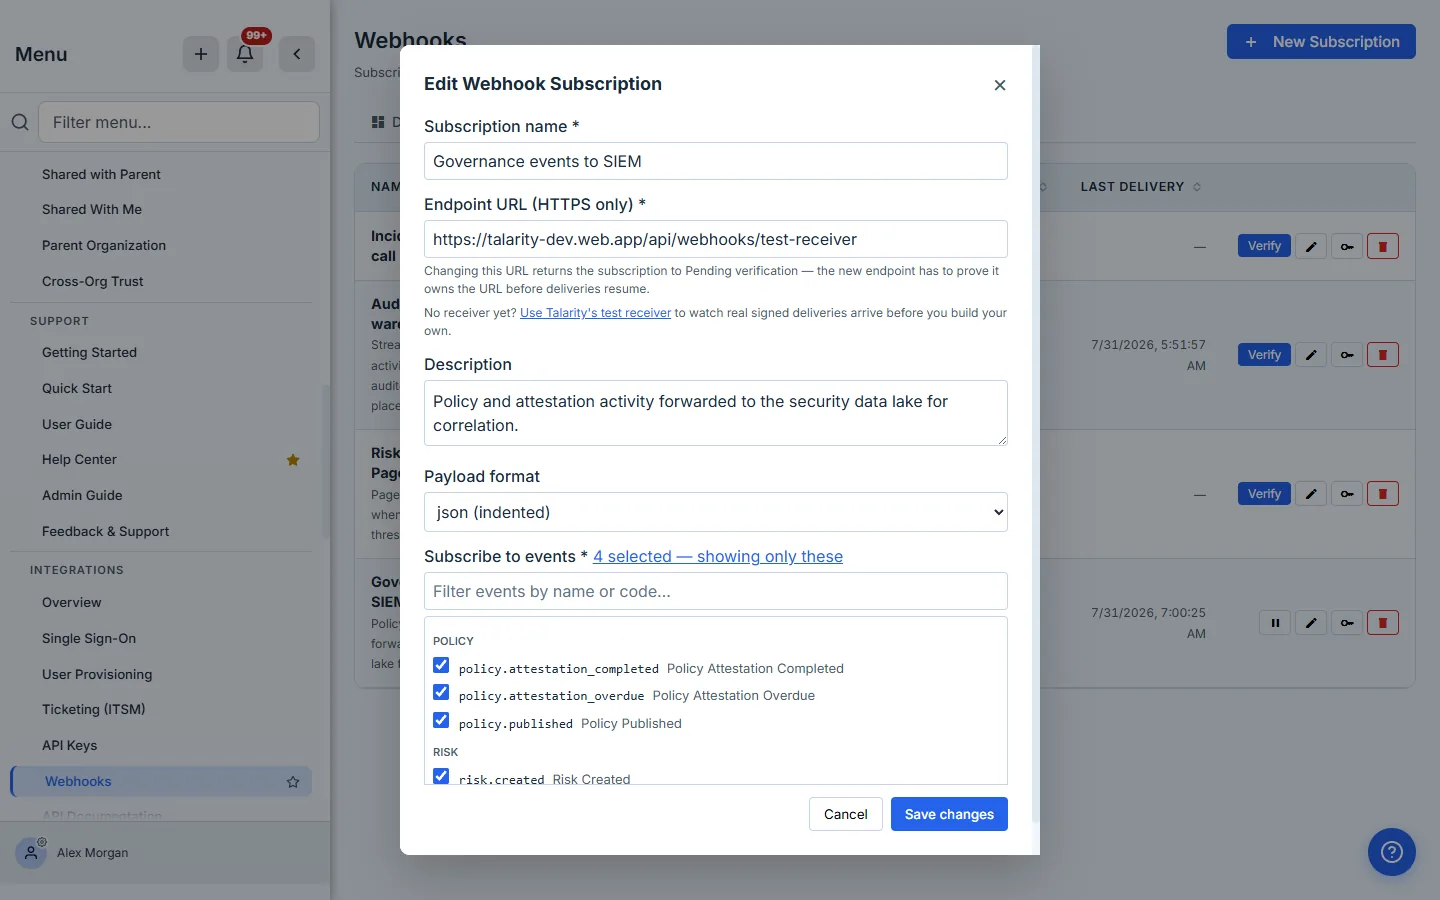
Changing the endpoint URL returns the subscription to Pending verification and mints a fresh verification token — the old URL was proven, the new one has not been. The form says so before you save. Changing only the event set leaves an active subscription active.
Pause stops delivery without destroying the subscription or its secret; resume picks it back up. Use it during receiver maintenance instead of deleting and rebuilding, which would mint a new secret and force re-verification.
Choosing what to subscribe to
The temptation is to tick everything. Resist it: a subscriber that receives all 54 event types becomes a firehose nobody reads, which is the dashboard problem again with extra steps.
A pattern that works:
- Pager / on-call —
incident.raised,sla.breached,kri.threshold_breached. Things that need a human tonight. - SIEM —
policy.published,policy.attestation_completed,user.created,user.deactivated. Governance and identity changes worth correlating against other telemetry. - Warehouse —
audit.finding_added,audit.finding_resolved,capstone.generated,capstone.fully_signed. Volume you want to query later, not be woken by.
Three subscriptions with distinct event sets beat one with everything, because pause, rotate and failure isolation are all per-subscription.
What you walk away with
- Platform events arriving in the systems your team already watches, within seconds rather than at next login.
- A signed, replay-resistant delivery channel your receiver can verify — with the verification recipe shipped alongside the secret.
- A per-attempt delivery record with retries, dead-lettering and manual retry, which is the evidence an auditor wants when asking how quickly you would know.
- A first-party test receiver, so the integration can be rehearsed end-to-end before your own service exists.
Related reading: the Talarity REST API for the authenticated reads a webhook payload deliberately leaves to you. For connectors that pull data in rather than push it out, see deciding what to plug into your GRC platform — the Integrations hub catalogues every one of them alongside the live health of the ones you run.